Pesq. agropec. bras., Brasília, v.48, n.9, p.1285-1294, set. 2013 DOI: 10.1590/S0100-204X2013000900013
on biochemical profiling and antioxidant capacity
Jasminka Milivojević(1), Vera Rakonjac(1), Milica Fotirić Akšić(1), Jelena Bogdanović Pristov(2) and Vuk Maksimović(2)
(1)University of Belgrade, Faculty of Agriculture, Nemanjina 6, 11080 Belgrade, Serbia. E‑mail: jasminka@agrif.bg.ac.rs, verak@agrif.bg.ac.rs, fotiric@agrif.bg.ac.rs (2)University of Belgrade, Institute for Multidisciplinary Research, Kneza Višeslava 1a, 11000 Belgrade, Serbia. E‑mail: mala@imsi.rs, maxivuk@imsi.rs
Abstract – The objective of this work was to evaluate the biochemical composition of six berry types belonging to Fragaria, Rubus, Vaccinium and Ribes genus. Fruit samples were collected in triplicate (50 fruit each) from 18 different species or cultivars of the mentioned genera, during three years (2008 to 2010). Content of individual sugars, organic acids, flavonols, and phenolic acids were determined by high performance liquid chromatography (HPLC) analysis, while total phenolics (TPC) and total antioxidant capacity (TAC), by using spectrophotometry. Principal component analysis (PCA) and hierarchical cluster analysis (CA) were performed to evaluate the differences in fruit biochemical profile. The highest contents of bioactive components were found in Ribes nigrum
and in Fragaria vesca, Rubus plicatus, and Vaccinium myrtillus. PCA and CA were able to partially discriminate between berries on the basis of their biochemical composition. Individual and total sugars, myricetin, ellagic acid, TPC and TAC showed the highest impact on biochemical composition of the berry fruits. CA separated blackberry, raspberry, and blueberry as isolate groups, while classification of strawberry, black and red currant in a specific group has not occurred. There is a large variability both between and within the different types of berries. Metabolite fingerprinting of the evaluated berries showed unique biochemical profiles and specific combination of bioactive compound contents.
Index terms: bioactive compounds, metabolite fingerprinting, multivariate analysis, nutraceuticals, small fruits.
Classificação e diversidade de pequenas frutas quanto
ao perfil bioquímico e capacidade antioxidante
Resumo – O objetivo deste trabalho foi avaliar a composição bioquímica de seis espécies de pequenas frutas dos gêneros Fragaria, Rubus, Vaccinium e Ribes. As amostras das frutas foram coletadas em triplicata (com 50 frutas cada) de 18 diferentes espécies ou cultivares dos gêneros mencionados, durante três anos (2008 a 2010). Os teores individuais de açúcares, ácidos orgânicos, flavonóis e ácidos fenólicos foram determinados por cromatografia líquida de alta performance (HPLC), e os fenóis totais (FT) e a capacidade antioxidante total (CAT), por meio de espectrofotometria. As análises de componente principal (ACP) e de agrupamento hierárquico (AH) foram utilizadas para avaliar as diferenças no perfil bioquímico das frutas. Os maiores teores de compostos bioativos foram encontrados em Ribes nigrum e em Fragaria vesca, Rubus plicatus
e Vaccinium myrtillus. ACP e AH foram capazes de discriminar parcialmente as frutas com base em sua
composição bioquímica. Os acúcares totais e individuais, a miricetina, o ácido elágico, FT e CAT foram os parâmetros que mais impactaram na avaliação da composição bioquímica das pequenas frutas. AH fez a separação de amora‑preta, framboesa e mirtilo como grupos isolados, porém a classificação do morango, da groselha‑preta e da groselha‑vermelha, em um grupo específico, não ocorreu. Há grande variabilidade entre e dentro dos diferentes tipos de frutas vermelhas. A identificação de metabólitos das pequenas frutas mostrou perfis bioquímicos únicos e combinações específicas de teores de compostos bioativos.
Termos par indexação: compostos bioativos, identificação de metabólitos, análise multivariada, nutracêuticos, pequenas frutas.
Introduction
Berries are widely recognized for their nutritional quality and potential health benefits. Recent increasing
interest in nutraceuticals and functional foods has
led plant breeders to initiate selection of crops such as strawberries (Tulipani et al., 2008), raspberries
(Fotirić Akšić et al., 2011; Mikulić‑Petkovšek et al.,
Materials and Methods
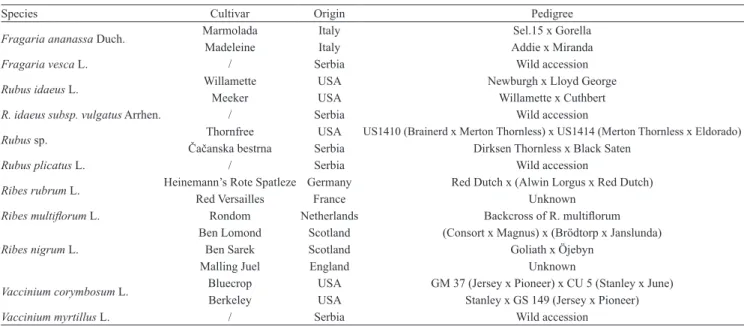
Eighteen different types of berry were used in this study. Samples included different species, cultivars and accessions from native population (Table 1). Berries of Fragaria vesca L., Rubus idaeus L., Rubus plicatus L., and Vaccinium myrtillus L. were harvested from native populations in Western Serbia
(municipality of Dragačevo), and compared to ripe
fruits of two strawberry cultivars of F.ananassa Duch. ('Marmolada' and 'Madeleine'), two raspberry cultivars ('Willamette' and 'Meeker'), two thornless blackberry
cultivars ('Thornfree' and 'Čačanska bestrna'), and
two high bush blueberry cultivars ('Berkeley', and 'Bluecrop'). Additionally, three black currant cultivars ('Ben Lomond', 'Ben Sarek' and 'Malling Juel') and three
red currant cultivars ('Heinemann’s Rote Spatleze', 'Rondom' and 'Red Versailles') were analyzed. The
study was conducted during three consecutive years
(2008–2010) in an experimental field established in
the same region where native fruit were harvested (43o46'N, 20o12'E, 350 m altitude).
The region is characterized by moderate continental
climate. The average temperature during the growing seasons was 16.3°C, approximately 2°C higher than the long‑term average (1980–2007). Precipitation in the growing seasons was different in the investigated years. The highest level of 997.5 mm was recorded in 2010, when it surpassed the long‑year average by 25%. Fruit samples were collected in triplicate (50 fruit each). Only berries at the commercial maturity stage were harvested. Approximately 100 g of fruit from each replicate were pureed, and samples of 5 g were
homogenized for 1 min in 20 mL extraction solution
containing methanol/water/hydrochloric acid (70:30:5
ratio by volume). The homogenate was filtered using a filter paper, and the filtrates were centrifuged at
3,000 g for 15 min. Methanol supernatant was divided
into aliquots, and frozen at ‑80°C until analysis.
Analyses of sugars were performed on a
chromatographic system Waters Breeze, (Waters,
Milford, MA, USA) containing 1,525 binary pumps system, a thermostated column compartment, and
the Waters 2465 electrochemical detector, equipped
with gold working electrodes and hydrogen‑referent electrodes. Separation was performed on CarboPac PA1 (Dionex, Sunnyvale, CA, USA) 250x4 mm column
equipped with corresponding CarboPac PA1 guard
column. Sugars were eluted with 200 mmol L‑1 NaOH and currants (Milivojević et al., 2012) with higher
contents of taste‑ and health‑related compounds. Considering genetic differences among wild relatives from natural population and cultivars of berries, a potential variability can be observed in their contents and composition of bioactive compounds (Remberg et al., 2007). Berries are rich sources of phytochemicals such as sugars, organic acids, and phenolics. Sugars and organic acids are their main soluble constituents and have major effect on taste and fruit ripeness, or even represent a suitable index of consumer’s acceptability
(Kafkas et al., 2006; Tosun et al., 2009). Type and quantity of individual compounds also affect fruit taste;
therefore, the composition and concentration of these
compounds may reflect changes in fruit quality (Kafkas
et al., 2006).
An important question that arises from the preliminary screening of berries relates to the polyphenolic profiles of the species, specifically, which components within these profiles contribute most to differences in bioactive
potential. These compounds are mainly represented
by flavonoids, phenolic acids, and tannins, which are
known as natural antioxidants (Määttä‑Riihinen et al., 2004). Ellagic acid is the predominant phenolic acid in strawberries, raspberries and blackberries (Koponen et al., 2007), and chlorogenic acid in blueberries (Zheng & Wang, 2003). Apart from phenolic acids, these berries
have been shown to contain high levels of flavonols, such as quercetin, kaempferol, and myricetin, as well as their
derivatives (primarily glycosides), which may provide
health benefits as dietary antioxidants (Siriwoharn et al.,
2004). Combining this information with an increasing knowledge of the structure of these compounds has enabled the selection of parents for breeding new, highly health‑protective cultivars for the future.
Since computational methods were introduced
for the metabolic fingerprinting methodology, a new
analytical level has been reached. Principal component analysis (PCA) and cluster analysis (CA) (Terry et al.,
2005; Sarbu et al., 2012) can help to classify individual
samples according to their metabolite composition. Correlation among variables is common in this type of
biological data, which can simplify the characterization
of berry fruits (Badenes et al., 2000).
Pesq. agropec. bras., Brasília, v.48, n.9, p.1285‑1294, set. 2013
DOI: 10.1590/S0100‑204X2013000900013 for 20 min, at 1.0 mL min‑1 flow rate at 30°C constant
temperature. Signals were detected in a pulse mode with the following waveform: E1 = +0.1 V, for 280 ms; E2 = +0.75 V, for 150 ms; E3 = ‑0.85 V, for 150 ms and within 80 ms of integration time. Filter timescale was 0.2 s, and range was 200 to 500 nA for the full mV
scale. Data acquisition and evaluation were carried out
by Waters Empower 2 software (Waters, Milford, MA, USA).
A HP 1100 photo diode array detector, HP1100 series, (Hewlett Packard, Palo Alto, CA, USA) was adjusted to 210 nm, with a reference signal at 600 nm,
in order to analyze organic acids. An anion exchange
column Aminex HPX‑87H, (Bio‑Rad Lab, CA, USA) 300×7.8 mm was used with 5 mmol L‑1 H
2SO4 as a mobile phase. The elution was isocratic, with 0.6 mL min‑1 flow rate at 30°C. Data acquisition and evaluation was done by Agilent Chemstation software (Agilent Chemstation, Palo Alto, CA, USA).
Ascorbic acid was measured by a Merck RQflex reflectometer (Merck KGaA, Darmstadt, Germany)
as described by Pantelidis et al. (2007). Results were expressed as milligrams of ascorbic acid per 100 grams of fresh weight (mg 100 g‑1).
Quantification of individual phenolic compounds
was done by reversed phase HPLC analysis. Samples were injected in a Waters HPLC system consisting of 1,525 binary pumps, thermostat, and 717+ autosampler connected to a Waters 2996 diode array detector (Waters,
Milford, MA, USA). Chromatograms were gathered in
3D mode with extracted signals at specific wavelengths
for different compounds (370, 326, and 254 nm, respectively). Separation of phenolics was performed on a Symmetry C‑18 RP column (125×4 mm) with a
5 μm particle diameter (Waters, Milford, MA, USA)
connected to the appropriate guard column. With
the following gradient profile, two mobile phases,
A (0.1% phosphoric acid) and B (acetonitrile), were used at 1 mL min‑1 flow: first 20 min from 10−22% B, next 20 min of linear rise up to 40% B, followed by 5 min reverse to 10% B, and an additional 7.5 min
of equilibration time. Data acquisition and spectral evaluation for peak confirmation were done with Waters
Empower 2 Software (Waters, Milford, MA, USA). The method employed for determination of total
phenolic content (TPC) was based on Folin−Ciocalteu
phenol reagent and spectrophotometric determination (Singleton & Rossi Junior, 1965). Results were
expressed as milligrams of gallic‑acid equivalent per
gram of fresh weight (mg g‑1).
Total antioxidant capacity (TAC) was measured
by 2,2´azino‑bis‑3‑ethylbenzothiazoline‑6‑sulfonic
acid (ABTS) method according to Arnao et al. (1999). Results were expressed as milligrams of ascorbic acid
equivalent per gram of fresh weight (mg g‑1).
Analysis of variance was performed to evaluate the
influence of genotypes on chemical composition of fruits, and the least significant difference (LSD) test
Table 1. Analyzed species and cultivars of different berries, their origin, and parentage.
Species Cultivar Origin Pedigree
Fragaria ananassa Duch. Marmolada Italy Sel.15 x Gorella
Madeleine Italy Addie x Miranda
Fragaria vesca L. / Serbia Wild accession
Rubus idaeus L. Willamette USA Newburgh x Lloyd George
Meeker USA Willamette x Cuthbert
R. idaeus subsp. vulgatus Arrhen. / Serbia Wild accession
Rubus sp. Thornfree USA US1410 (Brainerd x Merton Thornless) x US1414 (Merton Thornless x Eldorado)
Čačanska bestrna Serbia Dirksen Thornless x Black Saten
Rubus plicatus L. / Serbia Wild accession
Ribes rubrum L. Heinemann’s Rote Spatleze Germany Red Dutch x (Alwin Lorgus x Red Dutch)
Red Versailles France Unknown
Ribes multiflorum L. Rondom Netherlands Backcross of R. multiflorum
Ribes nigrum L.
Ben Lomond Scotland (Consort x Magnus) x (Brödtorp x Janslunda)
Ben Sarek Scotland Goliath x Öjebyn
Malling Juel England Unknown
Vaccinium corymbosum L. Bluecrop USA GM 37 (Jersey x Pioneer) x CU 5 (Stanley x June)
Berkeley USA Stanley x GS 149 (Jersey x Pioneer)
was used to compare the means, at 5% probability. To identify the patterns of multi‑trait variation in berry fruit collection, principal component analysis (PCA) and cluster analysis (CA) were applied. Average values from three‑year measurements were use in the statistical analyses. CA was performed by Ward’s method using
Euclidean distances. Pearson´s correlation coefficient
between traits was determined. Data analysis was made using the Statistica for Windows software, version 5.0 (StatSoft Inc., Tulsa, OK, USA) statistical package.
Results and Discussion
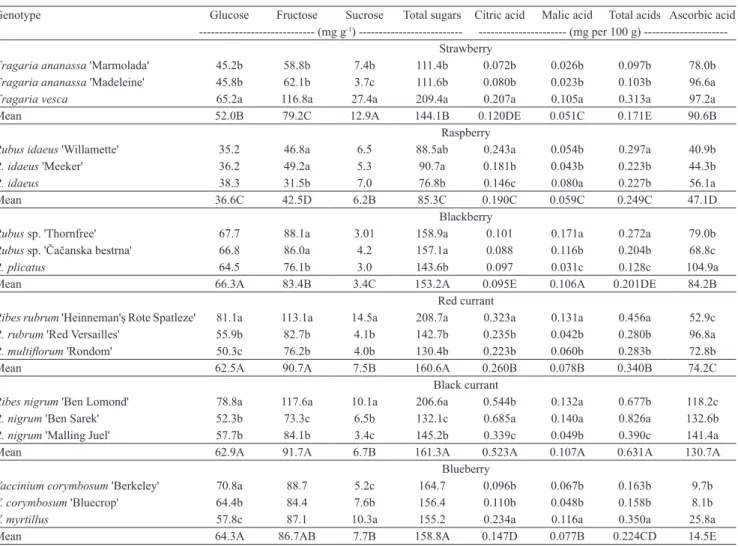
Fructose was the predominant sugar in all studied types of berry (species and cultivars), followed by glucose (Table 2). Monosacharides were present in large amounts compared with the sucrose portion,
probably due to high invertase activity during the
final maturation stages. For strawberries, the highest
average contents of glucose, fructose and sucrose were obtained in F. vesca. In raspberries, significant differences were observed for fructose and total sugar content (Table 2). The total sugar content corresponds to the sum of glucose, fructose and sucrose reported by Wang et al. (2008) for blueberries grown in a conventional culture system.
Citric and malic acids are the main organic acids in berry fruit species (Basson et al., 2010). In this study (Table 2), the main organic acid was citric acid, while
twice as low quantities of malic acid were observed
in all tested strawberries and blueberries. Raspberries
and red currants showed citric acid quantities three
times higher than malic acid, while in black currants
Table 2. Contents(1) of sugars, organic acids, and ascorbic acid of berry fruits(2).
Genotype Glucose Fructose Sucrose Total sugars Citric acid Malic acid Total acids Ascorbic acid ‑‑‑‑‑‑‑‑‑‑‑‑‑‑‑‑‑‑‑‑‑‑‑‑‑‑‑‑‑ (mg g‑1) ‑‑‑‑‑‑‑‑‑‑‑‑‑‑‑‑‑‑‑‑‑‑‑‑‑‑ ‑‑‑‑‑‑‑‑‑‑‑‑‑‑‑‑‑‑‑‑‑‑ (mg per 100 g) ‑‑‑‑‑‑‑‑‑‑‑‑‑‑‑‑‑‑‑‑‑
Strawberry
Fragaria ananassa 'Marmolada' 45.2b 58.8b 7.4b 111.4b 0.072b 0.026b 0.097b 78.0b Fragaria ananassa 'Madeleine' 45.8b 62.1b 3.7c 111.6b 0.080b 0.023b 0.103b 96.6a
Fragaria vesca 65.2a 116.8a 27.4a 209.4a 0.207a 0.105a 0.313a 97.2a
Mean 52.0B 79.2C 12.9A 144.1B 0.120DE 0.051C 0.171E 90.6B
Raspberry
Rubus idaeus 'Willamette' 35.2 46.8a 6.5 88.5ab 0.243a 0.054b 0.297a 40.9b
R. idaeus 'Meeker' 36.2 49.2a 5.3 90.7a 0.181b 0.043b 0.223b 44.3b
R. idaeus 38.3 31.5b 7.0 76.8b 0.146c 0.080a 0.227b 56.1a
Mean 36.6C 42.5D 6.2B 85.3C 0.190C 0.059C 0.249C 47.1D
Blackberry
Rubus sp. 'Thornfree' 67.7 88.1a 3.01 158.9a 0.101 0.171a 0.272a 79.0b
Rubus sp. 'Čačanska bestrna' 66.8 86.0a 4.2 157.1a 0.088 0.116b 0.204b 68.8c
R. plicatus 64.5 76.1b 3.0 143.6b 0.097 0.031c 0.128c 104.9a
Mean 66.3A 83.4B 3.4C 153.2A 0.095E 0.106A 0.201DE 84.2B
Red currant
Ribes rubrum 'Heinneman'ş Rote Spatleze' 81.1a 113.1a 14.5a 208.7a 0.323a 0.131a 0.456a 52.9c R. rubrum 'Red Versailles' 55.9b 82.7b 4.1b 142.7b 0.235b 0.042b 0.280b 96.8a
R. multiflorum 'Rondom' 50.3c 76.2b 4.0b 130.4b 0.223b 0.060b 0.283b 72.8b
Mean 62.5A 90.7A 7.5B 160.6A 0.260B 0.078B 0.340B 74.2C
Black currant
Ribes nigrum 'Ben Lomond' 78.8a 117.6a 10.1a 206.6a 0.544b 0.132a 0.677b 118.2c
R. nigrum 'Ben Sarek' 52.3b 73.3c 6.5b 132.1c 0.685a 0.140a 0.826a 132.6b
R. nigrum 'Malling Juel' 57.7b 84.1b 3.4c 145.2b 0.339c 0.049b 0.390c 141.4a
Mean 62.9A 91.7A 6.7B 161.3A 0.523A 0.107A 0.631A 130.7A
Blueberry
Vaccinium corymbosum 'Berkeley' 70.8a 88.7 5.2c 164.7 0.096b 0.067b 0.163b 9.7b
V. corymbosum 'Bluecrop' 64.4b 84.4 7.6b 156.4 0.110b 0.048b 0.158b 8.1b
V. myrtillus 57.8c 87.1 10.3a 155.2 0.234a 0.116a 0.350a 25.8a
Mean 64.3A 86.7AB 7.7B 158.8A 0.147D 0.077B 0.224CD 14.5E
(1)Mean values of a three year period (2008–2010). (2)Means followed by equal letters, lowercase within each berry fruit type and uppercase between fruit
Pesq. agropec. bras., Brasília, v.48, n.9, p.1285‑1294, set. 2013
DOI: 10.1590/S0100‑204X2013000900013 this ratio was 5:1. However, malic acid was found to be
dominant in blackberries. Kafkas et al. (2006) reported similar amounts of malic acids, but they did not detect citric acid in blackberry cultivars.
Berries, particularly black currant cultivars, are a
rich source of ascorbic acid (Milivojević et al., 2012).
The highest level of ascorbic acid was measured in 'Malling Juel'. Although the ascorbic acid content was on average 1.5 to 3 fold lower in strawberries, raspberries, blackberries and red currants, compared to black currants, their average values over 40 mg per 100 g of fresh weight are still high, and make them a rich source of vitamin C.
Differences were not always significant when
comparing the content of sugars, organic acids, and
vitamin C between wild berry species and cultivars.
Various factors may influence their biochemical
composition, such as genotype, growth conditions including environmental factors, and cultivation
techniques (Scalzo et al., 2005).
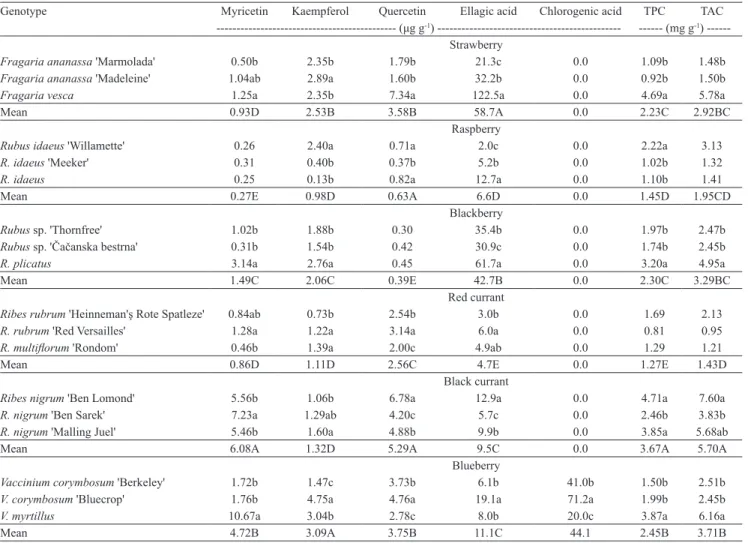
Great variability existed, however, among the
examined berries regarding content of individual
flavonols, in which black currants stand out (Table 3).
The highest average content of myricetin was detected in black currant 'Ben Sarek' and V. myrtillus, while
the highest values of quercetin was observed in black
currants, wild strawberry and blueberry ‘Bluecrop’
(over 4 μg g‑1 FW).
Significant differences in free ellagic acid were observed between all types of berries, in which strawberry
Table 3. Contents(1) of flavonols, phenolic acids and total phenolics (TPC), and total antioxidant capacity (TAC) of berry
fruits(2).
Genotype Myricetin Kaempferol Quercetin Ellagic acid Chlorogenic acid TPC TAC
‑‑‑‑‑‑‑‑‑‑‑‑‑‑‑‑‑‑‑‑‑‑‑‑‑‑‑‑‑‑‑‑‑‑‑‑‑‑‑‑‑‑‑‑‑ (μg g‑1) ‑‑‑‑‑‑‑‑‑‑‑‑‑‑‑‑‑‑‑‑‑‑‑‑‑‑‑‑‑‑‑‑‑‑‑‑‑‑‑‑‑‑‑‑‑‑ ‑‑‑‑‑‑ (mg g‑1) ‑‑‑‑‑‑
Strawberry
Fragaria ananassa 'Marmolada' 0.50b 2.35b 1.79b 21.3c 0.0 1.09b 1.48b
Fragaria ananassa 'Madeleine' 1.04ab 2.89a 1.60b 32.2b 0.0 0.92b 1.50b
Fragaria vesca 1.25a 2.35b 7.34a 122.5a 0.0 4.69a 5.78a
Mean 0.93D 2.53B 3.58B 58.7A 0.0 2.23C 2.92BC
Raspberry
Rubus idaeus 'Willamette' 0.26 2.40a 0.71a 2.0c 0.0 2.22a 3.13
R. idaeus 'Meeker' 0.31 0.40b 0.37b 5.2b 0.0 1.02b 1.32
R. idaeus 0.25 0.13b 0.82a 12.7a 0.0 1.10b 1.41
Mean 0.27E 0.98D 0.63A 6.6D 0.0 1.45D 1.95CD
Blackberry
Rubus sp. 'Thornfree' 1.02b 1.88b 0.30 35.4b 0.0 1.97b 2.47b
Rubus sp. 'Čačanska bestrna' 0.31b 1.54b 0.42 30.9c 0.0 1.74b 2.45b
R. plicatus 3.14a 2.76a 0.45 61.7a 0.0 3.20a 4.95a
Mean 1.49C 2.06C 0.39E 42.7B 0.0 2.30C 3.29BC
Red currant
Ribes rubrum 'Heinneman'ş Rote Spatleze' 0.84ab 0.73b 2.54b 3.0b 0.0 1.69 2.13
R. rubrum 'Red Versailles' 1.28a 1.22a 3.14a 6.0a 0.0 0.81 0.95
R. multiflorum 'Rondom' 0.46b 1.39a 2.00c 4.9ab 0.0 1.29 1.21
Mean 0.86D 1.11D 2.56C 4.7E 0.0 1.27E 1.43D
Black currant
Ribes nigrum 'Ben Lomond' 5.56b 1.06b 6.78a 12.9a 0.0 4.71a 7.60a
R. nigrum 'Ben Sarek' 7.23a 1.29ab 4.20c 5.7c 0.0 2.46b 3.83b
R. nigrum 'Malling Juel' 5.46b 1.60a 4.88b 9.9b 0.0 3.85a 5.68ab
Mean 6.08A 1.32D 5.29A 9.5C 0.0 3.67A 5.70A
Blueberry
Vaccinium corymbosum 'Berkeley' 1.72b 1.47c 3.73b 6.1b 41.0b 1.50b 2.51b
V. corymbosum 'Bluecrop' 1.76b 4.75a 4.76a 19.1a 71.2a 1.99b 2.45b
V. myrtillus 10.67a 3.04b 2.78c 8.0b 20.0c 3.87a 6.16a
Mean 4.72B 3.09A 3.75B 11.1C 44.1 2.45B 3.71B
(1)Mean values of a three year period (2008–2010). (2)Means followed by equal letters, lowercase within each berry fruit type and uppercase between fruit
showed the highest values. Among strawberries, F. vesca is the richest source of this component. In
accordance with earlier findings for ellagic acid content in Georgia‑grown blackberries (Sellappan et al., 2002), significant quantities of this acid were also detected in the analyzed blackberry cultivars, which showed
values twice as low as that recorded in R. plicatus (wild accession). This discrepancy is most likely due to genetic differences, since fruit of R. plicatus were taken from native populations in Western Serbia, whereas
the studied cultivars were derived from hybridization.
Chlorogenic acid, which contributes to the tart taste of fruit and fruit products, was present only in blueberries. Vaccinium myrtillus had the lowest chlorogenic acid
content, whereas higher quantities were detected in the
blueberry cultivars, as previously reported by Kalt et al. (2007).
The total phenolic contents (TPC) recorded in the wild accession F. vesca, V. myrtillus, and R. plicatus were higher than those obtained for the corresponding cultivars (Table 3). Besides black currants, the highest total antioxidant capacities (TAC) were also recorded in V. myrtillus, F. vesca, and R. plicatus. Such results confirm the need to evaluate the diversity of native populations of these species and, based on this, well‑focused breeding
programs can create new cultivars specifically selected
for improved antioxidant potential.
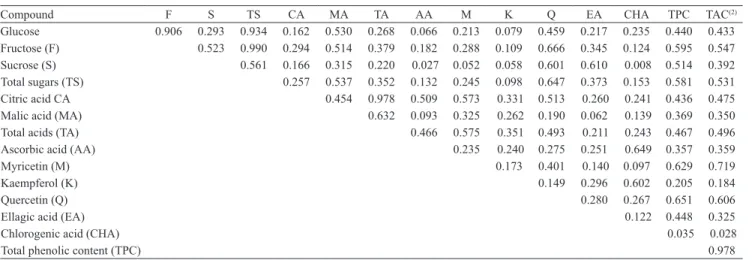
In this study, all variables related to sugars (Table 4) were correlated with each other (r = 0.523 – 0.990).
These results seem to be quite expectable, since quantities of monosaccharide directly influence the
amount of total sugars. The only exception was the
absence of correlation between sucrose and glucose content, which coincides with the results reported by Drogoudi et al. (2008), for apricot. Both citric and
malic acids were significantly correlated to total acid
content (r = 0.978 and 0.632, respectively), but did not correlate to each other, which was also previously stated by Zheng et al. (2009). Ascorbic acid contents did not correlate with most of the studied variables, contrarily to what was previously reported by Ramaiya et al. (2013). These authors, however, studied passion fruit in an absolutely diverse climatic condition than the ones observed in the present study. Ascorbic acid was
significantly correlated with citric acid (r= 0.509) and chlorogenic acid (r = ‑ 0.649). In the group of phenolics, none of the components correlated with each other, indicating that those traits are genetically independent. A positive correlation was obtained between TPC and sugars (r = 0.514 – 0.595), which agrees with the results of Abidi et al. (2011). The only exception was the absence of the relationship between TPC and glucose content. A good correlation between sugar content and levels of phenolic substances in berries are due to the role of sugars in the regulation of phenolic biosynthesis
(Pirie & Mullins, 1977). Significant correlation between quercetin and myricetin, on one side, and with TPC, on the other, suggest that those two flavonols represent the
most important components of TPC. Positive correlation was also observed between both TAC and fructose, and TAC and total sugars. The ascorbic acid content did not contribute to the antioxidant activity of berries, as shown by the weak correlation observed here and by Luximon‑Ramma et al. (2003).
Table 4. Correlation matrix among biochemical compounds studied in berry fruits(1).
Compound F S TS CA MA TA AA M K Q EA CHA TPC TAC(2)
Glucose 0.906 0.293 0.934 0.162 0.530 0.268 0.066 0.213 0.079 0.459 0.217 0.235 0.440 0.433
Fructose (F) 0.523 0.990 0.294 0.514 0.379 0.182 0.288 0.109 0.666 0.345 0.124 0.595 0.547
Sucrose (S) 0.561 0.166 0.315 0.220 0.027 0.052 0.058 0.601 0.610 0.008 0.514 0.392
Total sugars (TS) 0.257 0.537 0.352 0.132 0.245 0.098 0.647 0.373 0.153 0.581 0.531
Citric acid CA 0.454 0.978 0.509 0.573 0.331 0.513 0.260 0.241 0.436 0.475
Malic acid (MA) 0.632 0.093 0.325 0.262 0.190 0.062 0.139 0.369 0.350
Total acids (TA) 0.466 0.575 0.351 0.493 0.211 0.243 0.467 0.496
Ascorbic acid (AA) 0.235 0.240 0.275 0.251 0.649 0.357 0.359
Myricetin (M) 0.173 0.401 0.140 0.097 0.629 0.719
Kaempferol (K) 0.149 0.296 0.602 0.205 0.184
Quercetin (Q) 0.280 0.267 0.651 0.606
Ellagic acid (EA) 0.122 0.448 0.325
Chlorogenic acid (CHA) 0.035 0.028
Total phenolic content (TPC) 0.978
Pesq. agropec. bras., Brasília, v.48, n.9, p.1285‑1294, set. 2013
DOI: 10.1590/S0100‑204X2013000900013 The strong correlation between TPC and TAC suggests
that the antioxidant activity of berries is derived mainly from the content of phenolic compounds in fruits, which agrees with Ehala et al. (2005).
Four principal components (PC), with eigenvalues higher than 1, were obtained from principal component
analysis (Table 5). Variables with correlation coefficient
larger than 0.70 (absolute value) were determined only in PC1. Those were glucose, fructose, total sugars, ellagic acid, total phenolics and TAC. The highest contribution of PC2 (over 0.60 of absolute value) corresponded to
variables such as malic acid, myricetin, quercetin and
ascorbic acid content. High loading on PC3 (over 0.60 of absolute value) had chlorogenic and ascorbic acid. Finally, the largest scores of PC4 were due to total acids content.
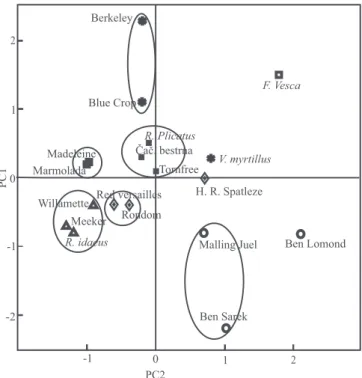
The first component was mainly related to variation
of total sugars, TPC and TAC (Figure 1). By this component, genotypes with relatively high content were located on the right side, such as black currant 'Ben Lomond' and F. vesca wild accession. Strawberry genotypes 'Marmolada' and 'Madeleine', and three raspberry genotypes were on the left side: 'Willamette' and 'Meeker', as well as R. idaeus wild accession, which have relatively low content of these components.
The distribution along the second component was
mainly caused by malic acid, myricetin, quercetin and
ascorbic acid content. Quercetin and ascorbic acid were
positively connected to PC2, whereas malic acid and myricetin negatively. In this regard, blueberry 'Bluecrop', which has a low content of ascorbic acid and myricetin, stood at the positive site of this PC2, but black currant
‘Ben Sarek’, which is characterized by high contents of
vitamin C and myricetin, stood at the negative site. A grouping of genotypes on scatter plot shows that the separation was done according to the types of berries (Figure 1). The two strawberry cultivars almost completely overlapped, and the wild accession was found in the exactly opposite side of the scatter plot. This can be explained by the fact that the cultivars belong to octaploid (2n = 8x = 56) species F. ananassa, while the wild accession belongs to the diploid (2n = 2x = 14) species F. vesca. Therefore, with increasing ploidy, level content of bioactive components decreased. Raspberries on one side, and blackberry genotypes, on the other, are part of a homogeneous group, suggesting that these two types
of berry fruits have a unique profile for the content of
bioactive components, regardless of whether they are
cultivars or wild relatives. Grouping of red currant was
such that 'Rondom' and 'Red Versailles' were separated
as a unique group, while 'Heinneman’s Rote Spatleze'
was located on the opposite side. All cultivars of black
currant were found in the same square of the scatter
plot. According to their position, 'Ben Sarek' and
'Malling Juel' can be classified in one group, while 'Ben
Lomond' is independent. Two blueberry cultivars were
classified in the same group, while the wild accession V. myrtillus distinguished as an independent genotype. Previously, this analysis was applied to biochemical
profiling of many berries (Bordonaba & Terry, 2008; Kim et al., 2009; Gorinstein et al., 2013), and good
results for the discrimination of species or cultivars were also obtained.
Red currant 'Heinneman’s Rote Spatleze' and black
currant 'Ben Lomond', together with strawberry F. vesca and blueberry V. myrtillus wild accessions, were separated from the other genotypes of the same groups. Discrimination of these four genotypes indicated that they have very high contents of some compounds. In
that regard, 'Heinneman’s Rote Spatleze' has high total
sugar content (Table 2), whereas 'Ben Lomond' has high content of total sugar, myricetin, and TPC, and the highest TAC (Table 3). Blueberry was primarily
characterized by a high myricetin content and TAC.
The wild strawberry accession F. vesca showed the
best biochemical profile, which was distinguished by a Table 5. Principal component loadings of the variables.
Variable PC1 PC2 PC3 PC4
Glucose 0.707* 0.344 0.011 0.479
Fructose 0.848* 0.311 0.088 0.313
Sucrose 0.586 0.323 0.376 0.029
Total sugars 0.838* 0.353 0.110 0.352
Citric acid 0.394 0.541 0.406 0.338
Malic acid 0.627 0.668 0.232 0.006
Total acids 0.612 0.210 0.021 0.487
Ascorbic acid 0.013 0.664 0.673 0.088
Myricetin 0.691 0.631 0.196 0.121
Kaempferol 0.596 0.248 0.545 0.331
Quercetin 0.039 0.686 0.338 0.447
Ellagic acid 0.786* 0.159 0.100 0.141
Chlorogenic acid 0.338 0.481 0.666 0.343
Total phenolic content 0.855* 0.065 0.003 0.407 Total antioxidant content 0.831* 0.010 0.109 0.413
Eigenvalue 6.1753 2.86 1.74 1.61
Variance (%) 41.2 19.0 11.6 10.7
Cumulative (%) 41.2 60.2 71.8 82.6
high content of total sugars (Table 2), quercetin, ellagic
acid, TPC, and TAC (Table 3). Therefore, these genotypes can be recommended as the best sources of health‑related compounds for fresh consumption and processing.
Similar groupings were obtained using the CA, by which the 18 berry genotypes were clustered into six main groups (Figure 2). Although the number of
clusters corresponds to the number of berry fruit types, separation according to the type was not fully shown. On the obtained dendrogram, blackberries (group II), raspberries (group IV) and blueberries (group VI) were established as a separate group. Clustering of strawberry, and red and black currant into separate groups was not achieved. Thus, two strawberry cultivars ('Marmolada' and 'Madeleine') and two red currant cultivars ('Rondom' and 'Red Versailles') were
classified in the same group (group I). Black currant 'Ben Sarek' and 'Malling Juel' formed group III. Greatest
heterogeneity was observed in group V, in which wild strawberry accession, red currant ‘Heinneman’s Rote
Spatleze’, and black currant ‘Ben Lomond’ are located.
Conclusions
1. Metabolite fingerprinting of Fragaria, Rubus, Vaccinium, and Ribes wild and cultivated berries shows that most of the biochemical compounds differ between and within the studied berry types.
2. Total phenolic content followed a pattern similar to total antioxidant capacity in all tested samples.
3. A large number of metabolite contents are correlated, which allows for the use of a smaller number of variables without losing much information.
4. For characterizing and classifying the types
berries, individual and total sugars, myricetin, ellagic acid, total phenolic content, and total antioxidant
capacity have the highest influence.
5. The best composition of bioactive components is found in the cultivars of black currant (Ribes nigrum), as well as in Fragaria vesca, Rubus plicatus and Vaccinium myrtillus.
Acknowledgements
To the Serbian Ministry of Education, Science and Technological Development (projects III46008,
III43010, 173040, and 173017), for financial support.
References
ABIDI, W.; JIMĖNEZ, S.; MORENO, M.Á.; GOGORCENA, Y.
Evaluation of antioxidant compounds and total sugar content in a nectarine [Prunus persica (L.) Batsch] progeny. International
Journal of Molecular Sciences, v.12, p.6919‑6935, 2011. DOI:
10.3390/ijms12106919.
ARNAO, M.B.; CANO, A.; ACOSTA, M. Methods to measure
the antioxidant activity in plant material. A comparative Figure 1. Scatter plot for PC1 and PC2, obtained by
biochemical profiles of 18 diverse genotypes representing six different berry fruit types: strawberry ( ), raspberry ( ), blackberry ( ), red currant ( ), black currant ( ), and blueberry ( ).
Figure 2. Hierarchical analysis dendrogram obtained by Ward’s method using 15 biochemical compounds of berry fruits.
-1 1 2
1 2
-1
-2
R. idaeus
Willamette
R. Plicatus
Ben Sarek Čač. bestrna
H. R. Spatleze Red versailles
Tornfree Marmolada
Madeleine
F. Vesca
Meeker Rondom
Malling Juel Ben Lomond
Blue Crop
PC2 Berkeley
V. myrtillus
P
1
C
0 0
Distance Bluecrop
V.myrtillus Berkeley Ben Lemond H. R. SpatlezeF. vesca R. idaeusMeeker Willamette Malling Juel Ben Sarek R. plicatus Cacanska bestrnaThomfree Red VersallesRondom Madeleine Marmolada
0 50 100 150 200 250 300 350
Group 1
Group 2
Group 3
Group 4
Group 5
Pesq. agropec. bras., Brasília, v.48, n.9, p.1285‑1294, set. 2013
DOI: 10.1590/S0100‑204X2013000900013 discussion. Free Radical Research, v.31, p.89‑96, 1999. DOI:
10.1080/10715769900301371.
BADENES, M.L.; MARTINEZ‑CALVO, J.; LLÁCER, G. Analysis of a germplasm collection of loquat (Eriobotrya
japonica Lindl.). Euphytica, v.114, p.187‑194, 2000. DOI:
10.1023/A:1003950215426.
BASSON, C.E.; GROENEWALD, J.‑H.; KOSSMANN, J.; CRONJE, C.; BAUER, R. Sugar and acid‑related quality attributes and enzyme activities in strawberry fruits: invertase is the main sucrose hydrolysing enzyme. Food Chemistry, v.121, p.1156‑1162, 2010. DOI: 10.1016/j.foodchem.2010.01.064.
BORDONABA, J.G.; TERRY, L.A. Biochemical profiling and
chemometric analysis of seventeen UK‑grown black currant cultivars. Journal of Agricultural and Food Chemistry, v.56, p.7422‑7430, 2008. DOI: 10.1021/jf8009377.
DROGOUDI, P.D.; VEMMOS, S.; PANTELIDIS, G.; PETRI, E.; TZOUTZOUKOU, C.; KARAYIANNIS, I. Physical characters
and antioxidant, sugar, and mineral nutrient contents in fruit from 29 apricot (Prunus armeniaca L.) cultivars and hybrids. Journal
of Agricultural and Food Chemistry, v.56, p.10754‑10760, 2008.
DOI: 10.1021/jf801995x.
EHALA, S.; VAHER, M.; KALJURAND, M. Characterization of phenolic profiles of Northern European berries by capillary
electrophoresis and determination of their antioxidant activity.
Journal of Agricultural and Food Chemistry, v.53, p.6484‑6490,
2005. DOI: 10.1021/jf050397w.
FOTIRIĆ AKŠIĆ, M.; RADOVIĆ, A.; MILIVOJEVIĆ, J.; NIKOLIĆ, M.; NIKOLIĆ, D. Genetic parameters of yield
components and pomologic properties in raspberry seedlings.
Genetika, v.43, p.667‑674, 2011. DOI: 10.2298/GENSR1103667F.
GORINSTEIN, S.; ARANCIBIA‑AVILA, P.; TOLEDO, F.; NAMIESNIK, J.; LEONTOWICZ, H.; LEONTOWICZ, M.; HAM, K.S.; KANG, S.G., VEARASIL, K.; SUHAJ, M. Application of
analytical methods for the determination of bioactive compounds in some berries. Food Analytical Methods, v.6, p.432‑444, 2013.
DOI: 10.1007/s12161‑012‑9453‑z.
KAFKAS, E.; KOSAR, M.; TÜREMIS, N.; BASER, K.H.C.
Analysis of sugars, organic acids and vitamin C contents of blackberry genotypes from Turkey. Food Chemistry, v.97, p.732‑736, 2006. DOI: 10.1016/j.foodchem.2005.09.023.
KALT, W.; JOSEPH, J.A.; SHUKITT‑HALE, B. Blueberries
and human health: a review of current research. Journal of the
American Pomological Society, v.61, p.151‑160, 2007.
KIM, S.W.; MIN, S.R.; KIM, J.; PARK, S.K.; KIM, T.I.; LIU,
J.R. Rapid discrimination of commercial strawberry cultivars using Fourier transform infrared spectroscopy data combined by multivariate analysis. Plant Biotechnology Report, v.3, p.87‑93,
2009. DOI: 10.1007/s11816‑008‑0078‑z.
KOPONEN, J.M.; HAPPONEN, A.M.; MATTILA, P.H.; TÖRRÖNEN, A.R. Contents of anthocyanins and ellagitannins
in selected foods consumed in Finland. Journal of Agricultural
and Food Chemistry, v.55, p.1612‑1619, 2007. DOI: 10.1021/
jf062897a.
LUXIMON‑RAMMA, A.; BAHORUN, T.; CROZIER, A.
Antioxidant actions and phenolic and vitamin C contents of
common Mauritian exotic fruits. Journal of the Science of Food and Agriculture, v.83, p.496‑502, 2003. DOI: 10.1002/jsfa.1365.
MÄÄTTÄ‑RIIHINEN, K.R.; KAMAL‑ELDIN, A.; TÖRRÖNEN, A.R. Identification and quantification of phenolic compounds in
berries of Fragaria and Rubus species (family Rosaceae). Journal
of Agricultural and Food Chemistry, v.52, p.6178‑6187, 2004.
DOI: 10.1021/jf049450r.
MIKULIČ‑PETKOVŠEK, M.; SCHMITZER, V.; SLATNAR, A.; ŠTAMPAR, F.; VEBERIČ, R. Composition of sugars, organic acids,
and total phenolics in 25 wild or cultivated berry species. Journal
of Food Science, v.77, p.1064‑1070, 2012. DOI: 10.1111/j.1750‑3
841.2012.02896.x.
MILIVOJEVIĆ, J.; SLATNAR, A.; MIKULIČ‑PETKOVŠEK, M.; ŠTAMPAR, F.; NIKOLIĆ, M.; VEBERIČ, R. The influence
of early yield on the accumulation of major taste and health related compounds in black and red currant cultivars (Ribes spp.). Journal
of Agricultural and Food Chemistry, v.60, p.2682‑2691, 2012.
DOI: 10.1021/jf204627m.
PANTELIDIS, G.E.; VASILAKAKIS, M.; MANGANARIS, G.A.; DIAMANTIDIS, G. Antioxidant capacity, phenol, anthocyanin and
ascorbic acid contents in raspberries, blackberries, red currants, gooseberries and Cornelian cherries. Food Chemistry, v.102, p.777‑783, 2007. DOI: 10.1016/j.foodchem.2006.06.021.
PIRIE, A.; MULLINS, M.G. Interrelationships of sugars,
anthocyanins, total phenols and dry weight in the skin of grape berries during ripening. American Journal of Enology and
Viticulture, v.28, p.204‑209, 1977.
RAMAIYA, S.D.; BUJANG, J.S.; ZAKARIA, M.H.; KINGA, W.S.; SAHRIRA, M.A.S. Sugars, ascorbic acid, total phenolic
content and total antioxidant activity in passion fruit (Passiflora) cultivars. Journal of the Science of Food and Agriculture, v.93, p.1198‑205, 2013. DOI: 10.1002/jsfa.5876.
REMBERG, S.F.; MÅGE, F.; HAFFNER, K.; BLOMHOFF, R.
Highbush blueberries Vaccinium corymbosum L., raspberries
Rubus idaeus L. and black currants Ribes nigrum L. – influence of
cultivar on antioxidant activity and other quality parameters. Acta
Horticulturae, v.744, p.259‑266, 2007.
SARBU, C.; NASCU‑BRICIU, R.D.; KOT‑WASIK, A.; GORINSTEIN, S.; WASIK, A.; NAMIESNIK, J. Classification and fingerprinting of kiwi and pomelo fruits by multivariate analysis of
chromatographic and spectroscopic data. Food Chemistry, v.130, p.994‑1002, 2012. DOI: 10.1016/j.foodchem.2011.07.120.
ŠAVIKIN, K.; ZDUMIĆ, G.; JANKOVIĆ, T.; TASIĆ, S.; MENKOVIĆ, N.; STEVIĆ, T.; DJORDJEVIĆ, B. Phenolic content
and radical scavenging capacity of berries and related jams from
certificated area in Serbia. Plant Foods for Human Nutrition, v.64, p.212‑217, 2009. DOI: 10.1007/s11130‑009‑0123‑2.
SCALZO, J.; POLITI, A.; PELLEGRINI, N.; MEZZETI, B.;
BATTINO, M. Plant genotype affects total antioxidant capacity and phenolic contents in fruit. Nutrition, v.2, p.207‑213, 2005. DOI: 10.1016/j.nut.2004.03.025.
SELLAPPAN, S.; AKOH, C.C.; KREWER, G. Phenolic compounds and antioxidant capacity of Georgia‑grown blueberries
and blackberries. Journal of Agricultural and Food Chemistry, v.50, p.2432‑2438, 2002. DOI: 10.1021/jf011097r.
SINGLETON, V.L.; ROSSI JUNIOR, J.A. Colorimetry of total
American Journal of Enology and Viticulture, v.16, p.144‑158, 1965.
SIRIWOHARN, T.; WROLSTAD, R.E.; FINN, C.E; PEREIRA, C.B. Influence of cultivar, maturity, and sampling on blackberry
(Rubus L. hybrids) anthocyanins, polyphenolics, and antioxidant properties. Journal of Agricultural and Food Chemistry, v.52, p.8021‑8030, 2004. DOI: 10.1021/jf048619y.
TERRY, L.A.; WHITE, S.F.; TIGWELL, L.J. The application of
biosensors to fresh produce and the wider food industry. Journal
of Agricultural and Food Chemistry, v.53, p.1309‑1316, 2005.
DOI: 10.1021/jf040319t.
TOSUN, M.; ERCISLI, S.; KARLIDAG, H.; SENGUL, M. Characterization of red raspberry (Rubus idaeus L.) genotypes for their physicochemical properties. Journal of Food Science, v.74, p.575‑579, 2009. DOI: 10.1111/j.1750‑3841.2009.01297.x.
TULIPANI, S.; MEZZETTI, B.; CAPOCASA, F.; BOMPADRE, S.; BEEKWILDER, J.; RIC DEVOS, H.C.; CAPANOGLU, E.;
BOVY, A.; BATTINO, M. Antioxidants, phenolic compounds, and nutritional quality of different strawberry genotypes. Journal of
Agricultural and Food Chemistry, v.56, p.696‑704, 2008. DOI:
10.1021/jf0719959.
WANG, S.Y.; CHEN, C.‑T.; SCIARAPPA, W.; WANG, C.Y.; CAMP, M.J. Fruit quality, antioxidant capacity, and flavonoid
content of organically and conventionally grown blueberries.
Journal of Agricultural and Food Chemistry, v.56, p.5788‑5794,
2008. DOI: 10.1021/jf703775r.
ZHENG, J.; BAORU, Y.; TUOMASJUKKA, S.; SHIYI, O.;
KALLIO, H. Effects of latitude and weather conditions on contents of sugars, fruit acids, and ascorbic acid in black currant (Ribes nigrum L.) juice. Journal of Agricultural and Food Chemistry, v.57, p.2977‑2987, 2009. DOI: 10.1021/jf8034513.
ZHENG, W.; WANG, S.Y. Oxygen radical absorbing capacity
of phenolics in blueberries, cranberries, chokeberries, and lingonberries. Journal of Agricultural and Food Chemistry, v.51, p.502‑509, 2003. DOI: 10.1021/jf020728u.