www.impactjournals.com/oncotarget/ Oncotarget, Vol. 7, No. 29
Hypoxia-mediated upregulation of MCT1 expression supports
the glycolytic phenotype of glioblastomas
Vera Miranda-Gonçalves1,2, Sara Granja1,2, Olga Martinho1,2,3, Mrinalini Honavar4, Marta Pojo1,2, Bruno M. Costa1,2, Manuel M. Pires5, Célia Pinheiro6, Michelle Cordeiro7, Gil Bebiano7, Paulo Costa8, Rui M. Reis1,2,3, Fátima Baltazar1,2
1Life and Health Sciences Research Institute (ICVS), School of Health Sciences, University of Minho, Braga, Portugal 2ICVS/3B’s-PT Government Associate Laboratory, Braga/Guimarães, Portugal
3Molecular Oncology Research Center, Barretos Cancer Hospital, Barretos, São Paulo, Brazil 4Department of Pathology, Hospital Pedro Hispano, Matosinhos, Portugal
5Unit of Neuropathology, Centro Hospitalar do Porto, Porto, Portugal 6Department of Neurosurgery, Centro Hospitalar do Porto, Porto, Portugal 7Hospital Dr. Nélio Mendonça, Funchal, Madeira, Portugal
8Radiotherapy Service, Centro Hospitalar do Montijo, Setúbal, Portugal
Correspondence to: Fátima Baltazar, email: fbaltazar@ecsaude.uminho.pt
Rui M. Reis, email: ruireis.hcb@gmail.com
Keywords: monocarboxylate transporters (MCTs), tumor hypoxia, lactate, glioblastomas, Warburg effect Received: February 04, 2016 Accepted: June 02, 2016 Published: June 16, 2016
ABSTRACT
Background: Glioblastomas (GBM) present a high cellular heterogeneity with conspicuous necrotic regions associated with hypoxia, which is related to tumor aggressiveness. GBM tumors exhibit high glycolytic metabolism with increased lactate production that is extruded to the tumor microenvironment through monocarboxylate transporters (MCTs). While hypoxia-mediated regulation of MCT4 has been characterized, the role of MCT1 is still controversial. Thus, we aimed to understand the role of hypoxia in the regulation of MCT expression and function in GBM, MCT1 in particular.
Methods: Expression of hypoxia- and glycolytic-related markers, as well as MCT1 and MCT4 isoforms was assessed in in vitro and in vivo orthotopic glioma models, and also in human GBM tissues by immunofluorescence/immunohistochemistry and Western blot. Following MCT1 inhibition, either pharmacologically with CHC (α-cyano-4-hydroxynnamic acid) or genetically with siRNAs, we assessed GBM cell viability, proliferation, metabolism, migration and invasion, under normoxia and hypoxia conditions.
Results: Hypoxia induced an increase in MCT1 plasma membrane expression in glioma cells, both in in vitro and in vivo models. Additionally, treatment with CHC and downregulation of MCT1 in glioma cells decreased lactate production, cell proliferation and invasion under hypoxia. Moreover, in the in vivo orthotopic model and in human GBM tissues, there was extensive co-expression of MCT1, but not MCT4, with the GBM hypoxia marker CAIX.
Conclusion: Hypoxia-induced MCT1 supports GBM glycolytic phenotype, being responsible for lactate efflux and an important mediator of cell survival and aggressiveness. Therefore, MCT1 constitutes a promising therapeutic target in GBM.
BACKGROUND
Tumor cells present several biological alterations known as cancer hallmarks [1]. Recently, metabolic reprogramming, namely “Warburg effect”, was considered
a major cancer feature [2-4], in which glycolytic phenotype is favored. The glycolytic phenotype observed in tumor cells is also an adaptive consequence of tumor hypoxic microenvironment [4]. The presence of tumor hypoxia induces stabilization of hypoxia-inducible factor
1 alpha (HIF-1α) [5], which leads not only to induction of angiogenesis, but also upregulation of glycolytic metabolism, to maintain the ATP production necessary for cell survival and proliferation [6]. The increased lactate production together with diminished vascular dispersion of CO2 contributes to tumor hypoxic acidosis [6], which is associated with increased aggressiveness, poor prognosis and acquired resistance [7].
Glioblastoma (GBM) is the most common and lethal primary brain tumor [8]. Despite the observed progress in therapy, prognosis of GBM patients is still dismal, presenting an overall survival of approximately 15 months [9]. Thus, novel and more effective therapeutic approaches are needed to overcome this scenario. GBMs are known to exhibit metabolic remodeling [10], with an increase in glycolysis of about 3-fold, compared to normal brain tissue [11]. Additionally, GBM cells have increased lactate production [12], which is further transported to the tumor microenvironment through monocarboxylate transporters (MCTs) [13].
MCTs belong to the solute carrier family 16 (SLC16), which is composed by 14 members, being MCT1-MCT4 responsible by the proton-coupled transport of monocarboxylates [14]. The activity of these transporters is critical for metabolic communication between cells and they have different properties and tissue distributions, according to their kinetics characteristics [15]. According to the distinct affinities of MCT isoforms for lactate, MCT1 and MCT4 are described to mediate lactate efflux, contributing to tumor pH regulation [15]. Several studies from our group and others reported up-regulation of MCTs in different solid tumors [16]. Recently, we demonstrated that MCT1/4 and their chaperone CD147 are up-regulated on GBMs and presented evidence for the role of MCT1 in the hyper-glycolytic and acid-resistant phenotype of these tumors [17].
There is increasing evidence that MCT expression is altered (at transcriptional and post-transcriptional levels) in response to metabolic demands [18]. Hypoxia is a common feature of solid tumors, including GBMs, and it promotes tumor aggressiveness, leading to poor patient outcome [19]. MCT4 expression was described to be regulated by hypoxia in several cancer types, including bladder [20], cervix [21] and breast [22, 23]. Also, in normal tissues, MCT4 was described to be upregulated after chronic hypoxia, being increased in heart muscle [24], trophoblast [25] and adipocyte [26] cells in a HIF-1α dependent mechanism. In fact, following elegant functional studies, Ullah and collaborators, showed that MCT4, but not MCT1 promoter was activated by hypoxia and that this response was mediated by HIF-1α [27]. Nevertheless, it was observed that MCT1 increased in neuronal, astrocytes and endothelial cells upon left middle cerebral artery occlusion [28], as well as in adipocytes
exposed to hypoxia [26]. Thus, the regulation of MCT1 under hypoxia conditions appears to be not well understood and even controversial. Therefore, in the present study we aim to understand how hypoxia regulates MCT1 activity and expression and how this associates with aggressiveness and survival of GBM cells.
RESULTS
Hypoxia increases MCT1 plasma membrane expression in glioma cells in vitro
In the present study, we used two known glioma cell lines with distinct metabolic behavior [17]. U251 cells exhibit a more glycolytic phenotype and present high plasma membrane expression of MCT1, CD147 and GLUT-1, as well as cytoplasmic HKII expression compared to SW1088 cells, under normoxia conditions (Figure 1A and 1B). In U251 cells, expression of GLUT-1, HKII and CD147 was similar in both normoxia and induced hypoxia conditions, while there was a clear increase of MCT4 and CAIX in hypoxia (Figure 1A and 1B, Table 1), and a slight increase in MCT1 expression (Figure 1B, Table 1). Regarding SW1088 cells, we observed an increased expression of the metabolic markers, with exception of MCT4 that decreased in hypoxia (Figure 1A and 1B, Table 1). We also observed MCT1, CD147 and GLUT1 increase staining in plasma membrane expression under hypoxia, compared to normoxia (Figure 1A and 1B, Table 1). Hypoxia induced conditions were supported by nuclear expression of the hypoxia marker HIF-1α (Figure 1A and 1B). To confirm the increase in plasma membrane expression of MCT1, MCT4 and their chaperone CD147, cell fractionation with plasma membrane isolation was performed. As observed in Figure 1C, there is an increase in MCT1 and CD147 plasma membrane expression in SW1088 cells, with no MCT4 plasma membrane expression.
In U251 cells, the increase in MCT4 plasma membrane expression was evident in hypoxia, whereas there was only a slight increase to MCT1 and no changes in CD147 (Figure 1C). Hypoxia conditions induced up-regulation of glycolytic proteins and MCTs in glioma cells, with higher intensity for the most oxidative cell line SW1088. Subsequently, the extracellular glucose and lactate levels were analyzed to confirm the induction of the glycolytic phenotype. As expected, an increase in glucose consumption and lactate extrusion was observed in both cell lines (Figure 1D). In SW1088 cells, a metabolic switch towards a more glycolytic metabolism was confirmed by the shift ratio extruded lactate/consumed glucose from 0.5 under normoxia to 0.8 under hypoxia. At variance, in the more glycolytic U251 cells the ratio remains close to 1 in both conditions (Figure 1D), despite the hypoxia related increase in glucose consumption and lactate secretion.
Figure 1: Protein levels, cellular localization and glycolytic metabolism of glioma cells under hypoxia. A. Cellular localization of the different metabolic markers and monocarboxylate transporters in normoxic and hypoxic regions, by immunofluorescence; pictures were taken using the microscope Olympus BX16 at 400x. B. Protein levels under normoxia and hypoxia in glioma cells by Western blot analysis; MCT1 50kDa, MCT4 44kDa, CD147, high glycosylated (HG) 52-42kDa and low glycosylated (LG) 34kDa; GLUT1 52kDa, HKII 95kDa, CAIX 52kDa, HIF-1α 110kDa and β-Actin 42kDa. C. Protein levels of cytoplasm and plasma membrane fractions for MCT1, MCT4 and CD147; β-actin and ATPase (90kDa) were used as loading controls for cytoplasm and plasma membrane fractions, respectively. D. Glucose consumption and lactate secretion in glioma cells under normoxia and hypoxia conditions; results are the mean±SEM of at least three independent experiments, each one in triplicate; *** p≤0.001 normoxia vs hypoxia.
MCT1 mediates lactate efflux in glioma cells
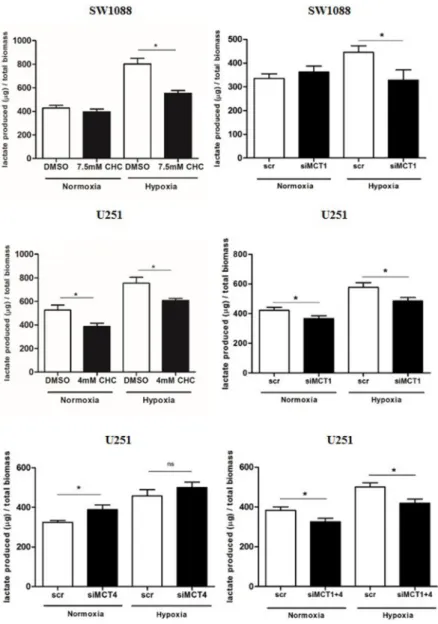
In order to evaluate the role of MCT1 and 4 as contributors to the glycolytic phenotype in hypoxia, MCT pharmacological inhibition was performed with
CHC (IC50/2 value) and downregulation of MCT1
and MCT4 isoforms by siRNA. Treatment with either CHC or siMCT1in SW1088 cells led to a decrease in extracellular lactate only in hypoxia (Figure 2). In U251 cells, treatment with CHC decreased extracellular lactate in both normoxia and hypoxia (Figure 2). Similar findings were found for MCT1 downregulation in both conditions, however inhibition of MCT4 alone led to a slight increase in extracellular lactate (Figure 2). Combined downregulation of both MCT isoforms (MCT1 and MCT4) decreased extracellular lactate with a profile similar to MCT1 silencing (Figure 2A). Importantly, specific downregulation of MCT1 had the same effect of CHC on lactate secretion, indicating that MCT1 has an important role in the maintenance of the glycolytic phenotype in hypoxic conditions. Downregulation of MCTs was confirmed by Western blot (Supplementary Figure S1A) and immunofluorescence (Supplementary Figure S1B and S1C). We observed an interdependence of MCT1/CD147, since downregulation of MCT1 led to a decrease in CD147 plasma membrane expression in both cell lines, whereas downregulation of MCT4 in U251 cells did not change the expression and cellular localization of CD147 (Supplementary Figure S1B and S1C).
MCT1 inhibition decreases glioma cell viability and proliferation under hypoxia
The role of MCT1 on glioma viability and proliferation was also evaluated upon metabolic remodeling induced by hypoxia. Treatment with CHC decreased significantly cell growth in both cell lines under hypoxia (Figure 3A), while only a slight decrease was observed for U251 cells under normoxia. Additionally, downregulation of MCT1 in SW1088 cells, only decreased cell growth
under hypoxia (Figure 3A), while in U251 cells, MCT1 silencing led to a significant decrease in cell growth in both normoxia and hypoxia (Figure 3A).
Treatment with CHC only decreased cell proliferation under hypoxia (Figure 3B) and MCT1 downregulation decreased cell proliferation in both cell lines in both normoxia and hypoxic conditions (Figure 3B). Furthermore, it was observed that cell death did not increase in hypoxia either with CHC treatment or MCT1 downregulation, with only a tendency for CHC treatment in U251 cells, but without statistical significance (Figure 3C).
MCT1 contributes to glioma migration and invasion under hypoxia
The role of MCT1 on cell aggressiveness was evaluated by assessing cell migration and cell invasion upon inhibition of MCT1 activity and expression.
In SW1088 cells, treatment with CHC decreased cell migration in both conditions (Figure 4A), with a significant decrease from normoxia to hypoxia. Only treatment with CHC under hypoxia promoted a significant decrease in cell invasion (Figure 4B). Additionally, MCT1 silencing decreased significantly cell migration (Figure 4A) and invasion (Figure 4B) in hypoxia but not under normoxia.
For U251 cells, treatment with CHC decreased significantly cell migration (Figure 4A) but not invasion (Figure 4B) in both normoxia and hypoxia. Downregulation of MCT1 led to a significant decrease in cell migration (Figure 4A) and cell invasion (Figure 4B) under normoxia, however under hypoxia conditions, only a decrease in cell invasion was verified (Figure 4B).
MCT1 expression increases in hypoxic regions in 3D cultures and in orthotopic glioma models
To further support the previous results, we performed SW1088 3D cultures (spheroids), and observed an increase in MCT1 plasma membrane expression in
Table 1: Summary of the results of expression of MCTs and other metabolic markers in hypoxia vs normoxia conditions in glioma cell lines
Hypoxia vs Normoxia
U251 SW1088
MCT1 increased (PM) increased (PM)
MCT4 increased (PM) decreased (cytoplasm)
CD147 similar (PM) increased (PM)
GLUT1 similar (PM) increased (PM)
HKII similar increased
CAIX increased increased
the spheroid core (less oxygenated region), whereas MCT4 expression remained at the periphery and was cytoplasmic (Figure 5A). Additionally, using the CAM assay, we observed in U251 ex ovo microtumors that MCT1 plasma membrane expression was higher in the region that was positive for CAIX, while MCT4 presented a weak cytoplasmic expression (Figure 5B). The U87-MG cell line was used in the intracranial model, since is the well described to form in vivo tumors that better mimic the human GBM behavior with heterogeneous regions, exhibiting necrotic regions and angiogenic features [29]. Characterization of MCT1 and MCT4 distribution in U87-MG brain tumors showed a weak expression in both isoforms, and a negative CAIX expression, in regions close to blood vessels (normoxic regions) (Figure 5C). Particularly, in the regions positive to CAIX expression
(hypoxic regions), we observed a strong co-localization of MCT1 with CAIX (Figure 5C). In contrast, most CAIX positive cells did not co-localize with MCT4 in these intracranial tumors (Figure 5C).
MCT1 plasma membrane expression is
associated with hypoxic regions of GBM tissues
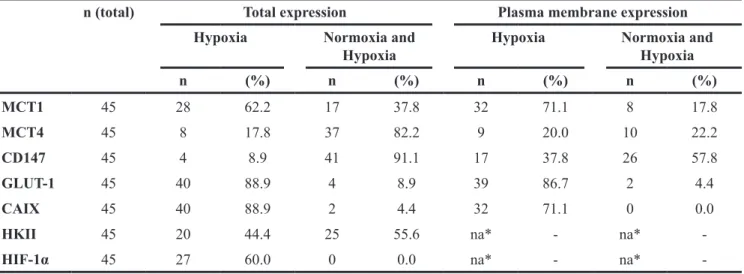
To support the above finding, a total of 45 GBM cases were assessed for MCT1, MCT4 and chaperone CD147 expressions, as well as for different glycolytic metabolism-related proteins, GLUT-1, HKII, CAIX and HIF-1α in normoxic regions (vascularized regions, distant from necrotic areas) and hypoxic regions (peri-necrotic areas). The expression of these markers was also evaluated in 17 tumoral adjacent tissues. In the
non-Figure 2: Lactate secretion upon MCT inhibition. Extracellular lactate levels upon MCT pharmacological (CHC) and genetic inhibition (siRNA) in SW1088 and U251 cells under hypoxia conditions; results are the mean±SEM of at least three independent experiments, each one in triplicate; *p<0.05 compared CHC or downregulation vs control condition.
tumoral regions, astrocytes and neurons were negative for all markers (Figure 6), and expression of MCT1, CD147 and GLUT-1 was present in capillaries and small vessels (Figure 6). In GBM tissues, CAIX, GLUT-1 and HIF-1α presented a focal expression in hypoxic regions, with 88.9%, 88.9% and 60% positivity, respectively (Table 2; Figure 6). MCT1 total (cytoplasm/membrane) expression increased in hypoxic regions of GBMs (62.2%)
(Table 2; Figure 6), with 71.1% of cases presenting plasma membrane expression (Table 2; Figure 6). MCT4 and CD147 were expressed in both normoxic and hypoxic regions (82.2% and 91.1%, respectively; Table 2, Figure 5), however only 20% of the cases presented MCT4 plasma membrane expression in hypoxic regions (Table 2). The MCT chaperone CD147 exhibited a higher expression at the plasma membrane, with 37.8% of cases
Figure 3: Effect of MCT1 inhibition on cell proliferation and cell death of glioma cells under hypoxia. Cell proliferation in SW1088 and U251 cells under hypoxia by A. trypan blue and B. BrdU assay, respectively. C. Cell death in SW1088 and U251 cells under hypoxia by AnnexinV/PI flow cytometry analysis; results are the mean±SEM of at least three independent experiments, each one in triplicate; To MCT downregulation graphs the results were compared to scramble condition which was normalized to 100% represented as grey line; *p<0.05, **p≤0.01 *** p≤0.001; # p<0.05 compared normoxia vs hypoxia at respective conditions.
Figure 4: Cell migration and invasion behavior upon MCT1 under hypoxia. Cell migration A. and cell invasion B. of glioma cells under normoxia and hypoxia after MCT1 downregulation and MCT activity inhibition with CHC. Pictures were taken at 40x magnification (migration) and 200x magnification (invasion) in an Olympus BX16 microscope. Results represent the mean±SEM of three independent experiments. The different conditions of silencing were compared to scramble conditions that was normalized to 100% (represented as grey line); *p<0.05, **p≤0.01 *** p≤0.001; # p<0.05 compares normoxia vs hypoxia at respective conditions.
Figure 5: MCT1 and MCT4 expression distribution in 3D culture and in in vivo glioma models. A. Immunohistochemical expression of MCT1, MCT4 and GLUT1 in SW1088 spheroids. Pictures are representative of n=10 spheroids and taken using the Olympus BX16 microscope at 40x, 100x and 400x magnification; B. MCT1, MCT4 and CAIX expression in U251 microtumors by immunohistochemistry. Pictures are representative of n=8 eggs and taken using the Olympus BX16 microscope, at 40x, 200x and 400x magnification; C. MCT1 and MCT4 expression in in vivo U87-MG intracranial tumors by immunofluorescence. Pictures are taken at 100x and highlighted at 400x for MCT1, MCT4 and CAIX in normoxic (close to blood vessels) and hypoxic regions (distant from blood vessels, positive for the hypoxia marker CAIX).
Figure 6: Immunohistochemical expression of monocarboxylate transporters, CD147, GLUT1, HKII, CAIX and HIF-1α in GBM and normal adjacent tissues. Expression of MCT1, MCT4, CD147 (MCT1/4 chaperone), glycolytic markers (HKII, GLUT1) and hypoxia markers (CAIX, HIF-1α) in neoplastic and non-neoplastic of GBM patient tissues, by immunohistochemistry. Pictures were obtained using the Olympus BX61 microscope, at 100x and the inserts at 400x magnification.
positive only in hypoxic regions (Figure 6; Table 2). The glycolytic marker HKII presented a ubiquitous expression with 44.4% of total cases positive only in hypoxia (Table 2; Figure 6).
In the immunostaining heat map (Figure 7A), we observed that MCT1 expression increases from normoxic to hypoxic regions, showing higher plasma membrane expression in hypoxic regions together with the hypoxic (CAIX) and glycolytic (GLUT-1) markers. We verified that the cases with positivity in normoxic regions maintain the expression in hypoxic regions. Additionally, we found an association of MCT1 plasma membrane expression in hypoxic regions of GBM with co-expression of HIF-1α and CAIX, and also a tendency to associate with GLUT-1 (Table 3). Moreover, co-localization of MCT1 with CAIX at the plasma membrane in hypoxic regions of the GBM tissues was confirmed by immunofluorescence (Figure 7B). Importantly, clinical specimens of GBMs validated the previous findings using in vitro and in vivo GBM models, in which MCT1 is enriched in hypoxic regions, and co-localize with surrogate markers of hypoxia.
DISCUSSION
Glycolytic metabolism of tumor cells has been described as an adaptive mechanism to intermittent hypoxia present in pre-malignant lesions [4, 6]. Yet, regulation of MCTs in hypoxia is not well understood, with controversial results, namely for MCT1 [20-22, 26, 27]. GBM are characterized by the presence of necrosis that seems to be associated with hypoxia regions [30], and these high levels of hypoxia have been implicated in resistance to chemo- and radiotherapy [31]. In a previous study, we reported up-regulation of MCT1, MCT4 and CD147 in a series of GBM compared to normal tissues [17]. Herein, we intended to understand the role of
hypoxia in the regulation of MCT expression and activity in GBM.
Analyzing two cell lines with different metabolic phenotypes, namely a less glycolytic SW1088 cell line (lower MCT1 plasma membrane expression) and a more glycolytic U251 cell line (higher MCT1 plasma membrane expression), we observed distinct sensitivities to the classical pharmacological MCT inhibitor CHC [17]. In the present study, we showed that hypoxia led to MCT1 and CD147 up-regulation, but not MCT4, at the cell plasma membrane of SW1088 cells. However, there is compelling evidence in the literature demonstrating that MCT4 is the isoform which is upregulated in the hypoxic regions of the tumors, being responsible for lactate efflux to the tumor microenvironment, being associated with several malignant features [20-23, 27]. Upregulation of MCT4 levels in hypoxia was observed in bladder cancer [20] and an increase in MCT4 plasma membrane expression was also observed in breast cancer cells [22]. Importantly, Ullah et al. reported that only MCT4 is induced by hypoxia, since only this MCT isoform contains hypoxia response elements (HRE) for HIF-1α [27]. At variance with these authors, we showed that MCT4 expression decreased with hypoxia in SW1088 cells. Accordingly, it was described that MCT4 expression decreased after chronic hypoxia in the plantaris muscle [24]. Moreover, a recent study in adipocytes demonstrated that MCT1, but not MCT4 protein expression increased in hypoxia [26]. Here, a slight increase in MCT1 was observed in hypoxia in the highly glycolytic cell line (U251), however an increase in MCT4 plasma membrane expression was also verified, supporting the study of Ullah
et al., [27]. Additionally, an increased MCT1 and MCT4
plasma membrane density was reported in brain cells under hypoxia [22], which also corroborates our results (Figure 8).
Table 2: Distribution of metabolic markers and MCT/CD147 expression in normoxic and hypoxic regions of glioblastoma tissues
n (total) Total expression Plasma membrane expression Hypoxia Normoxia and
Hypoxia Hypoxia Normoxia and Hypoxia
n (%) n (%) n (%) n (%) MCT1 45 28 62.2 17 37.8 32 71.1 8 17.8 MCT4 45 8 17.8 37 82.2 9 20.0 10 22.2 CD147 45 4 8.9 41 91.1 17 37.8 26 57.8 GLUT-1 45 40 88.9 4 8.9 39 86.7 2 4.4 CAIX 45 40 88.9 2 4.4 32 71.1 0 0.0
HKII 45 20 44.4 25 55.6 na* - na*
-HIF-1α 45 27 60.0 0 0.0 na* - na*
Figure 7: Association of MCTs and CD147 expression with hypoxia markers (GLUT-1 and CAIX) in GBMs. A. Heat map representation of the monocarboxylate transporter and chaperone expression, and hypoxic markers for the 45 GBM tissues evaluated under normoxia and hypoxia regions. Blue color corresponds to negative or cytoplasm expression and red corresponds to plasma membrane expression; B. Plasma membrane expression of the hypoxia marker CAIX (in green) and MCT1 (in red) in GBM tissue. Co-localization of MCT1 and CAIX at the plasma membrane (orange). Pictures were taken using the microscope Olympus BX16 at 100x (I), 200x (II) and 400x (III).
Up-regulation of MCT1 contributes to the glycolytic phenotype of brain cancer cells, which was supported by the observed increase in glucose consumption and lactate production, as well as overexpression of GLUT1 and HKII in SW1088 cells in hypoxia. In the present work, we also investigated the effect of MCT activity inhibition in human glioma cell lines in hypoxia, using the lactate transport inhibitor CHC and also through MCT1 and MCT4 mRNA downregulation (siRNA). MCT1 inhibition induced a decrease in lactate production in SW1088 cells in hypoxia compared to normoxia conditions. This was anticipated, since hypoxia induces the glycolytic phenotype in SW1088 cells, leading to increased MCT1 plasma membrane expression. Additionally, MCT1 silencing in U251, but not MCT4, decreased lactate production in both normoxia and hypoxic conditions. Although previous reports suggested that MCT4 is the major lactate transporter in hypoxic cells [21, 27], in our cell models we demonstrate that MCT1 mediates the lactate efflux in hypoxic conditions. In line with this, a recent study with colon adenocarcinoma cells showed that MCT1 silencing in hypoxia decreased lactate efflux [32]. Furthermore, our results show that CHC inhibited preferentially MCT1 rather than MCT4 isoform, which can be explained by the different Ki values for these two isoforms [33, 34].
It is known that hypoxia contributes to the glycolytic-acidic resistant phenotype of tumor cells [6], contributing to increased cell growth and survival, due to induction of several malignant features like migration
and invasion. Accordingly, we studied the contribution of MCTs, particularly MCT1, to cell growth, survival and invasiveness capacity under hypoxia (Figure 8). Inhibition of MCT1 activity and expression led to a decrease in viability and cell proliferation, however it did not promote cell death in hypoxia-induced SW1088 cells. In fact, some studies have been demonstrating the importance of lactate transport via MCT1 in the promotion of cell proliferation and tumor growth [35, 36].
GBM have an intrinsic high invasive capacity [37], producing high amounts of lactate [12] that contribute to the acidic microenvironment, and consequent promotion of cell migration and invasion. It is already described that inhibition of MCT activity decreases breast cancer cell migration [36] and the invasive capacity of GBM [38]. Additionally, it was described that MCT1 is the mediator of lactate efflux and consequently promotes the invasive phenotype of GBM [17]. However, the role of MCTs in the promotion of migration and invasion under hypoxia was not assessed. In the present study, MCT1 downregulation in hypoxia was associated with a decrease in cell invasion in both cell lines tested. However, a decrease in cell migration was only observed in SW1088 cells. Since MCT4 does not appear to participate in lactate efflux even at hypoxic conditions in our cell model, the increase in cell migration after MCT1 downregulation could be explained due to the strong association of MCT4 with β1-integrin on the cell movement capacity [39]. Additionally, the effect observed can be a mechanism mediated by hypoxia, since it is known that under these conditions
Table 3: Association of MCT1 plasma membrane expression in hypoxic regions with different hypoxia-inducible metabolic markers in glioblastomas
MCT1 n PM* (%) p MCT4 negative/cytoplasm 36 27 60.0 0.250 positive/PM 9 5 11.1 CD147 negative/cytoplasm 28 20 44.4 0.952 positive/PM 17 12 26.7 GLUT-1 negative/cytoplasm 6 4 8.9 0.067 positive/PM 39 28 62.2 CAIX negative/cytoplasm 13 9 20.0 0.031 positive/PM 32 23 51.5 HKII negative 20 20 44.4 0.141 positive 25 12 26.7 HIF-1α negative 18 16 35.6 0.032 positive 27 16 35.6
there is up-regulation of several proteins associated with cell migration and invasion [40]. Furthermore, lactate transport in cancer cells could be mediated by a different lactate transporter, namely the sodium monocarboxylate transporter 1 (SMCT1) [41]. Although its expression is not well described in tumors, we cannot exclude the possible up-regulation of SMCT1 in hypoxia as a compensatory mechanism for cell survival. Regardless, our study demonstrates that MCT1 is a mediator of the aggressiveness phenotype of GBM cells in hypoxia, since there was a decrease in cell invasion after MCT1 downregulation (Figure 8).
Based on our findings, we hypothesize that up-regulation of MCT1 in GBM cells can be an adaptation to changes in oxygen levels, helping cells to be prepared for episodes of net release of lactate, alternating with
episodes of net uptake. In fact, our results with 3D cultures (SW1088 spheroids), ex ovo U251 microtumors and U87-MG brain tumors support the role of MCT1 as mediator of lactate efflux under low oxygen level conditions. Although, our results showed ubiquitous expression of MCT1 in SW1088 spheroids and in vivo glioma models, MCT1 plasma membrane expression is stronger in hypoxic regions and co-localizes with CAIX expression
in vivo glioma models.
Furthermore, the importance of enhanced MCT1 expression in hypoxia as a gatekeeper of lactate efflux was confirmed in a series of 45 GBM patients. The present study demonstrates that there is a shift from cytoplasm to plasma membrane expression of MCT1 in GBM tissues, while MCT4 is present in higher amounts in the cytoplasm, despite the increase in both MCT1 and
Figure 8: MCT1 as a mediator of aggressiveness at hypoxic regions in glioblastomas. In normoxic tumor cells, MCT1 is expressed at the plasma membrane, whereas MCT4 remains at the cytoplasm. Hypoxia induces upregulation of MCT1 plasma membrane expression, which is responsible for lactate efflux. Inhibition of MCT1 expression or activity impairs lactate secretion, contributing to a decrease in cell proliferation, cell migration and invasion.
MCT4 expression in hypoxia (Figure 8). Additionally, MCT1 plasma membrane expression was associated with positivity for HIF-1α and CAIX in hypoxic regions. A previous report in rat brain tumors described that MCT4 expression was located in the center of the tumor (hypoxic area), while MCT1 was mainly at the periphery [42]. On the other hand, Kaanders et al., demonstrated that MCT1 was present in hypoxic regions in head and neck tumors and was associated with CAIX expression [43]. Although MCT4 is the isoform that is described to be induced by hypoxia [27], a recent study by Feron et al. indicates that hypoxia also induced an increase in MCT1 mRNA levels in breast cancer [32]. Additionally, hypoxia induced MCT1 protein expression, but not MCT4, in human adipocytes [26]. Altogether, these findings suggest that besides MCT4, MCT1 expression is also regulated by hypoxia, likely supporting the maintenance of the glycolytic phenotype of GBM by mediating lactate efflux (Figure 8).
To support our results, we studied in parallel the expression of glycolytic markers (GLUT-1 and HKII) and hypoxia markers (CAIX and HIF-1α), and observed that CAIX, HIF-1 and GLUT-1 expression was restricted to hypoxic regions. These results are supported by previous studies reporting that HIF-1α [44], GLUT-1 [45] and CAIX [46] expression was increased in GBM compared to low grade gliomas and that they are associated with necrotic regions (hypoxic regions). In the present study, MCT1 plasma membrane expression was associated with HIF-1α and CAIX in human GBM tissues and a similar pattern was observed in CAIX in the CAM U251 microtumors and U87-MG intracranial mice brain tumors, which supports the association of MCT1 expression with hypoxic tumors regions. In accordance to our model, a study by Pinheiro et al also showed that MCT1 was associated to CAIX expression in breast cancer tissues [47]. On the other hand, and as expected, several studies reported association of MCT4 with hypoxia markers in different solid tumors [20, 43, 48]. In head and neck [43], and lung cancer [48] higher MCT4 expression was observed in regions distant from blood vessels and was associated with the hypoxia markers pimonidazole and GLUT1, respectively. In the whole, our results support that MCT1 expression is regulated by hypoxia, not directly through HIF-1α but perhaps through a mechanism that could be dependent on HIF-1α activation.
CONCLUSIONS
MCT1 plasma membrane expression is upregulated in hypoxia in GBM models and human tissues, playing an important role in the maintenance of their glycolytic phenotype, which in turn is associated with higher aggressiveness. Thus, targeting MCT1, alone or in combination with conventional therapy, can constitute an attractive strategy for GBM therapy.
MATERIALS AND METHODS
Cell culture and cell linesU251, SW1088 and U87-MG cell lines used in this study were grown in standard conditions [17]. U251 cells were kindly provided by Professor Joseph Costello, California University, Neurosurgery Department, San Francisco, USA. SW1088 and U87-MG cells were obtained from ATCC (American Type Culture Collection). Cell line authentication was performed by IdentiCell Laboratories (Department of Molecular Medicine (MOMA) at Aarhus University Hospital Skejby in Åarhus, Denmark). Genotyping confirmed the complete identity of cell lines.
Hypoxia induction
Induction of hypoxia was performed using hypoxic chambers (Modular Incubator Chamber (MIC-101), billups-rothenberg.inc). Cells were placed in an airtight
chamber with hypoxic gas mixture 0% O2, 5% CO2 and
95% N2. The hypoxic chamber was then placed in an
incubator at 37ºC for a specific period time, according to the assay to be carried out. The O2 concentration during
assays was controlled by an O2 sensor, being below
1% throughout the experiments. The control normoxic conditions were performed in a humidified incubator at 21% O2, 5% CO2 and 74% N2 for the same period of time.
Antibodies
Antibody details and conditions for immunohistochemical, immunofluorescence and Western blot assays are summarized in Table 4.
Downregulation of MCTs
Downregulation of MCT1 or MCT4 was performed with siRNA (siRNA for MCT1, s580, Ambion; scramble siRNA, 4390843, Ambion, siRNA for MCT4, S17417) using lipofectamine as a transfection reagent, according to the manufacturer’s instructions [49].
Immunohistochemistry
Representative 4μm-thick tissue sections were used for immunohistochemical analysis. Immunohistochemistry (IHC) for MCT1, CD147 and HIF-1α was performed according with the avidin-biotin-peroxidase technique (R.T.U. Vectastain Elite ABC kit; Vector Laboratories), as previously described [17]. The Ultravision Detection System Anti-polyvalent, HRP (Lab Vision Corporation) was used for MCT4, GLUT-1, CAIX and HKII, IHC, as previously described [17].
Briefly, deparaffinised and rehydrated slides were submitted to adequate heat-induced antigen retrieval for
20min at 98ºC with 10mM citrate buffer (pH 6.0) for MCT1, MCT4, GLUT-1 and CAIX and 1mM EDTA buffer (pH 8.0) for CD147, HKII and HIF-1α. After endogenous peroxidase inactivation, incubation with the primary antibodies was performed overnight for MCT1, CD147 and HIF-1α and 2h for MCT4, GLUT-1, CAIX and HKII, at room temperature. The immune reactions were visualized with 3,3’-diaminobenzidine (DAB+ Substrate System; Dako) as a chromogen. Tissue immunostaining was evaluated by an experienced neuropathologist (MH). Analysis was performed semi-quantitatively considering the intensity of staining, according to the following score: score 0: negative or weak staining and score 1 for moderate and strong staining. Score 0 was defined as negative and score 1 as positive. The intensity of staining was evaluated in regions close to blood vessels, here defined as normoxic regions, and, in regions close to necrosis, defined as hypoxic regions. Cellular localization of staining (cytoplasm/membrane) was also evaluated.
Immunofluorescence
U251 and SW1088 cells were seeded on cover slips at a density of 30.000 cells/well, overnight. Briefly, after 24h in hypoxia, cells were fixed and permeabilized in methanol during 20min. After blocking with 5% bovine serum albumin (BSA) for 30min, cells were incubated overnight at room temperature with the primary polyclonal antibodies. Then, 1h of incubation with the secondary antibody anti-rabbit-Alexa Fluor 488 (1:500 dilution, A11008, Invitrogen) in 5% BSA was performed for MCT4, MCT1, GLUT-1 and CAIX and anti-mouse-Alexa Fluor 594 antibody (1:250 dilution, A11032, Invitrogen) for HKII, CD147 and HIF-1α. Finally, after washing in PBS, cells were mounted in Vectashield Mounting Media with 4’,6-diamidino-2-phenylindole (DAPI) (Vector Laboratories) and images were obtained with a fluorescence microscope (Olympus IX81), using the Cell P software. The procedure for GBM tissues was similar, performing the antigen retrieval before the blocking with 10% BSA for 45min.
Western blotting
Western blot was performed as described previously [17]. Incubation with primary antibodies (Table 4) was performed overnight at 4ºC. Bound antibodies were visualized by chemiluminescence (Supersignal West Femto kit; Pierce). β-Actin was used as loading control.
For subcellular fractionation, cells were washed with cold PBS and then incubated with 0.5mg/ml of Sulfo-NHS-LC- Biotin in PBS (3ml/ T75 flask) during 30min at 4ºC. Cells were then washed 3x with cold PBS 10mM Glycine, followed by cellular lysis. Then, 400μg of protein was incubated with 50μl of Streptavidin Agarose Resin beads in PBS, overnight with shaking at 4ºC. Proteins were centrifuged at 6000rpm for 1min and the supernatant (cytoplasm fraction) was collected and quantified. The bead pellet (membrane fraction) was washed 4x in 1ml lysis buffer, added to 60μl loading buffer and stored at -80ºC, until use. For Western blot analysis, cells were previously exposed to hypoxia for 24h.
Extracellular glucose and lactate measurements
Cells were plated in 48 well plates at a density of 3x10⁴ cells per well and allowed to adhere overnight.
Glucose and lactate content was analyzed in cell culture medium after 24h of hypoxia stimulation in treated
IC50/2 CHC value and MCT downregulated cells, using
commercial kits (Roche and Spinreact, respectively), as described [17]. For these time points, the total protein (expressed as total biomass) was assessed using the sulforhodamine B assay (SRB, TOX-6, Sigma-Aldrich) [17]. Results are expressed as total µg/ total biomass.
Cell viability and proliferation assays
U251 and SW1088 cells were plated in 24 well plates, at density of 3x10⁴ cells/well and allowed to adhere
overnight. After 24h of stimulation in hypoxia, cells were treated with the IC50/2 values of CHC (4mM in U251 and Table 4: Details about primary antibodies and conditions used in immunohistochemistry, immunofluorescence and western blot
Protein Company Dilution Clone
MCT1 Chemicon International (AB3538P) 1:200 2424624
MCT4 Santa Cruz Biotechnology (sc-50329) 1:500 C1915
CD147 Santa Cruz Biotechnology (sc-71038) 1:500 F1512
GLUT-1 AbCam (ab15309) 1:500 GR207686-2
CAIX AbCam (ab15086) 1:2000 GR154000-1
HKII AbCam (ab104836) 1:750 GR164816-6
HIF-1α BD Biosciences (610958) 1:100 4115908
7.5mM in SW1088 cells, respectively) (Alpha-cyano-4-hydroxycinnamate, Sigma-Aldrich) in DMEM without FBS, under normoxia and hypoxic conditions, during 48h. After treatment, cells were collected and the effect of CHC on cell viability was assessed through trypan blue counting. For cell proliferation analysis, cells were plated into 96-well plates, at a density of 3x10³ cells per
well and treated with CHC using the same conditions that described for trypan blue assay. After CHC treatment, cells were incubated with BrdU and incorporation was assessed at 450nm (λref=655nm), according to the manufacturer’s protocol (BrdU, Cell Proliferation ELISA; Roche Diagnostics). Cell viability (trypan blue assay) and cell proliferation for downregulated MCT1 glioma cells, were performed as described above.
Wound-healing assay
Cells were seeded in 6-well plates and cultured to at least 95% confluence and wound-healing assay was performed as described previously [17]. Treatment with
IC50/2 value of CHC and MCT1 downregulation were
performed during 24h in hypoxia. Wound areas were photographed at 0 and 24 hours.
Invasion assay
Cell invasion of U251 and SW1088 cells was assessed using 24 well BD Biocoat Matrigel Invasion Chambers (354480, BD Biosciences), as previously described [17, 50]. Before seeding on rehydratated Matrigel Matrix Chambers, cells were grown in 6-well plates in hypoxia and normoxia conditions during 24 hours. After that, U251 and SW1088 cells, at a density of 2.5x10⁴ cell per well in DMEM without
FBS plus CHC treatment (IC50/2 values) were added to
each insert. The same procedure was followed for MCT1 silenced cells. After 24hours, non-invading cells were removed and invading cells were fixed with methanol and stained with hematoxylin.
Spheroid formation
To form spheroids, 2×10³ SW1088 cells were
seeded in agarose-coated 48-well plates in 200µl of DMEM supplemented media. Spheroids were incubated, under shaking, at 37°C in a humidified atmosphere of 5% CO2 for 11 days. Fresh culture media was added every 48
hours. At day 15, intact spheroids were collected, fixed with 4% paraformaldehyde and embedded in paraffin for IHC analyses, as previously described.
Chicken chorioallantoic membrane (CAM) assay
CAM assay was performed as described previously [17, 51]. U251 cells (2x10⁶ cells) in Matrigel were
placed at 10 day of embryo development on the CAM and allowed to growth for 7 days. After that, CAMs with
tumors were dissected, fixed in 4% paraformaldehyde at room temperature and included in paraffin. Immunohistochemistry for MCT1, MCT4 and CAIX on paraffin sections of microtumors was performed as previously described for human samples.
Orthotopic GBM xenografts
All experiments with mice were approved by institutional and national ethical committees (Direção Geral de Alimentação e Veterinária, Portugal) and in accordance with European Union Directive 2010/63/ EU. For intracranial models, a total of 2x10⁵ U87-MG cells were stereotactically
injected in the brain striatum (1.8mm medial-lateral right, 0.4mm anterior-posterior, and 2.5mm dorsal-ventral from the bregma) of 8 weeks old athymic nude Foxn1nu male mice, as
previously described [52]. Animal body weight was evaluated 3 times per week, and general behavior and symptomatology daily. Brains were collected for immunofluorescence analyses, for which samples were fixed by immersion in formalin and subsequently embedded in paraffin.
Tissues samples
A total of 45 formalin-fixed paraffin embedded (FFPE) GBM (WHO grade IV) and 17 non-tumoral adjacent tissues were obtained from the Department of Pathology of Hospital Pedro Hispano, Matosinhos, Centro Hospitalar do Porto, Porto, and Hospital Dr. Nélio Mendonça, Madeira, Portugal. All procedures described in this study were in accordance with national and institutional ethical standards and previously approved by Local Ethical Review Committees.
Statistical analysis
Data from human tissues were analyzed using SPSS statistical software (version 22, SPSS Inc). Comparison of expression of the different markers was evaluated for statistical significance using Pearson’s chi square (χ2) test
with the threshold for significance being p≤0.05. For the
in vitro studies, the GraphPad prism 5 software was used,
with the Student’s t test, considering significant values
p≤0.05.
CONFLICTS OF INTEREST
The authors declare no conflicts of interest.
FUNDING
This study was supported by Projecto Estratégico- LA 26 – 2013-2014 (PEst-C/SAL/LA0026/2013) and ON.2 SR&TD Integrated Program (NORTE-07-0124-FEDER-000017)” co-funded by Programa Operacional Regional do Norte (ON.2- O Novo Norte), Quadro de Referência Estratégico Nacional (QREN), through Fundo
Europeu de Desenvolvimento Regional (FEDER), as well as MCTI/CNPq Nº 73/2013 (Brazil). VMG received a fellowship from Fundação para a Ciência e Tecnologia (FCT) ref. SFRH/BD/51997/2012.
Author contributions
VMG participated in the conception, design and writing of the manuscript, acquisition, analysis and interpretation of data, as well as development of methodology; SG, OM and MP performed some of the assays; MH contributed to data analysis of human samples; BMC contributed to data interpretation, manuscript revision and supply of the U87-MG orthotopic samples; MMP, CP, MC, GB and PC contributed to material supply particularly of human samples; RMR and FB participated in the conception of the study, data interpretation, revision of the manuscript and work supervision.
REFERENCES
1. Hanahan D and Weinberg RA. Hallmarks of cancer: the next generation. Cell. 2011; 144:646-674.
2. Cairns RA, Harris IS and Mak TW. Regulation of cancer cell metabolism. Nature reviews Cancer. 2011; 11:85-95. 3. Warburg O. On respiratory impairment in cancer cells.
Science. 1956; 124:269-270.
4. Gatenby RA and Gillies RJ. Why do cancers have high aerobic glycolysis? Nature reviews Cancer. 2004; 4:891-899. 5. Denko NC. Hypoxia, HIF1 and glucose metabolism in the
solid tumour. Nature reviews Cancer. 2008; 8:705-713. 6. Chiche J, Brahimi-Horn MC and Pouyssegur J. Tumour
hypoxia induces a metabolic shift causing acidosis: a common feature in cancer. Journal of cellular and molecular medicine. 2010; 14:771-794.
7. Hirschhaeuser F, Sattler UG and Mueller-Klieser W. Lactate: a metabolic key player in cancer. Cancer research. 2011; 71:6921-6925.
8. Riemenschneider MJ and Reifenberger G. Molecular neuropathology of gliomas. International journal of molecular sciences. 2009; 10:184-212.
9. Stupp R, Hegi ME, Mason WP, van den Bent MJ, Taphoorn MJ, Janzer RC, Ludwin SK, Allgeier A, Fisher B, Belanger K, Hau P, Brandes AA, Gijtenbeek J, Marosi C, Vecht CJ, Mokhtari K, et al. Effects of radiotherapy with concomitant and adjuvant temozolomide versus radiotherapy alone on survival in glioblastoma in a randomised phase III study: 5-year analysis of the EORTC-NCIC trial. The lancet oncology. 2009; 10:459-466.
10. Wolf A, Agnihotri S and Guha A. Targeting metabolic remodeling in glioblastoma multiforme. Oncotarget. 2010; 1:552-562. doi: 10.18632/oncotarget.190.
11. Oudard S, Arvelo F, Miccoli L, Apiou F, Dutrillaux AM, Poisson M, Dutrillaux B and Poupon MF. High glycolysis
in gliomas despite low hexokinase transcription and activity correlated to chromosome 10 loss. British journal of cancer. 1996; 74:839-845.
12. Tabatabaei P, Bergstrom P, Henriksson R and Bergenheim AT. Glucose metabolites, glutamate and glycerol in malignant glioma tumours during radiotherapy. Journal of neuro-oncology. 2008; 90:35-39.
13. Izumi H, Torigoe T, Ishiguchi H, Uramoto H, Yoshida Y, Tanabe M, Ise T, Murakami T, Yoshida T, Nomoto M and Kohno K. Cellular pH regulators: potentially promising molecular targets for cancer chemotherapy. Cancer treatment reviews. 2003; 29:541-549.
14. Halestrap AP. The monocarboxylate transporter family--Structure and functional characterization. IUBMB life. 2012; 64:1-9.
15. Halestrap AP and Wilson MC. The monocarboxylate transporter family--role and regulation. IUBMB life. 2012; 64:109-119.
16. Pinheiro C, Longatto-Filho A, Azevedo-Silva J, Casal M, Schmitt FC and Baltazar F. Role of monocarboxylate transporters in human cancers: state of the art. Journal of bioenergetics and biomembranes. 2012; 44:127-139. 17. Miranda-Goncalves V, Honavar M, Pinheiro C, Martinho
O, Pires MM, Pinheiro C, Cordeiro M, Bebiano G, Costa P, Palmeirim I, Reis RM and Baltazar F. Monocarboxylate transporters (MCTs) in gliomas: expression and exploitation as therapeutic targets. Neuro-oncology. 2013; 15:172-188. 18. Halestrap AP. Monocarboxylic acid transport.
Comprehensive Physiology. 2013; 3:1611-1643.
19. Kim JW, Gao P and Dang CV. Effects of hypoxia on tumor metabolism. Cancer metastasis reviews. 2007; 26:291-298. 20. Ord JJ, Streeter EH, Roberts IS, Cranston D and Harris AL.
Comparison of hypoxia transcriptome in vitro with in vivo gene expression in human bladder cancer. Br J Cancer. 2005; 93:346-354.
21. Sonveaux P, Vegran F, Schroeder T, Wergin MC, Verrax J, Rabbani ZN, De Saedeleer CJ, Kennedy KM, Diepart C, Jordan BF, Kelley MJ, Gallez B, Wahl ML, Feron O and Dewhirst MW. Targeting lactate-fueled respiration selectively kills hypoxic tumor cells in mice. J Clin Invest. 2008; 118:3930-3942.
22. Cheng C, Edin NF, Lauritzen KH, Aspmodal I, Christoffersen S, Jian L, Rasmussen LJ, Pettersen EO, Xiaoqun G and Bergersen LH. Alterations of monocarboxylate transporter densities during hypoxia in brain and breast tumour cells. Cell Oncol (Dordr). 2012; 35:217-227.
23. Doyen J, Trastour C, Ettore F, Peyrottes I, Toussant N, Gal J, Ilc K, Roux D, Parks SK, Ferrero JM and Pouyssegur J. Expression of the hypoxia-inducible monocarboxylate transporter MCT4 is increased in triple negative breast cancer and correlates independently with clinical outcome. Biochemical and biophysical research communications. 2014; 451:54-61.
24. McClelland GB and Brooks GA. Changes in MCT 1, MCT 4, and LDH expression are tissue specific in rats after long-term hypobaric hypoxia. Journal of applied physiology. 2002; 92:1573-1584.
25. Kay HH, Zhu S and Tsoi S. Hypoxia and lactate production in trophoblast cells. Placenta. 2007; 28:854-860.
26. Perez de Heredia F, Wood IS and Trayhurn P. Hypoxia stimulates lactate release and modulates monocarboxylate transporter (MCT1, MCT2, and MCT4) expression in human adipocytes. Pflugers Archiv : European journal of physiology. 2010; 459:509-518.
27. Ullah MS, Davies AJ and Halestrap AP. The plasma membrane lactate transporter MCT4, but not MCT1, is up-regulated by hypoxia through a HIF-1alpha-dependent mechanism. J Biol Chem. 2006; 281:9030-9037.
28. Zhang F, Vannucci SJ, Philp NJ and Simpson IA. Monocarboxylate transporter expression in the spontaneous hypertensive rat: effect of stroke. J Neurosci Res. 2005; 79:139-145.
29. Linnik IV, Scott ML, Holliday KF, Woodhouse N, Waterton JC, O’Connor JP, Barjat H, Liess C, Ulloa J, Young H, Dive C, Hodgkinson CL, Ward T, Roberts D, Mills SJ, Thompson G, et al. Noninvasive tumor hypoxia measurement using magnetic resonance imaging in murine U87 glioma xenografts and in patients with glioblastoma. Magnetic resonance in medicine. 2014; 71:1854-1862.
30. Jensen RL. Brain tumor hypoxia: tumorigenesis, angiogenesis, imaging, pseudoprogression, and as a therapeutic target. Journal of neuro-oncology. 2009; 92:317-335.
31. Yang L, Lin C, Wang L, Guo H and Wang X. Hypoxia and hypoxia-inducible factors in glioblastoma multiforme progression and therapeutic implications. Experimental cell research. 2012; 318:2417-2426.
32. Boidot R, Vegran F, Meulle A, Le Breton A, Dessy C, Sonveaux P, Lizard-Nacol S and Feron O. Regulation of monocarboxylate transporter MCT1 expression by p53 mediates inward and outward lactate fluxes in tumors. Cancer research. 2012; 72:939-948.
33. Halestrap AP and Meredith D. The SLC16 gene family-from monocarboxylate transporters (MCTs) to aromatic amino acid transporters and beyond. Pflugers Archiv : European journal of physiology. 2004; 447:619-628. 34. Halestrap AP. Transport of pyruvate nad lactate into human
erythrocytes. Evidence for the involvement of the chloride carrier and a chloride-independent carrier. The Biochemical journal. 1976; 156:193-207.
35. Marchiq I, Le Floch R, Roux D, Simon MP and Pouyssegur J. Genetic disruption of lactate/H+ symporters (MCTs) and their subunit CD147/BASIGIN sensitizes glycolytic tumor cells to phenformin. Cancer research. 2015; 75:171-180. 36. Morais-Santos F, Miranda-Goncalves V, Pinheiro S, Vieira
AF, Paredes J, Schmitt FC, Baltazar F and Pinheiro C. Differential sensitivities to lactate transport inhibitors of
breast cancer cell lines. Endocrine-related cancer. 2014; 21:27-38.
37. Brandsma D and van den Bent MJ. Molecular targeted therapies and chemotherapy in malignant gliomas. Current opinion in oncology. 2007; 19:598-605.
38. Colen CB, Shen Y, Ghoddoussi F, Yu P, Francis TB, Koch BJ, Monterey MD, Galloway MP, Sloan AE and Mathupala SP. Metabolic targeting of lactate efflux by malignant glioma inhibits invasiveness and induces necrosis: an in vivo study. Neoplasia. 2011; 13:620-632.
39. Gallagher SM, Castorino JJ and Philp NJ. Interaction of monocarboxylate transporter 4 with beta1-integrin and its role in cell migration. American journal of physiology Cell physiology. 2009; 296:C414-421.
40. Fujiwara S, Nakagawa K, Harada H, Nagato S, Furukawa K, Teraoka M, Seno T, Oka K, Iwata S and Ohnishi T. Silencing hypoxia-inducible factor-1alpha inhibits cell migration and invasion under hypoxic environment in malignant gliomas. International journal of oncology. 2007; 30:793-802.
41. Coady MJ, Chang MH, Charron FM, Plata C, Wallendorff B, Sah JF, Markowitz SD, Romero MF and Lapointe JY. The human tumour suppressor gene SLC5A8 expresses a Na+-monocarboxylate cotransporter. The Journal of physiology. 2004; 557:719-731.
42. Grillon E, Farion R, Fablet K, De Waard M, Tse CM, Donowitz M, Remy C and Coles JA. The spatial organization of proton and lactate transport in a rat brain tumor. PloS one. 2011; 6:e17416.
43. Rademakers SE, Lok J, van der Kogel AJ, Bussink J and Kaanders JH. Metabolic markers in relation to hypoxia; staining patterns and colocalization of pimonidazole, HIF-1alpha, CAIX, LDH-5, GLUT-1, MCT1 and MCT4. BMC cancer. 2011; 11:167.
44. Oliver L, Olivier C, Marhuenda FB, Campone M and Vallette FM. Hypoxia and the malignant glioma microenvironment: regulation and implications for therapy. Current molecular pharmacology. 2009; 2:263-284.
45. Flynn JR, Wang L, Gillespie DL, Stoddard GJ, Reid JK, Owens J, Ellsworth GB, Salzman KL, Kinney AY and Jensen RL. Hypoxia-regulated protein expression, patient characteristics, and preoperative imaging as predictors of survival in adults with glioblastoma multiforme. Cancer. 2008; 113:1032-1042.
46. Proescholdt MA, Merrill MJ, Stoerr EM, Lohmeier A, Pohl F and Brawanski A. Function of carbonic anhydrase IX in glioblastoma multiforme. Neuro-oncology. 2012; 14:1357-1366.
47. Pinheiro C, Sousa B, Albergaria A, Paredes J, Dufloth R, Vieira D, Schmitt F and Baltazar F. GLUT1 and CAIX expression profiles in breast cancer correlate with adverse prognostic factors and MCT1 overexpression. Histology and histopathology. 2011; 26:1279-1286.
48. Meijer TW, Schuurbiers OC, Kaanders JH, Looijen-Salamon MG, de Geus-Oei LF, Verhagen AF, Lok J, van der Heijden HF, Rademakers SE, Span PN and Bussink J. Differences in metabolism between adeno- and squamous cell non-small cell lung carcinomas: spatial distribution and prognostic value of GLUT1 and MCT4. Lung cancer. 2012; 76:316-323.
49. Morais-Santos F, Granja S, Miranda-Goncalves V, Moreira AH, Queiros S, Vilaca JL, Schmitt FC, Longatto-Filho A, Paredes J, Baltazar F and Pinheiro C. Targeting lactate transport suppresses in vivo breast tumour growth. Oncotarget. 2015; 6:19177-19189. doi: 10.18632/oncotarget.3910. 50. Moniz S, Martinho O, Pinto F, Sousa B, Loureiro C,
Oliveira MJ, Moita LF, Honavar M, Pinheiro C, Pires M, Lopes JM, Jones C, Costello JF, Paredes J, Reis RM and Jordan P. Loss of WNK2 expression by promoter gene
methylation occurs in adult gliomas and triggers Rac1-mediated tumour cell invasiveness. Human molecular genetics. 2013; 22:84-95.
51. Martinho O, Pinto F, Granja S, Miranda-Goncalves V, Moreira MA, Ribeiro LF, di Loreto C, Rosner MR, Longatto-Filho A and Reis RM. RKIP inhibition in cervical cancer is associated with higher tumor aggressive behavior and resistance to cisplatin therapy. PloS one. 2013; 8:e59104.
52. Pojo M, Goncalves CS, Xavier-Magalhaes A, Oliveira AI, Goncalves T, Correia S, Rodrigues AJ, Costa S, Pinto L, Pinto AA, Lopes JM, Reis RM, Rocha M, Sousa N and Costa BM. A transcriptomic signature mediated by HOXA9 promotes human glioblastoma initiation, aggressiveness and resistance to temozolomide. Oncotarget. 2015; 6:7657-7674. doi: 10.18632/oncotarget.3150.