ISSN 1517-7076 artigo e-12150, 2018
Autor Responsável: Ronaldo Pilar Data de envio: 08/02/2017 Data de aceite: 16/05/2018
10.1590/S1517-707620180003.0484
Fresh properties of HPSCC containing
SRA and expansive admixtures
Ronaldo Pilar 1, Raissa Douglas Ferron 2, Wellington Longuini Repette 3
1 Departamento de Engenharia Civil, Universidade Federal do Espírito Santo – UFES, Av. Fernando Ferrais 514, Goia-beiras, CEP 29075-910 Vitória, ES, Brasil.
2 Department of Civil, Architectural and Environmental Engineering, The University of Texas at Austin – Austin, TX - USA
3 Departamento de Engenharia Civil, Universidade Federal de Santa Catarina – UFSC, Rua João Pio Duarte Silva 250, Córrego Grande, CEP 88040-900 Florianópolis, SC, Brasil.
e-mail: [email protected]; [email protected]
ABSTRACT
Shrinkage-reducing admixture (SRA) and expansive admixture (EXA) were used in high performance self-compacting concrete (HPSCC) to mitigate autogenous shrinkage. In order to evaluate the fresh properties of concretes, the rheological parameters were determined in a ICAR rheometer at 10, 25, 40, 60 and 90 min. The flow behavior of the mixtures was described by Bingham, Herschel-Bulkley, and modified Bingham models. Slump flow test, V-funnel test and J-Ring test were also carried out at 10 min. Slump flow test was performed also after 90 min of mixing. The test results showed that, at 10 minutes, all mixtures had similar performances, independently of the SRA and EXA contents. However, the slump flow test shows a reduction of up to 24% of its diameter at 90 min for mixtures with EXA. Mixtures with EXA revealed a gradual in-crease in dynamic yield stress with elapsed time. In contrast, concretes with SRA exhibited less variation in its rheological properties. Statistical analysis (ANOVA) showed that, regardless of the rheological model adopted, the admixture content was not a significant factor for the yield stress, while the type of admixture and the time of testing greatly influenced the concretes rheological response.
Keywords: Shrinkage-reducing admixture (SRA), expansive admixture (EXA), rheological behavior, high performance self-compacting concrete.
1. INTRODUCTION
High performance self-compacting concrete (HPSCC) is a type of concrete that has been developed to exhibit high flowability and mix stability and, at the same time, high strength and durability [1,2]. Higher amounts of Portland cement, superplasticizer, and mineral admixtures, together with low water/binder ratios are used to produce these concretes. Thus, the HPSCC has low porosity and discontinuous small diameter capillary pore structure of the hydrated paste [3,4]. Consequently, HPSCC has potential to present more pronounced autog-enous shrinkage than normal concrete, mainly at early ages [4,5]. Therefore, cracks due to restrained autoge-nous shrinkage can compromise the concrete´s performance, despite of HPSCC´s high strength and durability. To avoid the aforementioned problems, shrinkage-reducing admixtures (SRA) or expansive admixtures (EXA) can be used for shrinkage mitigation.
and amino alcohols with various surfactants [12].
(1)
Although the action of SRA and EXA in the hardened state of concrete has been investigated, little is known about the plastic stage [6,7,11,13–17]. Measurements of workability are essential to guarantee a good quality of concrete and the ease with which the mixture is processed [18]. Tests such as the Abrams cone for traditional concrete or the slump flow test for self-compacting concrete (SCC) are still the chosen everyday tests to quantify the workability of cementitious materials at the building site. Empirical test methods are used to give some kind of rheological description of the fresh concrete, such as slump flow, L-box and V-funnel [19]. However, these tests are very often operator-sensitive [20,21]. Viscometers and advanced rhe-ometers are usually designed to be operatively insensitive and, consequently, retrieve the material´s parame-ters in terms of fundamental physical quantities independent on the details of the apparatus with which they are measured [19]. This way, rheology can be used as a tool to accurately describe the workability of self-compacting concrete by its flow curves.
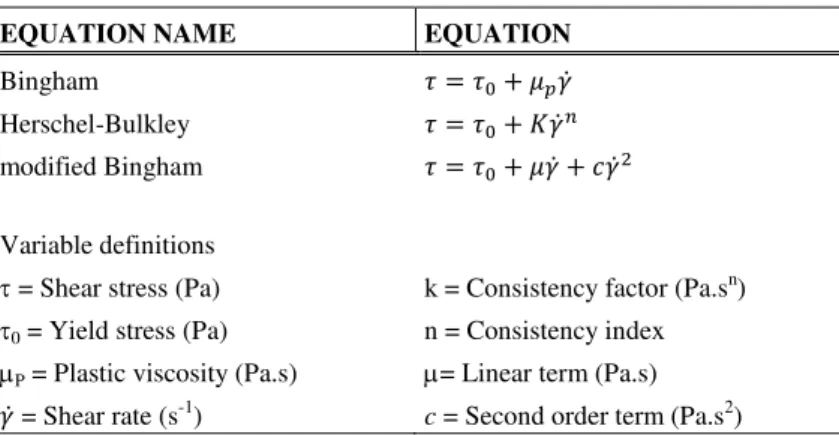
The commonly used rheological models to describe the flow behavior of fresh cementitious material are the Bingham model, the Herschel-Bulkley model, and the modified Bingham model [22–26], which have been used commonly to described viscoplastic fluids [27]. For viscoplastic fluids, at stresses below the yield stress, the shear rate is null, causing the rheological model to intersect the stress axis above the origin [28]. In other words, these materials do not show appreciable deformation until the shear stress has reached the limit, called the yield stress [27]. Table 1 gives the equations of the rheological models abovementioned. It can be observed that Bingham equation is linear. Herschel-Bulkley is a non-liner model and the exponent „n‟ can be n < 1, n > 1, or n = 1, signifying a shear thinning behavior, shear thickening behavior or the Bingham model, respectively [19]. Analogously, the modified Bingham is also a non-liner model which indicates a shear thin-ning behavior, shear thickethin-ning, or the Bingham model when c/ < 0, c/ > 0, or c/ = 0, respectively [29].
Table 1: Rheological models.
EQUATION NAME EQUATION
Bingham ̇
Herschel-Bulkley ̇ modified Bingham ̇ ̇
Variable definitions = Shear stress (Pa) 0 = Yield stress (Pa) P = Plastic viscosity (Pa.s) ̇ = Shear rate (s-1)
k = Consistency factor (Pa.sn) n = Consistency index = Linear term (Pa.s)
c = Second order term (Pa.s2)
Thus, in this paper, fresh state HPSCC mixes with one shrinkage reducing admixture and one expan-sive admixture were evaluated. For the present study, concrete rheometer ICAR and empirical tests for self-compacting concrete (slump flow, V-funnel, J-ring) measurements were carried out. The second part of this study will be an analysis about the hardened properties of these concretes.
2. EXPERIMENTAL PROGRAM
Table 2: Physical properties and chemical composition of solid materials.
MATERIAL PHYSICAL PROPERTIES CHEMICAL COMPOSITION
Specific gravity Fineness, m²/kg SiO2 Al2O3 Fe2O3 CaO MgO SO3 LOI
Cement 3.09 407 18,9 3,7 2,8 62,9 4,2 3,1 3,2
Silica 2.22 - 94,6 <0,04 0,1 0,2 0,3 0,1 2,7
EXA 3,01 374 1,8 4,7 1,3 68,5 0,9 18,2 4,4
Figure 1: Laser particle size distribution of Portland cement, silica fume and EXA.
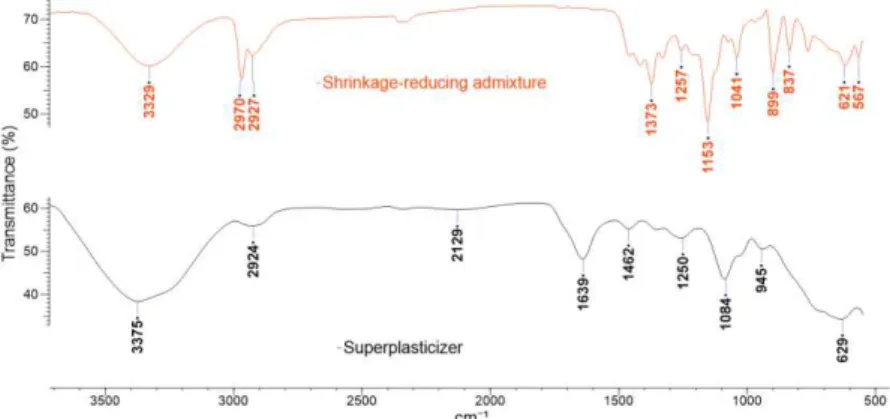
Figure 2: FTIR spectrums of SRA and superplasticizer.
2.1 Concrete mixture proportions
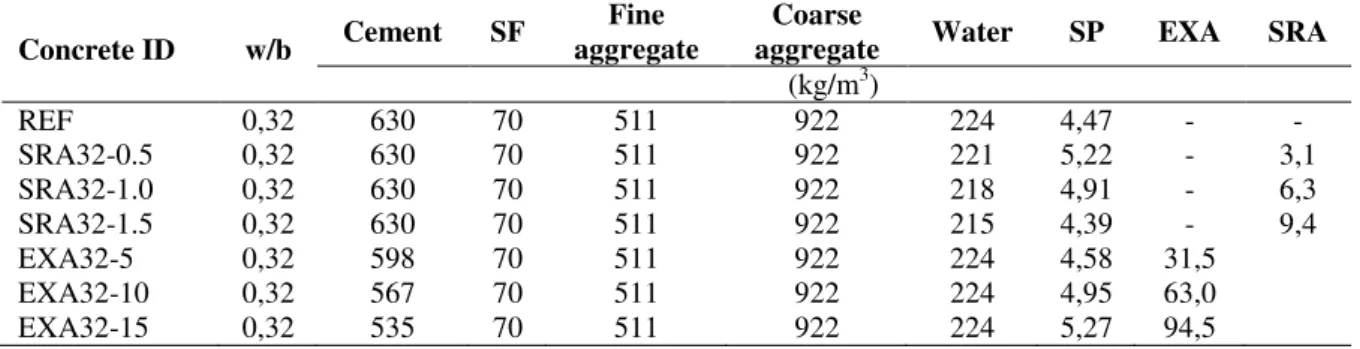
To evaluate the rheological behavior of HPSCC containing SRA and EXA, 7 mix proportions were designed. All the concretes were designed with the same volume of cement paste (455 ± 1 l/m3), fine aggregate (195 ± 1 l/m3), and coarse aggregate (350 ± 1 l/m3). The binder was a composition, by mass, of 10% silica fume (SF) and 90% Portland cement. The mixtures were designed with a water/binder (w/b) ratio of 0.32. Three differ-ent dosages of SRA (0.5%, 1.0%, and 1.5%) and EXA (5%, 10%, and 15%) were used. The percdiffer-entage of the admixtures are given by Portland cement mass. The SRA was added as a partial replacement of the mixing water. The dosage of the EXA was calculated as a partial replacement of the Portland cement. To achieve a slump flow between 65 and 70 cm, different superplasticizer contents were added. The summary of mixture proportions is listed in Table 3.
0 20 40 60 80 100
0,1 1 10 100 1000
% P
ass
in
g
Particle-size distribution (um) Cement
Table 3: Mixture proportions of the HPSCC.
Concrete ID w/b Cement SF
Fine aggregate
Coarse
aggregate Water SP EXA SRA (kg/m3)
REF 0,32 630 70 511 922 224 4,47 - -
SRA32-0.5 0,32 630 70 511 922 221 5,22 - 3,1
SRA32-1.0 0,32 630 70 511 922 218 4,91 - 6,3
SRA32-1.5 0,32 630 70 511 922 215 4,39 - 9,4
EXA32-5 0,32 598 70 511 922 224 4,58 31,5
EXA32-10 0,32 567 70 511 922 224 4,95 63,0
EXA32-15 0,32 535 70 511 922 224 5,27 94,5
2.2 Mixing and tests performed
The solid materials were dry mixed for about 30 s inside of the mixer. Then, after dissolving the SP and SRA in water, when present in the mixture, they were added to the mix. All concretes were mixed for 5 min and kept 3 min resting, then again mixed for more 1 ½ min. After 10 minutes of the addition of water, the slump flow diameter, J-ring diameter and V-funnel flow time tests were conducted simultaneously, regarding ASTM C1611 [30] , ASTM C 1621 [31], and EFNARC [32], respectively. The slump flow test was also per-formed after 90 minutes to check the retention of workability.
The filling ability and stability of self-compacting concrete in the fresh state can be defined by four critical characteristics: flowability, viscosity, passing ability and segregation resistance [32]. The slump flow test is used to monitor the consistency of fresh self-compacting concrete and its unconfined flow potential [30]. Slump flow value is the primary check that the fresh concrete consistence meets the specification [32]. The J-ring is a strong contender for the evaluation of passing ability of self-compacting concrete [31]. HPSCC‟s viscosity can be assessed by V-funnel flow time. Although the direct viscosity cannot be measured, the time value is related by describing the filling ability [32].
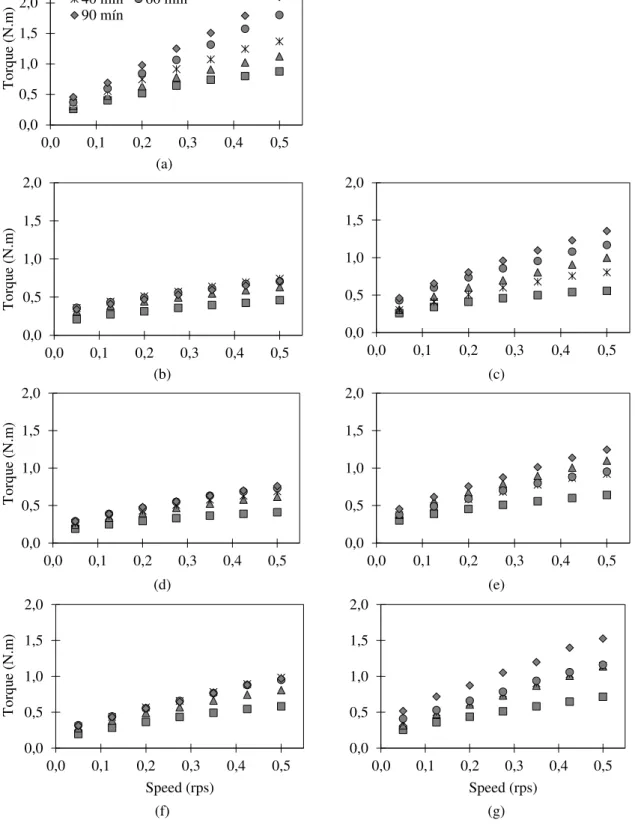
An ICAR rheometer with four blades-vane with a diameter, d, of 127 mm and height, h, of 127 mm was used to measure the rheological behavior of HPSCC. The container with 300 mm diameter was filled with fresh concrete up to a height of 280 mm. The inner wall of the container is equipped with ribs to prevent slippage between the concrete and the steel surface [33]. Each concrete sample was pre-conditioned with a shear of 0.5 rotation per second (rps) for a breakdown period of 20 s. Torque measurements were recorded for seven speeds in descending order every 5 s, ranging from 0.5 to 0.05 rps. Flow curves (torque and rota-tional velocity) were obtained at 10, 25, 40, 60 and 90 min after mixing begins.
2.3 Rheological approach
Three models were used to analyze the rheological response of the fresh concrete: Bingham, Herschel-Bulkley and modified Bingham. For the Bingham model, the data for each time was fitted to a linear equation using ordinary least square regression to determine a slope and an intercept point, according to (2. In this equation GB is the point of intersection of the line with the torque axis (N.m), and relates to the yield stress; HB represents the slope of the line (N.m/rps), and is related to the plastic viscosity; T is the torque (N.m); N is the rotational speed (rev.s-1) [29]. The term yield stress, according to the Bingham model, isreferred as the dynamic yield stress, since this parameter is only correctly characterized when the material is at a steady state in the range of the evaluated shear rate interval [34].
In order to study the rheological behavior by the Herschel-Bulkley model ( (3), experimental steady state data, for each time, was determined by a nonlinear least square curve fitting, where GHB is flow re-sistance (N.m); HHB is the viscosity factor (N.m/rpsJ); and J is the flow index factor. In the same way, for the modified Bingham model, GmB, HmB, and CmB are respectively the flow resistance (N.m), first order term (N.m/rps) and second order term (N.m/rps2).
(2)
(4)
Reiner-Riwlin equation for Bingham materials can be used as follows in the equations (5 and (6 to de-termine the plastic viscosity (Pa.s) and dynamic yield stress (Pa), respectively [26,35,36]. Although it does not provide a point-to-point transformation, it expresses the obtained relation in fundamental units [37], where h is the height (m) of the cylinder submerged in the concrete, R1 is the vane radius (m) and R0 is the outer container radius (m). Similarly, the Herschel-Bulkley and modified Bingham fundamental rheological parameters were determined by Equations (7, (8, (9 and (10, (11, (12, respectively [26,35].
Bingham ( )
( ) (5)
( ) (6)
Herschel-Bulkley
( ) ( ) (7)
( ) (8)
(9)
modified Bingham
( )( ) (10)
( ) (11)
( ( )) (12)
The measurements of rheological parameters for fresh concretes were performed without repetition. However, complementary studies were performed previously to verify the variation of the measurements. The maximum average relative standard deviation for dynamic yield stress was of 6 %. Analysis of variance (ANOVA) was used to determine the significance of the factors evaluated to achieve the rheology parameters.
3. RESULTS AND DISCUSSION
Figure 3: Variation of SP content and Slump flow test with 10 and 90 min of HPSCC with SRA, EXA, and Reference.
Figure 4: V-Funnel time and J-Ring blocking of HPSCC with SRA, EXA, and Reference.
The torque (Nm) and rotational speed (rev/s) obtained from the rheometer for all studied mixtures are presented in
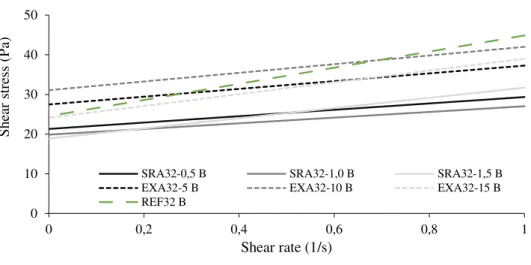
Figure 5.a-g and the rheological properties in fundamental units in Table 4. The results at 10 min show
the same trend as the empirical tests results, with similar rheological behavior between samples (Figures 6, 7 and 8). The similarity in rheological behavior at 10 min of mixtures with EXA, SRA, and Reference mix can be explained by the lack of time for the chemical reactions to occur between EXA and water, which produce ettringite and calcium hydroxide, decreasing free water [7]. However, mixtures with EXA revealed a gradual increase of dynamic yield stress and of plastic viscosity (by Bingham model) over time, result of the above-mentioned chemical reactions involving EXA, as shown in Table 4. In contrast with EXA, SRA does not consume water, it only reduces the surface tension of the pores solution [41]. This can be an explanation for the lesser variation of rheological properties shown by mixtures with SRA, which showed a plateau for rheo-logical parameter after 25 minutes. Moreover, in some cases, the use of SRA has shown an increase of initial setting time of concrete [14]. The results suggest that the SRA can be added together with EXA for reduced slump flow loss. Likewise, a hydration stabilizer agent can be used.
Although all the mixtures showed a similar behavior to empirical and rheological tests, it has not been possible to find a correlation between slump flow diameter and dynamic yield stress for all the rheological models. Initially, it was hypothesized that this happened due to the thickness of the sample at flow stoppage, which should be at least five times the diameter of the largest aggregate to be able to consider the flow of an homogeneous mixture [21], but as Roussel [42] showed, there is no direct correlation between yield stress and slump flow diameter.
4,47
5,22
4,91
4,39 4,58
4,95 5,27 4,0 4,5 5,0 5,5 6,0 6,5 7,0 50 55 60 65 70 75 80
0,5 % 1,0 % 1,5 % 5 % 10 % 15 %
REF32 SRA32 EXA32
SP co nten t ( kg /m ³) Slu m p flo w d iam eter ( cm
) Slump flow - 10 min Slump flow - 90 min Superplasticizer 4 5 6 7 8 0 2 4 6 8 10
0,5 % 1,0 % 1,5 % 5 % 10 % 15 %
REF32 SRA32 EXA32
J -r in g blo ck in g ( cm ) V -Fu nel flo w tim e (s
(a)
(b) (c)
(d) (e)
(f) (g)
Figure 5: Torque versus rotational speed obtained from the rheometer for the reference concrete (a), mixtures with SRA
0.5% (b), 1.0% (d) and 1.5% (f); EXA 5% (c), 10% (e) and 15% (g). 0,0
0,5 1,0 1,5 2,0 2,5
0,0 0,1 0,2 0,3 0,4 0,5
T
or
qu
e
(N.
m
)
10 mín 25 mín 40 mín 60 mín 90 mín
0,0 0,5 1,0 1,5 2,0
0,0 0,1 0,2 0,3 0,4 0,5
T
or
qu
e
(N.
m
)
0,0 0,5 1,0 1,5 2,0
0,0 0,1 0,2 0,3 0,4 0,5
0,0 0,5 1,0 1,5 2,0
0,0 0,1 0,2 0,3 0,4 0,5
T
or
qu
e
(N.
m
)
0,0 0,5 1,0 1,5 2,0
0,0 0,1 0,2 0,3 0,4 0,5
0,0 0,5 1,0 1,5 2,0
0,0 0,1 0,2 0,3 0,4 0,5
T
or
qu
e
(N.
m
)
Speed (rps)
0,0 0,5 1,0 1,5 2,0
0,0 0,1 0,2 0,3 0,4 0,5
Table 4: Rheological parameters.
RHEOLOGICAL PARAMETERS
Time REF32 SRA32 EXA32 (min) 0,5 % 1,0 % 1,5 % 5% 10% 15%
B in gh am m od el Dy nam ic yield str ess ( Pa)
10 24,5 21,3 19,9 18,9 27,5 31,1 24,1 25 27,0 31,6 24,2 25,2 29,4 36,7 25,5 40 29,5 35,4 25,7 26,3 28,6 35,4 30,0 60 21,4 35,7 28,1 28,0 41,4 35,2 34,4 90 22,8 32,5 27,5 26,4 42,3 41,6 45,2
Plas tic Vi sco sity (Pa. s)
10 20,3 8,0 7,2 12,8 9,8 10,9 14,9 25 26,9 10,4 12,3 17,6 22,2 23,2 26,9 40 33,4 12,7 13,8 22,4 16,8 18,4 26,1 60 47,6 11,6 14,8 21,1 24,1 19,2 25,4 90 68,1 12,2 15,5 21,8 29,3 26,1 33,4
Her sch el -B ulk ley m od el Dy nam ic yield str ess ( Pa)
10 3,8 14,2 7,6 5,9 4,9 16,9 16,6 25 12,7 25,1 13,9 16,7 14,0 21,6 23,1 40 19,1 29,2 17,7 20,5 16,8 26,9 28,3 60 24,0 30,3 17,4 22,6 26,2 28,5 33,4 90 32,5 31,3 19,5 23,7 30,0 34,2 40,7
C on sis ten cy fac to r (Pa. sn
) 10 46,2 16,9 22,9 29,0 39,6 28,8 24,1 25 44,4 18,3 25,0 28,0 41,1 41,7 29,7 40 45,9 20,2 23,6 29,3 31,3 28,8 28,1 60 44,5 18,2 27,8 27,6 42,7 27,4 26,6 90 47,4 13,5 25,2 25,1 44,2 34,9 38,8
C on sis ten cy in dex
10 0,59 0,62 0,46 0,59 0,39 0,53 0,74 25 0,73 0,70 0,63 0,75 0,68 0,69 0,94 40 0,82 0,75 0,71 0,85 0,67 0,76 0,96 60 1,04 0,75 0,67 0,85 0,70 0,80 0,97 90 1,08 0,94 0,74 0,92 0,77 0,84 0,91
m od if ied B in gh am m od el Dy nam ic yield str ess ( Pa)
10 16,6 18,7 16,3 13,9 21,7 26,7 21,0 25 20,4 28,9 20,2 21,3 23,8 30,9 24,5 40 24,2 32,6 22,3 23,5 23,4 31,3 28,9 60 22,9 32,8 23,4 25,1 35,3 31,6 33,4 90 31,7 31,9 24,0 24,9 36,8 38,0 42,9
L in ea r ter m (Pa. s)
10 31,8 11,7 12,3 20,1 18,0 17,3 19,3 25 36,5 14,2 18,1 23,3 30,3 31,5 28,4 40 41,1 16,6 18,8 26,6 24,3 24,4 27,6 60 45,5 15,4 21,5 25,3 32,8 24,5 26,9 90 55,3 13,0 20,6 24,0 37,2 31,2 36,7
Seco nd o rd er ter m ( Pa. s²)
10 -2,7 -0,9 -1,2 -1,7 -2,0 -1,5 -1,1 25 -2,3 -0,9 -1,4 -1,4 -1,9 -2,0 -0,4 40 -1,8 -0,9 -1,2 -1,0 -1,8 -1,4 -0,4 60 0,5 -0,9 -1,6 -1,0 -2,1 -1,2 -0,4 90 3,0 -0,2 -1,2 -0,5 -1,9 -1,2 -0,8
Figure 6: Application of the Bingham model on the rheological data at 10 min for of HPSCC with SRA (0.5%; 1.0%;
1.5%), EXA (5%; 10%; 15%) and Reference concrete.
Figure 7: Application of the Herschel–Bulkley model on the rheological data at 10 min for of HPSCC with SRA (0.5%;
1.0%; 1.5%), EXA (5%; 10%; 15%) and Reference concrete.
Figure 8: Application of modified Bingham model on the rheological data at 10 min for of HPSCC SRA (0.5%; 1.0%;
1.5%), EXA (5%; 10%; 15%) and Reference concrete. 0
10 20 30 40 50
0 0,2 0,4 0,6 0,8 1
Sh
ea
r
str
ess
(
P
a)
Shear rate (1/s)
SRA32-0,5 B SRA32-1,0 B SRA32-1,5 B
EXA32-5 B EXA32-10 B EXA32-15 B
REF32 B
0 10 20 30 40 50 60
0 0,2 0,4 0,6 0,8 1
Sh
ear
s
tress
(
P
a)
Shear rate (1/s)
SRA32-0,5 HB SRA32-1,0 HB SRA32-1,5 HB
EXA32-5 HB EXA32-10 HB EXA32-15 HB
REF32 HB
0 10 20 30 40 50
0 0,2 0,4 0,6 0,8 1
Sh
ear
s
tress
(
P
a)
Shear rate (1/s)
SRA32-0,5 mB SRA32-1,0 mB SRA32-1,5 mB
EXA32-5 mB EXA32-10 mB EXA32-15 mB
Figure 9: Consistency index for mixtures with SRA (0.5%; 1.0%; 1.5%), EXA (5%; 10%; 15%) and reference concrete.
Figure 10: relation c/ for mixtures with SRA (0.5%; 1.0%; 1.5%), EXA (5%; 10%; 15%) and reference concrete.
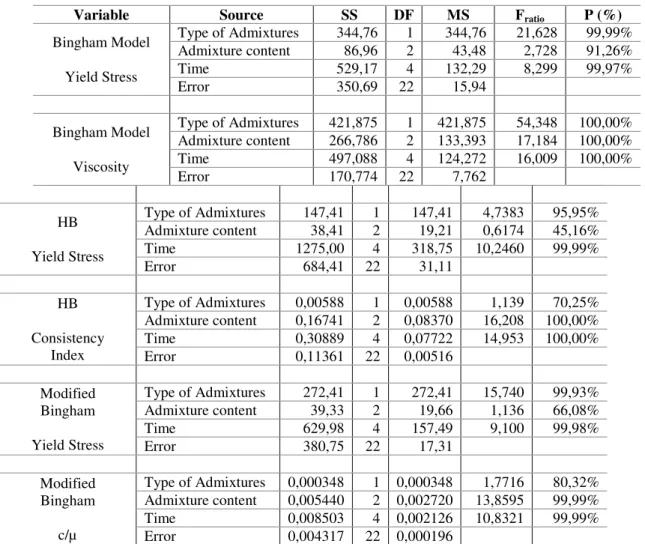
Analysis of variance (ANOVA) was performed to pinpoint the individual effects of factors (type of admixture, admixture content and test time) on the dependent variable. Second order interactions could not be verified, since there was no repetition of concrete. The results of ANOVA for rheological results are pre-sented in Table 5. A factor was considered to have significant effect on the rheological parameters when the Probability was more than 95% (confidence level).
Regardless of the rheological model adopted, the admixture content is not an important factor for the yield stress. On the other hand, the type of admixture and the teste time are equally important. The parame-ters that determine shear-thinning behavior in HB and modified Bingham models (consistency index and c/µ, respectively), are not influenced by the type of additive present, with 95% confidence level. However, the other factors (admixture content and time) are very important for the rheological results of the mixtures. In addition, it can be verified that all the factors are influential in the viscosity (determined by the Bingham model).
0,0 0,2 0,4 0,6 0,8 1,0 1,2
0 20 40 60 80 100
C
on
sis
ten
cy
in
dex
(
n)
Time (min)
SRA32-0,5 HB SRA32-1,0 HB SRA32-1,5 HB
EXA32-5 HB EXA32-10 HB EXA32-15 HB
REF32 HB
-0,12 -0,08 -0,04 0,00 0,04 0,08
0 20 40 60 80 100
R
elatio
n
c/µ
(
m
od
if
ied
B
in
gh
am
)
Time (min)
SRA32-0,5 mB SRA32-1,0 mB SRA32-1,5 mB
EXA32-5 mB EXA32-10 mB EXA32-15 mB
Table 5: ANOVA for rheological results.
Variable Source SS DF MS Fratio P (%)
Bingham Model
Yield Stress
Type of Admixtures 344,76 1 344,76 21,628 99,99% Admixture content 86,96 2 43,48 2,728 91,26%
Time 529,17 4 132,29 8,299 99,97%
Error 350,69 22 15,94
Bingham Model
Viscosity
Type of Admixtures 421,875 1 421,875 54,348 100,00% Admixture content 266,786 2 133,393 17,184 100,00%
Time 497,088 4 124,272 16,009 100,00%
Error 170,774 22 7,762
HB
Yield Stress
Type of Admixtures 147,41 1 147,41 4,7383 95,95% Admixture content 38,41 2 19,21 0,6174 45,16%
Time 1275,00 4 318,75 10,2460 99,99%
Error 684,41 22 31,11
HB
Consistency Index
Type of Admixtures 0,00588 1 0,00588 1,139 70,25% Admixture content 0,16741 2 0,08370 16,208 100,00%
Time 0,30889 4 0,07722 14,953 100,00%
Error 0,11361 22 0,00516
Modified Bingham
Yield Stress
Type of Admixtures 272,41 1 272,41 15,740 99,93% Admixture content 39,33 2 19,66 1,136 66,08%
Time 629,98 4 157,49 9,100 99,98%
Error 380,75 22 17,31
Modified Bingham
c/µ
Type of Admixtures 0,000348 1 0,000348 1,7716 80,32% Admixture content 0,005440 2 0,002720 13,8595 99,99%
Time 0,008503 4 0,002126 10,8321 99,99%
Error 0,004317 22 0,000196
SS: sum of squares; DF: degree of freedom; MS: mean square; Fratio: F-statistic (source/error); P: probabil-ity.
4. CONCLUSION
This paper demonstrated that high performance self-compacting concrete can be designed with SRA and EXA without major damage to the rheological properties of the mixtures. All the mixtures studied can be classified as SCC even at 90 min after started the mix. This was possible by the high dosage of superplasti-cizer used to reach the target slump flow diameter between 650 and 690 mm. The mixture with 10% of ex-pansive admixture required the highest dosages of superplasticizer. Concrete with exex-pansive admixture showed a gradual increase of dynamic yield stress and a slump flow loss over time. The addition of SRA in HPSCC had little influence in the rheological behavior of the mixtures over time. The results suggest that the SRA can be added together with EXA for reduced slump flow loss.
5. ACKNOWLEDGEMENT
A Coordenação de Aperfeiçoamento de Pessoal de Nível Superior – CAPES (99999.008307/2014-08). ANEEL, Projeto UFSC- CESP n. PD-0061-0001/2010
FAPESC-CNPq Projeto PRONEX University of Texas at Austin – USA.
6. BIBLIOGRAPHY
[ MEHT P. TCIN P.-C. “Principles Underlying Production of High-Performance Concrete” Cem. Concr. Aggregates, v 12, n. 2, pp 70-78, 1990.
[3] AÏTCIN, P.C. High-Performance Concrete, 2nd ed, London, E& FN SPON, 2004.
[4] JENSEN, O.M., H NSEN P.F. “ utogenous deformation and RH-change in perspective” Cem. Concr. Res., v. 31, pp. 1859–1865, Dec. 2001.
[5] TAZAWA, E., MIY Z W S. “Experimental study on mechanism of autogenous shrinkage of co
n-crete” Cem. Concr. Res., v. 25, pp. 1633–1638. Dec. 1995.
[6 M ILV G N M N.P. “Miscellaneous dmixtures” In: Concr. Admixtures Handb., 2nd ed, c. 15, Can-ada, WA Publications, pp. 939–1024, 1996.
[7] NAGATAKI, S., GOMI H. “Expansive admixtures (mainly ettringite)” Cem. Concr. Compos., v. 20 pp. 163–170. Mar.1998.
[8] REPETTE, W. L., MAILVAGANAM, N. P. “Calcium sulphoaluminate based expansive admixtures – A Re-view”. In: Proceedings ofSeventh CANMET/ACI International Conference on Superplasticizers and oth-er Admixtures in Concrete, p. 177-198, Berlin. Proceedings. ACI-SP-217, v. 1. American Concrete Institute, October, 2003.
[9] REPETTE, W. L., M ILV G N M N. P. “Pre-hydrated high alumina cement based admixture for compensating autogenuos shrinkage in HPC”. In: Proceedings of Second CANMET/ACI International Con-ference on High Performance Concrete. Pp. 39-57. Gramado, Brasil. Proceedings: Second CANMET/ACI International Conference - ACI SP 186. Gramado. 1999.
[10] HUA, C., ACKER, P., EHRL CHER . “ nalyses and models of the autogenous shrinkage of harde
n-ing cement paste. I. Modelln-ing at macroscopic scale” Cem. Concr. Res.,v. 25, n.7, pp.1457–1468, Oct.1995. [11] BENTZ, D.P. “ review of early-age properties of cement-based materials” Cem. Concr. Res., v. 38 pp. 196–204, Feb. 2008.
[12] GAGNÉ, R. Shrinkage-reducing admixtures, In: Science and Technology of Concrete Admixtures, 1st ed., c. 23, UK, Woodhead Publishing, pp. 457-469, 2016.
[13] SHOYA, M., SUGITA, S., SUG W R T. “Improvement of drying shrinkage and shrinkage cracking
of concrete by special surfactants” In: Admixtures Concr. Improv. Prop., 1st ed., c. 5, Barcelona, RILEM, pp. 521–541, 1990
[14] FOLLIARD, K.J., BERKE N.S. “Properties of high-performance concrete containing
shrinkage-reducing admixture” Cem. Concr. Res., v. 27, n.9, pp. 1357–1364, Sept. 1997.
[15] RONGBING, B., JI N S. “Synthesis and evaluation of shrinkage-reducing admixture for cementitious
materials” Cem. Concr. Res., v.35, n. 3, pp. 445–448, Mar. 2005.
[16] MORA-RUACHO, J., GETTU, R., AGUADO, A. “Influence of shrinkage-reducing admixtures on the
reduction of plastic shrinkage cracking in concrete” Cem. Concr. Res., v. 39, n. 3, pp.141–146. Mar. 2009. [17] WYRZYKOWSKI, M., TRTIK, P., MÜNCH, B., et al., “Plastic shrinkage of mortars with shrinkage
reducing admixture and lightweight aggregates studied by neutron tomography” Cem. Concr. Res., v. 73, pp. 238–245. Jul. 2015.
[18] YAHIA, A., MANTELLATO, S., FL TT R.J. “Concrete rheology: a basis for understanding chemical admixtures” In: Science and Technology of Concrete Admixtures, 1st ed., c. 7, UK, Woodhead Publishing, pp 97-127, 2016.
[19] WALLEVIK, O.H., W LLEVIK J.E. “Rheology as a tool in concrete science: The use of rheographs and workability boxes” Cem. Concr. Res., v. 41, n. 12, pp. 1279–1288. Dec. 2011
[20] NGUYEN, T.L.H., ROUSSEL, N., COUSSOT P. “Correlation between L-box test and rheological
pa-rameters of a homogeneous yield stress fluid” Cement and Concrete Research, v. 36, n.10, pp. 1789–1796, Oct. 2006.
[21 ROUSSEL N. “From industrial testing to rheological parameters for concrete” In: Underst. Rheol. Concr., 1st ed., c. 4, UK, Woodhead Publishing, pp. 83–95, 2012.
[22] TATTERSALL, G.H., BANFILL, P.F.G. The rheology of fresh concrete, 1st ed., London, Pitman ad-vanced Publishing. 1983.
[23] TATTERSALL, G.H. Workability and quality control of concrete, 1st ed. London, Spon, 1991. [24] FERR RIS C.F. “Measurement of the rheological properties of high performance concrete: State of the art report” J. Res. Natl. Inst. Stand. Technol., v. 104, n.5, pp. 461-478., Setp. 1999.
[25] YAHIA, A., KH Y T K.H. “ nalytical models for estimating yield stress of high-performance
[26] FEYS, D., WALLEVIK, J.E., YAHIA, A., et al., “Extension of the Reiner–Riwlin equation to determine
modified Bingham parameters measured in coaxial cylinders rheometers” Mater. Struct., v. 46, pp. 289–311. Jul. 2013
[27] FRIDTJOV, I. Continuum Mechanics, 1st ed., Noruega, Springer, 2008.
[28] WALLEVIK, O.H., FEYS, D., WALLEVIK, J.E., et al., “ voiding inaccurate interpretations of rheo-logical measurements for cement-based materials” Cem. Concr. Res., v. 78, pp.100–109, Dec. 2015
[29] GÜNEYISI, E., GESOGLU, M., AL-GOODY, A., et al., “Fresh and rheological behavior of nano-silica and fly ash blended self-compacting concrete” Constr. Build. Mater., v. 95, pp. 29–44, Oct. 2015
[30] ASTM C 845, Standard specification for expansive hydraulic cement, ASTM Int. 4, 1–3, 2012. [31] ASTM C 1611, Standard test method for slump flow of self-consolidating concrete, ASTM Int.,1–6, 2014.
[32] ASTM C 1621, Standard test method for passing ability of self-consolidating concrete by J-ring, ASTM Int. 5., 2014.
[33] EFNARC, The European Guidelines for Self-Compacting Concrete, Eur. Guidel. Self Compact. Concr. 2005.
[34] SAAK, A.W., JENNINGS, H.M., SH H S.P. “The influence of wall slip on yield stress and viscoela
s-tic measurements of cement paste” Cem. Concr. Res., v. 31, n. 2, pp. 205–212, Feb. 2001.
[35 BILLBERG P. “Understanding formwork pressure generatedby fresh concrete” In: Underst. Rheol. Concr., 1st ed., c. 12, UK, Woodhead Publishin, pp. 296–330.
[36] HEIRMAN, G., VANDEWALLE, L., VAN GEMERT, D., et al., “Integration approach of the Couette inverse problem of powder type self-compacting concrete in a wide-gap concentric cylinder rheometer, J.
Nonnewton.” Fluid Mech., v. 150, n.2-3, pp. 93–103, April 2008.
[37] HEIRMAN, G., HENDRICKX, R., VANDEWALLE, L., et al., “Integration approach of the Couette inverse problem of powder type self-compacting concrete in a wide-gap concentric cylinder rheometer: Part
II. Influence of mineral additions and chemical admixtures on the shear thickening flow behaviour” Cem. Concr. Res., v. 39, n. 3, pp. 171–181, March 2009.
[38] FEYS, D., VERHOEVEN, R., SCHUTTER G. “Fresh self compacting concrete a shear thickening material” Cem. Concr. Res., v. 38, n. 7, pp. 920–929, Jul. 2008.
[39] LU, C., YANG, H., MEI G. “Relationship between slump flow and rheological properties of self co m-pacting concrete with silica fume and its permeability” Constr. Build. Mater., v. 75, pp157–162, Jan. 2015. [40] NAJIM, K.B., AL-JUMAILY, I., TE .M. “Characterization of sustainable high performance /
self-compacting concrete produced using CKD as a cement replacement material” Constr. Build. Mater., v.103, pp. 123–129, Jan. 2016.
[41] EFNARC, Specification and Guidelines for Self-Compacting Concrete, Eur. Guidel. Self Compact. Concr. 44, 2005.
[42] LURA, P., PEASE, B., MAZZOTTA, G.B., et al., “Influence of Shrinkage-Reducing Admixtures on
Development of Plastic Shrinkage Cracks” ACI Mater. J., v. 104, pp. 187–194, Jan. 2007
[43 ROUSSEL N. “The LCPC BOX: a cheap and simple technique for yield stress measurements of SCC”