R. Bergantin, M. M. Maru,
M. C. M. Farias and
L. R. Padovese
Escola Politécnica da Universidade de São Paulo Departamento de Engenharia Mecânica Av. Prof. Mello Moraes 2231 05508-900 São Paulo, SP. Brazil [email protected], [email protected], [email protected] and [email protected]
Dynamic Signal Analyses in Dry
Sliding Wear Tests
This work proposes to perform a dynamic analysis of the friction force and the vibrations produced in pin-on-disk sliding tests. The sliding tests were run under dry condition with austenitic stainless steel and high-speed steel pairs. The obtained results were the pin mass loss, the average friction force and power spectrum density (PSD) graphs of the friction force and vibrations in normal and tangential directions to the contact. It was possible to notice that some natural frequencies of the machine system are excited during the tests. Analyses of the magnitudes of a specific frequency could show the existence of a relation between the machine system dynamics and the average friction and wear results, and it depended on the tested materials.
Keywords: Wear, vibration, dynamic analysis
Introduction
From the sliding tests, the most common results considered for the tribological studies are the friction force, the material loss rate and the wear mechanisms. Pin-on-disk sliding contacts can be modeled as dynamic systems (Ibrahim, 1994), where the input would be the sliding energy due to normal load and sliding velocity. As outputs of the system, wear, friction, vibration and noise can be cited (Zum Gahr, 1987; Czichos, 1992).1
The audible sounds accompanying the friction and wear process in sliding tests indicate the presence of dynamic fluctuations on the forces and movements in the contact area. It is common to relate those facts with the random nature of the involved phenomena in the interaction between the bodies. During the tests, the friction force is seen as a fluctuating signal; however, normally only its average value is considered to characterize the friction between the contact bodies. In the same way, the normal load, which is generally considered static, can also fluctuate in the contact. The fluctuations can be caused by the interactions between the surface asperities and the induced dynamics of the contacting bodies (Soom and Kim, 1983a; Soom and Kim, 1983b), and the equipment vibration (Yoon et al., 1997). The system vibration can be influenced by many factors. The system rigidity is considered to be one of the most important influences to the system vibration and consequently to affect the friction and wear (Chiou, Kato and Kayaba, 1985; Kato, Iwabuchi and Kayaba, 1982). In such a way, the sliding contact events can be related with the dynamic response of the sliding tests. Thus, the dynamic response characterization can show information correlated with the wear mechanisms and the friction behavior. A more detailed analysis of the dynamic events during the sliding tests should advance the knowledge on the friction nature and the friction-wear relationship.
This work proposes to perform a dynamic analysis of the friction force and the vibrations produced in pin-on-disk sliding tests. The sliding tests were run with specimens of austenitic stainless steel and high speed steel, which have distinct tribological behavior (Dumblenton and Douthett, 1977; Wilson and Alpas, 1999). Previous work on dynamics characterization in pin-on-disk sliding tests (Farías et al., 2000; Bergantin et al., 2001) suggested that the dynamic signal analyses could show information related with the results of friction force and worn surface characteristics. In this paper, dynamic signal analyses of the friction force and the induced vibrations in dry sliding wear tests are also done. The
stainless steel and high-speed steel. It was possible to notice some evidences of dynamic information well correlated with the tribological behavior of the tested pair of materials.
Experimental Method
The tests were done with a pin-on-disk apparatus with dead load system, TE79 model, manufactured by Plint&Partners.
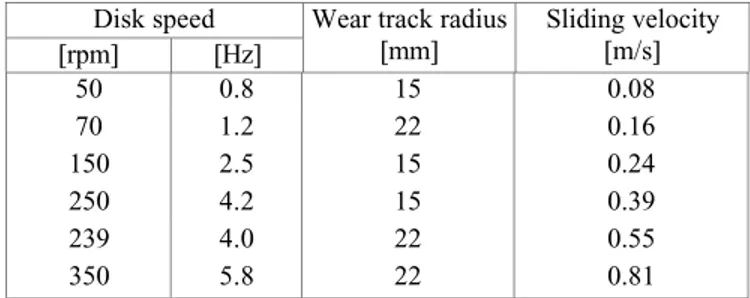
The sliding wear tests were performed at six sliding velocities (0.08, 0.16, 0.24, 0.39, 0.55 and 0.81 m/s), using a 5.8 N dead load, room temperature and 50% relative humidity. Previous tests were done to observe the dynamic response in the sliding test varying the pin track radius and keeping the tangential velocity. The obtained results showed that the spectral composition at these velocities was independent on the track radius. Therefore, it was adopted wear track radius of 15 mm and 22 mm. Table 1 shows the rotational speeds and the wear track radius used for the tests.
Table 1. Speed and wear track radius corresponding to the sliding velocities used for the tests.
Disk speed [rpm] [Hz]
Wear track radius [mm]
Sliding velocity [m/s]
50 0.8 15 0.08
70 1.2 22 0.16
150 2.5 15 0.24
250 4.2 15 0.39
239 4.0 22 0.55
350 5.8 22 0.81
/ Vol. XXV, No. 3, July-September 2003 ABCM 286
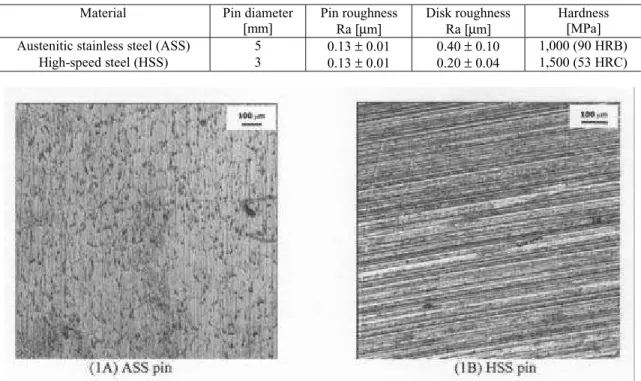
Table 2. Characteristics of pins and disks.
Material Pin diameter [mm]
Pin roughness Ra [µm]
Disk roughness Ra [µm]
Hardness [MPa] Austenitic stainless steel (ASS) 5 0.13± 0.01 0.40± 0.10 1,000 (90 HRB)
High-speed steel (HSS) 3 0.13± 0.01 0.20± 0.04 1,500 (53 HRC)
Figure 1. Surface appearance of pins before the sliding tests, observed by optical microscopy; 100x magnitude.
The tests were run up to a constant friction level, that is, up to a sliding condition where a horizontal friction trend was attained. Some preliminary tests revealed that the constant friction level condition was attained distinctly for each pair of materials to be tested. For ASS pair, the total test duration was 2 hours. However, for HSS pair, the total test duration depended on the tested velocity. In this case, the tests were run up to a same sliding distance. The reason for that was more than 2 hours test was necessary to reach the steady-state condition at lower velocities. At the lowest velocity, it was necessary 5.2 hours, corresponding with 1,500 m sliding distance. Since it was verified that all the tests reached the steady-state friction with 1,500 m, it was used this distance for all the tests with HSS pair. Table 3 shows the testing time and the sliding distance for the two tested materials.
Table 3. Testing time and sliding distance used for the two tested materials.
Total testing time [h] Total sliding distance [m] Velocity
[m/s] (ASS) (HSS) (ASS) (HSS)
0.08 2.0 5.2 576 1,500
0.16 2.0 2.6 1,152 1,500
0.24 2.0 1.7 1,728 1,500
0.39 2.0 1.1 2,808 1,500
0.55 2.0 0.8 3,960 1,500
0.81 2.0 0.5 5,832 1,500
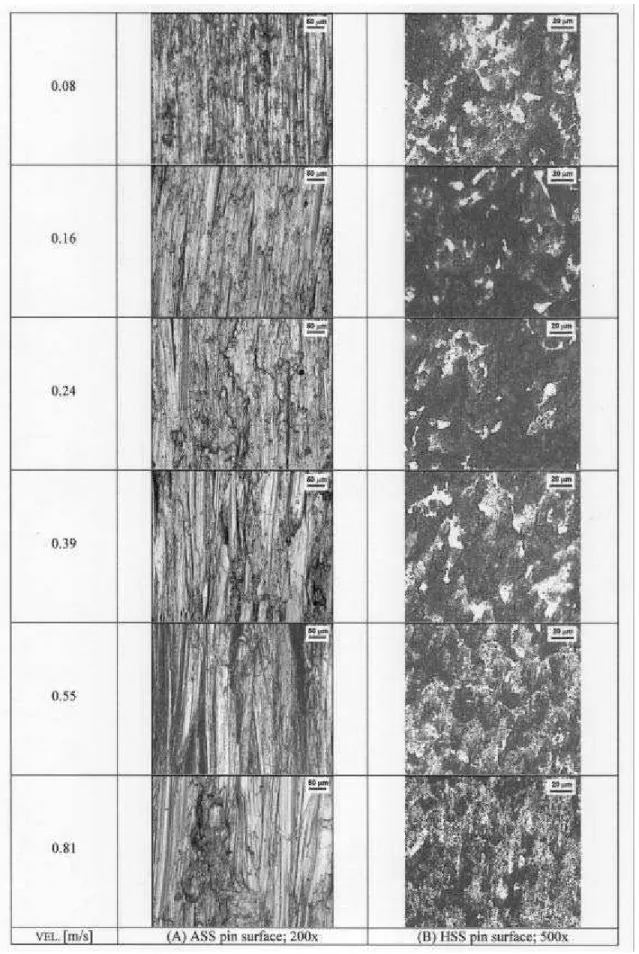
The pin mass was measured by an analytical balance (0.0001g accuracy) and the worn surfaces of the pins were observed by optical microscopy.
The data acquired from the sliding wear tests were the average friction force, the normal and the tangential accelerations and the dynamic friction force.
The average friction force was obtained using the acquisition system of the machine (Plint system). The system acquires friction data from a strain gauge sensor at a maximum of 10 Hz rate of sampling frequency (5 Hz bandwidth) during all the testing time.
Figure 2. Schematic representation of the machine, showing the sensors positioning. The numbers 1, 2 and 3 indicate the points for the impulsive excitation application.
In order to assess the natural frequencies of the machine system, some tests were done with the machine turned off and the pin in contact with the disk. Three tests were done by applying an vertical impulsive excitation in three positions of the machine system: (1) on the machine ground, (2) on the disk specimen and (3) on the disk holder. Figure 2 shows the three positions where the pulses were applied. The objective of these tests was just to identify the natural frequencies; the corresponding natural modes were not determined. The signals from the accelerometers and from the strain gage sensor in these tests were acquired at 10 kHz acquisition rate and 50,000 data points were collected. A signal analysis was performed through PSD graphs observation.
Results
Average Friction Force and Wear
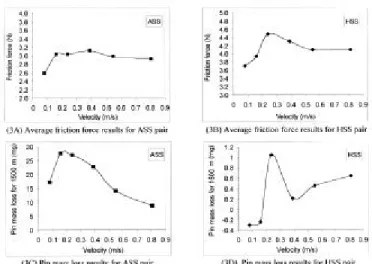
Figure 3 shows the average friction force obtained from the Plint system and the pin mass loss, both as a function of the sliding velocity. Each point refers to the average of three and two tests, respectively for the ASS and HSS pairs. The curves were analyzed considering the average trends. In general, Figs. 3A and 3B show that the average friction force of ASS pair was lower than the friction force of HSS pair. For ASS pair, the friction at the lowest velocity was slightly lower than the friction at other velocities. For HSS pair, a maximum average friction is noticed at 0.24 m/s. Regarding the pin mass loss shown in Fig. 3C and 3D, the plotted values represent the mass loss for 1,500 m sliding distance. It is possible to observe from these figures that the mass loss for ASS
pair was substantially higher than for HSS pair. Additionally, it is possible to notice a distinct behavior of the pin mass loss with the tested velocities for each material. With ASS pair, the pin mass loss increased up to 0.24 m/s and then clearly decreased with the velocity. With HSS pair, there was a maximum at 0.24 m/s; however, the general trend shows that the pin mass loss increased with the velocity. Also with this pair, it is possible to see that there was some mass gain at the two lower velocities, indicating that some material was adhered on the pin surface at these velocities.
Figure 3. Average friction force and pin mass loss as a function of sliding velocity.
/ Vol. XXV, No. 3, July-September 2003 ABCM 288
Dynamic Analyses
Identification of Natural Frequencies of the Machine System
The PSD graphs of the signals relative to the accelerations and the tangential force obtained from the applied pulses in the three positions, indicated in Fig. 1, were analyzed. Analyses on frequency bands up to 5,000 Hz were performed. The PSD graphs showed no relevant frequencies above 1,500 Hz. It was also possible to notice the presence of some frequency bands in a similar way in the graphs respective to the applied pulses, in the three positions. Figure 5 shows the PSD graphs obtained from the applied pulses on position 3. It is possible to observe that the load cell signal presents a distinct frequency at 53 Hz. The signals from the accelerometers present frequencies with high magnitude at 53 Hz and at 360 to 450 Hz band.
The spectra indicate that there is possibly a natural mode that produces vibrations, at the mentioned frequencies, on both tangential and normal directions.
Figure 5. PSD graphs resulting from the pulse excitation on the disk holder (position 3).
Dynamic analysis results from the sliding tests
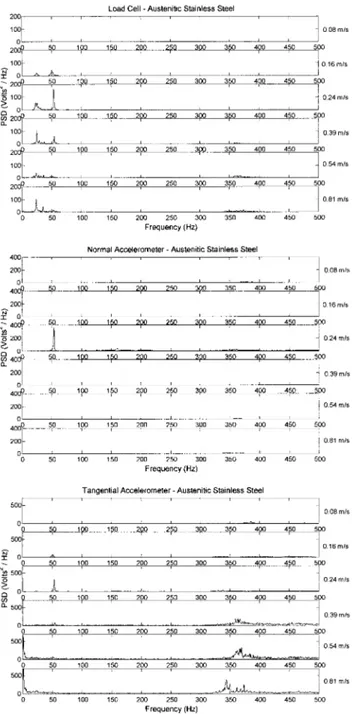
The PSD graphs of the normal and tangential accelerations and of the dynamic friction force were obtained. Figures 6 and 7 show these graphs for the ASS and HSS materials respectively. Previous analyses revealed that the main frequencies of the spectra were in the 0-500 Hz band. Therefore, to characterize the spectral energy distribution, all the spectra were plotted in this band. The DC component (the mean value, which is the 0 Hz component) was removed of the spectra, just to evidence the fluctuations around the mean value.
/ Vol. XXV, No. 3, July-September 2003 ABCM 290
Figure 7. PSD graphs of the dynamic friction force, the tangential and the normal accelerations, as a function of sliding velocity obtained from tests with HSS pair.
Observing the PSD graphs in Figs. 6 and 7, it is possible to notice that there is no presence of order phenomena (frequencies that depended on velocity). The velocity change only affects the magnitude of the frequencies. This observation indicates that the spectral components of the signals are originated from natural frequencies of the machine system. This conclusion can be reinforced by the results of frequency analyses shown in Fig. 5. It is also possible to notice, in the spectra of Figs. 6 and 7, the presence of several natural frequencies mainly at 53 Hz, which is present in all graphs for both ASS and HSS materials.
The graphs in Figs. 6 and 7 were plotted at same scale in vertical axis for looking at the magnitude evolution of the 53 Hz frequency with the velocity. It is possible to observe that there is a maximum magnitude at 0.24 m/s velocity for all the signals and for both
materials. The test condition at this velocity corresponded to the higher pin mass loss result. Such a fact seems to indicate a correlation between the modulation of 53 Hz magnitude and the pin mass loss. It also seems to indicate that both dynamic and tribological phenomena occurring at the contact surfaces have a maximum intensity at 0.24 m/s velocity.
The magnitude evolution of the 53 Hz frequency with the velocity is shown in Fig. 8. The presented values are averages of three tests, and can be related to the power of the signal at this frequency. Therefore, the average magnitudes can quite represent the actual trends of the signal energy in the 53 Hz frequency. Comparing the magnitudes, in a general way, the magnitudes in the tangential signals in HSS tests are 10 times higher than in ASS tests. It can be an indicative that the machine system was subjected to a tangential vibrating energy at 53 Hz in the HSS tests 10 times higher than in the ASS tests.
Figure 8. Average magnitudes of the 53 Hz frequency as a function of the sliding velocity, for the dynamic friction force, the normal and the tangential accelerations.
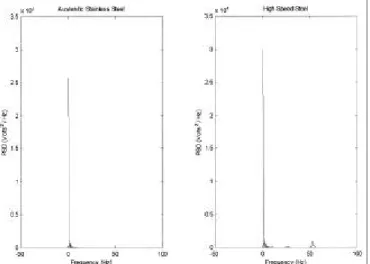
Some additional dynamic analyses were performed to evaluate the influence of machine system dynamics on the average friction results. Figure 9 shows the PSD plot from the load cell signal with the DC component, for tests with both materials. In this case, the DC component represents the average value of friction force signal. It is possible to see in Fig. 9 that the DC component is dominant in both spectra. This fact makes clear that the influence of machine system dynamics on friction results is insignificant.
Figure 9. PSD graphs with the DC component (signal from load cell; test at 0.08 m/s velocity), from ASS and HSS tests.
Summary of Results
Austenitic Stainless Steel Test Results
The worn surface micrographs showed that the wear occurred predominantly by plastic deformation mechanism. Some evidence of oxidation was seen at lower velocities. The higher mass loss occurred at 0.24 m/s and the average friction force was practically unvarying along the velocities tested.
In the PSD graphs of the normal and tangential accelerations and the dynamic friction force, the 53 Hz was predominant. Furthermore, from the PSD graphs, it was possible to see that there were also frequencies in the 360 to 450 Hz band being excited. All these frequencies are natural frequencies of the machine system. The 53 Hz magnitude of all the analyzed signals had a maximum at 0.24 m/s. This testing condition corresponded to the highest mass loss result. In addition to that, it was possible to notice that the vibration in the tangential direction at 360 to 450 Hz band frequency had significant magnitude in the tests with velocities higher than 0.24 m/s and they were absent in the tests with lower velocities. It denotes that there was different vibration excitation which depended on the tested condition.
Preliminary Conclusions:
The machine system dynamics has its characteristics changed, depending on the test velocity, shown by the magnitude modulation of 53 Hz with the velocity.
The 0.24 m/s velocity shows to provide a distinct dynamic loading condition to the tested pair. It resulted in a distinct dynamic response in terms of dynamic friction force and normal and tangential accelerations.
The machine system dynamics is related to the occurring contact phenomena between pin and disk, in a manner that the highest dynamic energy, both in normal and tangential direction, corresponds to the highest mass loss. At higher velocities, another dynamic behavior at higher frequency band of 360 to 450 Hz band occurs. It an be an indicative of a distinct contact phenomena occurrence.
High-Speed Steel Test Results
The worn surface analyses indicated that the wear occurred predominantly by oxidation mechanism.
A distinct maximum mass loss occurred at 0.24 m/s. The average friction force was also higher at this velocity. Comparing with austenitic stainless steel results, the mass loss was substantially lower and the average friction was higher.
Contrary to that observed with austenitic stainless steel, the PSD graphs of high-speed steel tests showed that the dynamic behavior was similar for all the tested velocities, presenting a distinct frequency mainly at 53 Hz. It can be noticed that this frequency was present in a distinct way for the tested velocities: in terms of its magnitude modulation, a maximum seemed to occur at 0.24 m/s; however, it was also possible to see a second maximum at 0.55 m/s in the tangential direction signals. Comparing with austenitic stainless steel results for the tangential direction signals, the magnitudes of 53 Hz frequency were around 10 times higher.
Preliminary Conclusions:
The machine system dynamics has some of its characteristics
friction force. This fact occurs at 0.24 m/s velocity. On the other hand, if the dynamic response at 53 Hz in the tangential direction can be related with the acting phenomena in the contact between pin and disk, it is possible to conclude that the contact phenomena are unvarying with the tested velocities for the tests with high-speed steel.
Conclusion
From the obtained results, it was observed that friction and wear responses depended on the sliding velocity, where each pair of materials responded differently during the tests performed. Comparing austenitic stainless steel and high-speed steel results, the first presented higher pin mass loss and lower friction.
Analyzing the dynamic results, it is possible to consider that the phenomena in the contact among the tested materials caused an excitation on the system at its natural frequencies, particularly at 53 Hz. Besides, it was observed that the influence of the machine system dynamics on the friction results is minimal.
From the 53 Hz magnitude analyses, it was possible to see that these magnitudes were modulated by the tribological contact phenomena. The main evidence was seen by contrasting the wear, friction and dynamic response at 0.24 m/s. At this velocity, it was observed a higher dynamic energy level in the normal acceleration signal for the tests with both materials. In this way, it can be stated that the dynamic loading depended on the sliding velocity, even when the static loading was the same. Considering the tangential direction results, the austenitic stainless steel tests revealed that they resulted less vibrating than high-speed steel tests. Additionally, the tangential direction dynamics in the austenitic stainless steel tests accompanied that observed in the normal direction, presenting a maximum magnitude at 0.24 m/s. For high-speed steel tests, the tangential direction dynamic response indicated more than only a maximum value. These distinct behaviors of the dynamic response in the tangential direction can be an indicative of the distinct phenomena occurring in the contact. Those contact phenomena seemed to progress from oxidation to plastic deformation for austenitic stainless steel and for high speed steel, mainly oxidation. With these results, it is emphasized the remarkable importance of monitoring the system dynamics during the wear and friction investigations.
Acknowledgements
The authors acknowledge FAPESP (Sao Paulo State Research Support Foundation) for research support (00/04245-8, 97/12753-9 and 98/15987-3).
References
Bergantin, R., Maru, M.M., Farías, M.C.M., Padovese, L.R. Dynamic signal analyses in dry sliding wear tests for high speed steel, CD ROM Proceedings of COBEM 2001, 24th to 30th November, Uberlândia, Brazil.
Chiou,Y.C. Kato, K. and Kayaba, T., 1985, “Effect of normal stiffness in loading system on wear of carbon steel – part 1: severe-mild wear transition”, Journal of Tribology. Vol.107, pp.491-495.
Czichos, H., 1992, “Design of friction and wear experiments.” In: ASM Handbook, Vol.18: Friction, Lubrication and Wear Technology, ASM International, pp.481.
/ Vol. XXV, No. 3, July-September 2003 ABCM 292
Ibrahim, R.A., 1994, “Friction induced vibration, chatter, squeal, and chaos. Part II: Dynamics and modeling. Part of Friction induced vibration", Appl. Mech. Rev., Vol.47, No.7, ASME Reprint N. AMR 147, pp. 227-253.
Kato, K., Iwabuchi, A. and Kayaba, T., 1982, “The effects of friction induced vibration on friction and wear”, Wear 80, pp.307-320.
Proakis, J.G. and Manolakis, D.G., 1996, “Digital signal processing”, 3rd Edition, Prentice Hall.
Soom, A. and Kim, C., 1983a, “Interactions between dynamic normal and frictional forces during unlubricated sliding”, Transactions of the ASME, Journal of Lubrication Technology, Vol.105, pp.221-229.
Soom, A. and Kim, C., 1983b, “Roughness-induced dynamic loading at dry and boundary-lubricated sliding contacts”, Transactions of the ASME, Journal of Lubrication Technology, Vol.105, pp.514-517.
Wilson, S. and Alpas, A.T., 1999, “Wear mechanism maps for TiN-coated High Speed Steel”, Surface and Coatings Technology, Vol. 120-121, pp.519-527.
Yoon, E., Kong, H., Kwon, O. and Oh, J., 1997, “Evaluation of frictional characteristics for a pin-on-disk apparatus with different dynamic parameters”, Wear 203-204, pp.341-349.