MASTER OF SCIENCE IN
FINANCE
MASTERS FINAL WORK
PROJECT
EQUITY RESEARCH
:
E
ATON
C
ORPORATION
A
NA
S
OFIA
L
OPES
B
ARBOSA
MASTER OF SCIENCE IN
FINANCE
MASTERS FINAL WORK
PROJECT
EQUITY RESEARCH
:
E
ATON
C
ORPORATON
A
NA
S
OFIA
L
OPES
B
ARBOSA
S
UPERVISOR
:
P
ROF
.
D
OUTOR
C
ARLOS
M
ANUEL
C
OSTA
B
ASTARDO
Abstract
This report contains a detailed evaluation of Eaton Corporation and follows the format recommended by the CFA Institute.
The choice of this company was due to the fact of having carried out an internship in its subsidiary in Portugal and thus getting to know a little more of this industry. This report was made using the public information available at September 2017, information and events after this date were not considered. To obtain the target price, two methods were used, one absolute and one relative. The absolute was the Discounted Cash Flow (DCF) method and the relative one was the multiples comparable method. At the end of 2017 the target price is $64.91, our final recommendation for Eaton Corporation is to sell. Our risk assessment still estimates a low risk for the company.
JEL classificationL: G10; G32; G34.
Resumo
Este relatório contém uma avaliação detalhada da Eaton Corporation e segue o formato recomendado pelo CFA Institute.
A escolha desta empresa deveu-se ao facto de ter realizado um estágio na sua sucursal em Portugal e assim tendo ficado a conhecer um pouco mais desta industria. Este relatório foi realizado através da informação pública disponível até setembro de 2017, informações e eventos após esta data não foram considerados.
Para a obtenção do preço-alvo, dois métodos foram utilizados, um absoluto e um relativo. O absoluto foi o método dos Fluxos de Caixa Descontados (DCF) e o relativo foi o método dos múltiplos comparáveis. No final de 2017 o preço-alvo é de $64.91, sendo a nossa recomendação final para a Eaton Corporation de venda. A nossa avaliação do risco estima ainda um risco baixo para a empresa.
Classificação JEL: G10; G32; G34.
Acknowledgements
Elaborating a thesis is a difficult work, that requires a lot of dedication and time. This project
represents the end of a very important stage of my life and would not have been possible
without the support of my family, friends and professors.
To my parents and sister for always pushing me and encouraging me to keep going. For all
their support not only during this phase, but through all my life.
To all of those that in one moment or another lifted my spirits and made me continue this
journey.
Index
Abstract
i
Resumo
ii
Acknowledgements
iii
Index
iv
List of Figures
v
List of Tables
v
1.
Research Snapshot
7
2.
Business Description
9
3.
Management and Corporate Governance
10
4.
Industry Overview and Competitive Positioning
12
5.
Investment Summary
17
6.
Valuation
19
7.
Financial Analysis
22
8.
Investment Risks
24
Appendices
26
Appendix A: Statement of Financial Position
26
Appendix B: Income Statement
28
Appendix C: Cash Flow Statement
29
Appendix D: Long-term debt
30
Appendix E: Common-Size Statement of Financial Position
31
Appendix F: Common-Size Income Statement
33
Appendix G: Forecasting Assumptions
34
Appendix H: Business Structure
37
Appendix I: Management and Corporate Governance
41
Appendix J: Valuation
43
Appendix K: Key Financial Ratios
48
Appendix L: Peer Selection
50
Appendix M: Risk Matrix
52
Appendix N: Porter’s Five Forces
53
Appendix O: SWOT Analysis
55
References
56
List of Figures
FIGURE 1 - EATON SHARE PRICE MOVEMENTS ... 7
FIGURE 2 – STOCK PERFORMANCE OF EATON VS S&P 500 ... 7
FIGURE 3 – NET SALES BY GEOGRAPHICAL DESTINATION (2016) ... 9
FIGURE 4 – NET SALES (BILLIONS OF DOLLARS) ... 9
FIGURE 5 – EATON SEGMENTS (2015) ... 10
FIGURE 6 – MAJOR SHAREHOLDERS (DECEMBER 31, 2016) ... 12
FIGURE 7 – REAL GDP GROWTH ... 12
FIGURE 8 – US INFLATION RATE ... 12
FIGURE 9 – GENERAL GOVERNMENT GROSS DEBT ... 12
FIGURE 10 – R&D EXPENSES (MILLION DOLLARS) ... 14
FIGURE 11 – POPULATION (MILLIONS OF PEOPLE) ... 14
FIGURE 12 – AIRCRAFT PRODUCTION ... 15
FIGURE 13 – TOP 25 MILITARY SPENDING NATIONS 2015 (BILLION DOLLARS)... 15
FIGURE 14 – FORECASTED U.S. INDUSTRY OUTPUT GROWTH (INFLATION ADJUSTED PERCENT CHANGE) ... 16
FIGURE 15 –PORTER’S FIVE FORCES ... 16
FIGURE 16 – TARGET PRICES VS CURRENT PRICE ... 17
FIGURE 17 – AVERAGE WEIGHT OF EACH SEGMENT ON EATON’S NET SALES ... 19
FIGURE 18 – CPS AS A PERCENTAGE OF NET SALES ... 19
FIGURE 19 – SAR AND R&D COSTS ... 19
FIGURE 20 – WACC FORECAST ... 20
FIGURE 21 – R&D EXPENSES ... 21
FIGURE 22 – NET SALES BY SEGMENT ... 22
FIGURE 23 – GROSS PROFIT MARGIN ... 22
FIGURE 24 – NET PROFIT... 22
FIGURE 25 –EATON’S CAPITAL STRUCTURE ... 23
FIGURE 26 – ROE ... 23
FIGURE 27 – YEARLY CASH DIVIDEND PER ORDINARY SHARE ... 23
List of Tables
TABLE 1 EATON'S MARKET PROFILE 7
TABLE 2 - RISK ASSESSMENT ON EATON 7
TABLE 3 – VALUATION OUTPUT 7
TABLE 4 - EATON’S FINANCIAL HIGHLIGHTS 8
TABLE 5 –EATON’S BRIEF PROFILE 9
TABLE 6 – ETN FEATURED MARKETS 10
TABLE 7 – RESTRUCTURING PLAN COSTS AND BENEFITS 10
TABLE 8 – LEADERSHIP STRUCTURE 11
TABLE 9 - BASE SALARY MAIN EXECUTIVE OFFICERS (2016) 11
TABLE 10 – FORWARD STARTING FLOATING-TO-FIXED INTEREST RATE SWAPS (DECEMBER
31,2016) 13
TABLE 11 – FIXED-TO-FLOATING INTEREST RATE SWAPS (DECEMBER 31,2016) 13 TABLE 12 – AVERAGE EXCHANGE RATE BY YEAR (CURRENCY PAIR: USD) 13
TABLE 13 – PEER COMPANIES 16
TABLE 14 – VALUATION SUMMARY 17
TABLE 15 – EFFECTS OF CHANGING WACC IN PRICE 18
TABLE 16 –CHANGES IN NWC 19
TABLE 18 – WACC ASSUMPTIONS 20
TABLE 17 – WACC COMPUTATION 20
TABLE 19 - MULTIPLES 21
TABLE 20 – MULTIPLES METHOD OUTPUT 21
Eaton Corporation:
With a target price of $64.91 for the end of 2017, our recommendation for Eaton Corporation is to sell. This represents a downside risk of 13% from its closing price on September 12, 2017 of $74.57.
Figure 1 - Eaton share price movements
Source: Nasdaq
The main sources of revenues for the company are the Electrical Products and Electrical Systems and Services segments.
Figure 2 – Stock performance of Eaton vs S&P 500
Source: Company data 40
45 50 55 60 65 70 75 80 85
11/09/2014 11/09/2015 11/09/2016 11/09/2017
Closing price on September 12, 2017
1.
Research Snapshot
Eaton Corporation
Sell
RecommendationTable 1 Eaton's market profile
Closing Price $74.57 Open price $73.50
High $74.65
Low $73.46
52-week high $81.63 52-week low $59.07
Volume 1,739,515
Shares
outstanding 455
Source: Reuters
Table 2 - Risk assessment on Eaton
LOW MEDIUM HIGH Source: Author
Table 3 – Valuation output
DCF $64.91
Multiples $65.28
EV/Sales
1.92
P/E
18.94
This sector is mainly composed by large companies with reputation in the sector that invest large amounts on R&D. This is a mature sector and to gain market share, Eaton, must innovate and manufacture products that have a good quality/price relation.
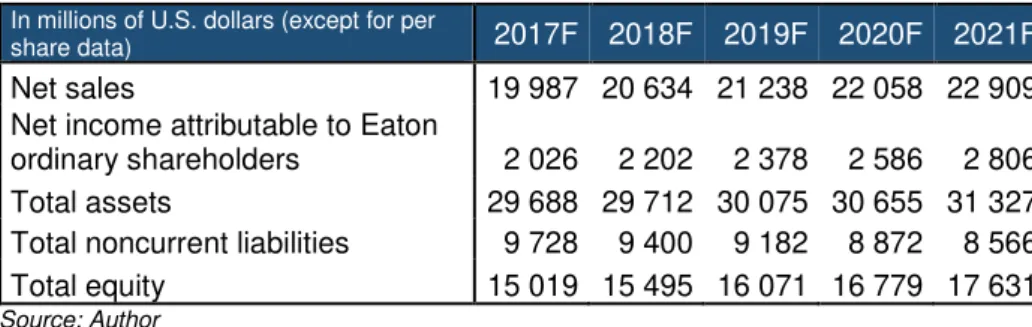
Table 4 - Eaton’s financial highlights
In millions of U.S. dollars (except for per
share data) 2017F 2018F 2019F 2020F 2021F
Net sales 19 987 20 634 21 238 22 058 22 909 Net income attributable to Eaton
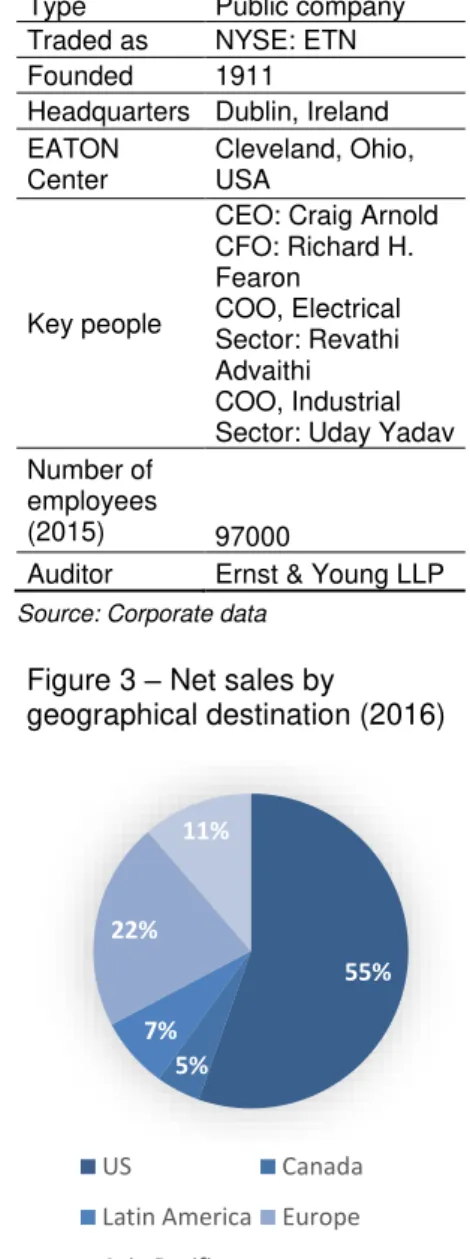
Eaton Corporation Plc is a power management company created in 1911 by Viggo Torbensen jointly with Joseph Oriel Eaton. Originally its name was Tobensen Gear and Axle Company and only in 1971 becomes Eaton Corporation. The company provides energy-efficient solutions that help to effectively manage electrical, hydraulic and mechanical power more efficiently, safely and sustainably.
It is originally from Newark, New Jersey, but its current US center is in Ohio and its headquarters in Dublin, Ireland – Table 5. Eaton has approximately 97000 employees in over 60 countries and sells products in more than 175 countries – Figure 3. It had net sales of $20.9 billion in 2015 and $19.7 billion in 2016 – Figure 4.
Over its more than 100 years of history, Eaton made numerous acquisitions and at the end of 2015 it had more than 400 subsidiaries spread all over the world (Appendix H). The top five countries in terms of subsidiaries are: USA, China, United Kingdom, Germany and Luxembourg.
Business segments
1. Electrical Products (EP) and Electrical Systems and Services (ESS): the EP segment consists of products such as electrical components, industrial components and residential products. The ESS segment consists of power distribution and assemblies, three phase power quality, hazardous duty electrical equipment and many other. The principal markets for these segments are industrial, institutional, governmental, utility, commercial, residential and information technology. These products are used wherever there is a demand for electrical power in a variety of buildings and facilities.
2. Hydraulics: it’s consider a global leader segment in hydraulics components, systems and services for industrial and mobile equipment. Some of the products offered by Eaton comprise a wide range of power products, a broad range of controls and sensing products, a full range of fluid conveyance products, filtration systems solutions, industrial drum and disc brakes; and golf grips.
3. Aerospace: is a leading global supplier of aerospace fuel, hydraulics, and pneumatic systems for commercial and military use.
4. Vehicle: is a leader in the design, manufacture, marketing, and supply of drivetrain and powertrain systems and critical components that reduce emissions and improve fuel economy, stability, performance, and safety of cars, light trucks and commercial vehicles. Includes products such as transmissions, clutches and hybrid power systems.
2.
Business Description
Table 5 –Eaton’s brief profile Type Public company Traded as NYSE: ETN Founded 1911Headquarters Dublin, Ireland EATON
Center
Cleveland, Ohio, USA
Key people
CEO: Craig Arnold CFO: Richard H. Fearon
COO, Electrical Sector: Revathi Advaithi COO, Industrial Sector: Uday Yadav Number of
employees
(2015) 97000
Auditor Ernst & Young LLP Source: Corporate data
Figure 3 – Net sales by
geographical destination (2016)
Source: Corporate data
55% 5% 7% 22% 11% US Canada
Latin America Europe
Asia Pacific
Figure 4 – Net sales (billions of dollars)
Source: Corporate data
16,3
22 22,6 20,9 19,7
The business segment with the largest impact on net sales is the EP segment, approximately 35% in 2016 - Figure 5.
Featured markets
Eaton products and services serve a large variety of markets. The key markets in which the company actuates are: aviation, healthcare, data center, machine building, mining, metals and minerals, oil and gas, rail, utility industry, vehicles and government and military – Table 6.
Company strategies
The global growth has slowed, and for that, the company felt the need to make some changes and adopt new strategies to overcome this situation.
Eaton is undertaking a three-year (2015 through 2017) $400 million restructuring plan. The objective of this strategy is to reduce enterprise-wide structural costs and ensure that the company will be able to compete effectively and provide the returns that are expected by investors – Table 7.
The company as announced a plan to buyback a total of $3 billion of their own shares from 2015 through 2018. This, in combination with the dividend yield, will be implemented to provide a substantial base annual return to the shareholders. It is expected that this restructuring plan will lower the structural enterprise costs of the company and provide savings every year, which will strengthen its earnings profile. Eaton bought back a total of $1.41 billion of its outstanding shares, in the last two years. In 2015, the repurchase was of 11.3 million shares, corresponding to $682 million and in 2016 it was of 11.8 million shares, that correspond to $730 million.
Eaton follows a structure in which the Chief Executive Officer (CEO) of Eaton Corporation also serves as Chairman of the Board of the company. In addition, the Board has a Lead Director that must be independent – Table 8.
Craig Arnold is Chairman and CEO of the company since June 1, 2016. Before his election, Alexander M. Cutler was the Chairman and CEO since August 2000.
Christopher M. Connor was elected Lead Director by the independent directors on January 1, 2017. His responsibilities include chairing meetings of the Board when the Chairman is not present, approving the agenda and schedule for Board meetings on behalf of the independent directors, approving information sent to the Board, serving as a link between the Chairman and the independent directors, and being available for consultation and direct communications with shareholders and other Company stakeholders. (Appendix I)
Board committees
The Board of Directors has the following five committees:
3.
Management and Corporate Governance
Figure 5 – Eaton Segments (2015)
Source: Corporate data
35% 29% 11% 9% 16% Electrical Products
Electrical Systems and Services
Hydraulics
Aerospace
Vehicle
Table 6 – ETN featured markets 1. Aviation
2. Healthcare 3. Data center 4. Machine building
5. Mining, metals and minerals 6. Oil and gas
7. Rail
8. Utility industry 9. Vehicles
10. Government and military 11. Water and wastewater 12. Residential
13. Renewables 14. Buildings
15. Mobile machinery and equipment
Source: Corporate data
Table 7 – Restructuring plan costs and benefits
Cost Benefits
2015 $129 $78
2016 $211 $210
2017F $100 $155
2018F - $75
Total $440 $518
Audit: this committee must assist the Board in overseeing the integrity of financial statements, the performance of the internal auditors, the independence, qualifications and performance of the external auditors and the agreement between legal and regulatory requirements. It is also the responsible for the choice of the independent auditor.
Compensation and Organization: this committee must review all proposed organization or responsibility changes at a senior officer level, evaluate the performance of the company Chairman and CEO as well as the other senior officers, review the succession plans for the company’s Chairman and CEO and other key officer positions, review recruitment practices, determine the annual salaries – Table 9 - and other incentives for senior officers, establish performance objectives, administrate the stock plans and review an annual report for the proxy statement regarding executive compensation.
Executive: this committee must act on matters requiring Board action during the intervals between Board meetings and carry out any function of the Board, with excepting for filling Board or Committee vacancies. The CEO, Craig Arnold, serves as Committee Chair.
Finance: this committee must periodically review the company’s financial condition and recommend financial policies to the Board, analyze the company’s debt-to-equity ratio, review and make recommendations to the Board regarding their dividend policy, review the cash flow proposal for long and short-term debt financing and financial risk management program, and review the performance of the management pension committees and any other fiduciaries appointed by the Board for pension and profit-sharing retirement plans and review the key assumptions used to calculate annual pension expenses.
Governance: this committee must recommend to the Board improvements in corporate governance processes and any changes in the Board Government Policies, advise the Board on changes in the size and composition of the Board, make recommendations to the Board regarding the structure and responsibilities of the Board committees, annually submit to the Board candidates for members and chairs of each standing Board committee, identify and recommend to the Board candidates for Board membership (in consultation with the CEO), review and recommend to the Board the nomination of directors for re-election, oversee the orientation of new directors and the ongoing education of the Board, recommend to the Board compensation of non-employee directors, administer the Board’s policy on director retirements and resignations and establish guidelines and procedures to be used by the directors to evaluate the Board’s performance.
All directors that compose the Board of the company are independent, with exception of the Chairman and CEO. There are currently eleven non-employee directors, four of them are serving or have served as CEO of a public traded company. Each independent director serves rotating four month terms on the Executive Committee. All committees, with exception of the Executive, are chaired by independent directors.
Table 8 – Leadership structure 1. Chairman and CEO
2. Lead Director
3. Vice Chairman and Chief Financial and Planning Officer
4. Chief Operating Officer, Electrical Sector
5. Chief Operating Officer, Industrial Sector
6. Corporate Officers
7. Board of Directors
Source: Corporate data
Table 9 - Base salary main executive officers (2016)
Name and Principal Position Salary C. Arnold Chairman and CEO $1,040,389
R. H. Fearon
Vice Chairman and CFO and Planning Officer
$852,550
R. Advaithi
COO — Electrical Sector
$700,001
U. Yadav
COO – Industrial sector
602,885
M. M. McGuire
Executive Vice President, General Counsel and Secretary $583,976 A. Cutler Retired Chairman and retired CEO
$541,666
Compensation
The compensation of the main executive officers is composed by the following elements: Base salary (on average, accounts for 14% of the total compensation in 2015), bonus, stock and option awards, non-equity incentive plan compensation, changes in pension value and nonqualified deferred compensation earnings and all other compensations.
Shareholders
The major shareholders of Eaton (have more than 5% of its ordinary shares) in 2016 were the following: Wellington Management Group LLP with 36,731,889 shares and The Vanguard Group with 29,653,276 shares – Figure 6.
The directors and executive officers of the company hold less than 1% of the outstanding ordinary shares.
World economic outlook
In 2016, global economic growth is expected to remain modest at approximately 3.1 percent – Figure 7. The forecast for 2016 implies a lower growth of GDP in relation to 2015. This occurs mainly due to weaker than expected activity in advanced economies and taking in consideration the implications of the UK referendum. However, from 2017 and beyond, is expected a recovery of the global economy, with a GDP growth between 3 and 4 percent. Emerging and developing economies are the main drivers for this recovering, since these are the ones expected to have a higher growth rate. Advanced economies are expected to have a modest growth.
The United States economy is expected to have a lower growth in 2016. This slowdown in GDP growth is mainly caused by low business investment, which reflects negative energy investment, dollar appreciation, some financial turbulence and the electoral cycle. In 2017, GDP is expected to have a higher growth (2.2 percent), triggered by lower energy prices and the fading of the US dollar past appreciation. However, potential growth for the medium-term is very modest, this is caused by the aging of the population and by the low total factor productivity growth. US inflation rate – Figure 8 - has been falling until 2015 and is now expected to grow over the next couple of years achieving steady values between 2 and 3 percent.
In Europe, the forecast for the growth of GDP is favourable, since it is expected to grow at a higher rate every year until it stabilizes at 1.8 percent. The main factors that support the growth in 2016 are the low oil prices, the modest fiscal expansion and the easy monetary policy. However, activity will be affected by Brexit, because it creates uncertainty and weaker investor confidence. Medium-term potential growth is modest because of the aging population, low total factor productivity growth and legacies from the financial crisis, such as high unemployment and debt– Figure 9.
4.
Industry Overview and Competitive Positioning
Figure 6 – Major shareholders (December 31, 2016)
Source: Corporate data
8% 7%
85%
Wellington Management Group LLP
The Vangard Group
Other
Figure 7 – Real GDP growth
Source: IMF 0 1 2 3 4
2012 2013 2014 2015 2016 2017F 2018F 2019F 2020F 2021F
World USA
Europe
Figure 8 – US inflation rate
Source: IMF 0
1 2 3
2012 2013 2014 2015 2016 2017F 2018F 2019F 2020F 2021F
Figure 9 – General government gross debt 68 70 72 74 76 78 80
2012 2013 2014 2015 2016
Market conditions
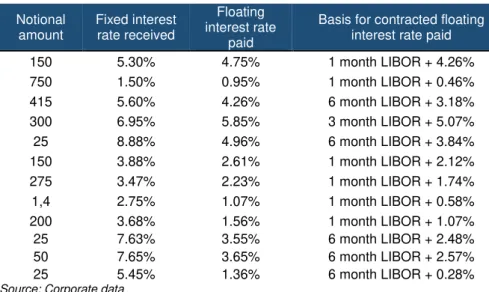
Eaton finances its business through operating cash flow and a mix between short-term and long-term debt, because of this, Interest rates are an important matter to take in consideration during its activity. To control the risk of interest rate changes, Eaton enters into interest rate swaps. These swaps can be fixed-to-floating interest rate swaps – Table 10 -, to manage interest rate risk for certain long-term debt, or forward starting floating-to-fixed interest rate swaps – Table 11 -, to manage interest rate risk on an anticipated debt refinancing in 2017.
Table 11 – Fixed-to-Floating Interest Rate Swaps (December 31,2016)
Notional amount Fixed interest rate received Floating interest rate paid
Basis for contracted floating interest rate paid
150 5.30% 4.75% 1 month LIBOR + 4.26% 750 1.50% 0.95% 1 month LIBOR + 0.46% 415 5.60% 4.26% 6 month LIBOR + 3.18% 300 6.95% 5.85% 3 month LIBOR + 5.07% 25 8.88% 4.96% 6 month LIBOR + 3.84% 150 3.88% 2.61% 1 month LIBOR + 2.12% 275 3.47% 2.23% 1 month LIBOR + 1.74% 1,4 2.75% 1.07% 1 month LIBOR + 0.58% 200 3.68% 1.56% 1 month LIBOR + 1.07% 25 7.63% 3.55% 6 month LIBOR + 2.48% 50 7.65% 3.65% 6 month LIBOR + 2.57% 25 5.45% 1.36% 6 month LIBOR + 0.28% Source: Corporate data
Eaton operates in a large variety of markets using different currencies and for that, it is exposed to Exchange Rate fluctuations. The exchange rates will have a substantial impact on revenues. The companies’ functional currency is the U.S. dollar and the exposure to transactions denominated in other currencies are monitored regularly. To mitigate this exposure, Eaton enters into forward exchange contracts and currency swaps. Some of this currency exchange contracts are not designated as hedges, but simply derivatives. This are contracts in which Eaton enters to manage currency volatility or exposure on intercompany sales and loans. The majority of the currency exchange contracts are of this kind.
Table 12 – Average exchange rate by year (Currency pair: USD)
EUR GBP CAD JPY CNY
2012 0.78 0.63 0.99 79.84 6.31
2013 0.75 6.64 1.03 97.59 6.15
2014 0.75 0.61 1.10 105.86 6.16
2015 0.90 0.65 1.28 121.06 6.28
2016 0.90 0.74 1.33 108.80 6.64
2017, March 0.94 0.81 1.32 114.04 6.89 Source: OFX
The U.S. Dollar has been appreciating in relation to the main currencies of the markets in which Eaton operates – Table 12. This appreciation had a negative impact on results of operations.
Table 10 – Forward Starting Floating-to-Fixed Interest Rate Swaps (December 31,2016)
Fixed interest rate to be paid
2.52% 2.38% 2.19% 2.19% 1.95% 1.80% 1.67% 1.66% 1.53% Notional
amount 50
Floating interest
to be received —% Basis for
contracted floating interest
rate received
3 month LIBOR + 0.00%
Cost drivers
One of the main costs for Eaton are the purchase of Raw materials. The major requirements include iron, steel, copper, nickel, aluminum, brass, tin, silver, lead, molybdenum, titanium, vanadium, rubber, plastic, electronic components, insulating materials and fluids. To prevent shortages, Eaton maintains an appropriate level of inventory.
Another important cost for Eaton are the Research and development expenses for new products and improvement of the existing ones. Over the past five years, the Company has invested approximately $2.9 billion in research and development – Figure 10. R&D is very important for the company’s activity since the industry in which it operates is driven by innovation.
Other costs to take in consideration are the Shipping and handling costs and the costs with Staff.
Demand & Supply
As seen before, GDP previsions are favourable when considering not only the world as an all, but also when considering only Europe, however, GDP forecast for the U.S. is not so favourable. The U.S. represents the biggest end market for Eaton’s products. The slowdown in output growth in this region will have a negative impact on the Demand for Eaton’s products.
A decrease in demand for Eaton’s products has been seen in all segments of activity in the last couple of years. In the EP segment, the decrease in demand was primarily due to the decline in Asia Pacific. In the ESS segment the main cause of decrease was the weakening in oil and gas markets and large industrial products. The Hydraulics segment was affected by the continued weakness in the mobile and industrial markets. In the Aerospace segment, the decrease in military OEM markets was the main cause for lower demand. Finally, the Vehicle segment demand decrease mainly due to the lower North American Class 8 truck market.
However, some opportunities of growth may be created by the main trends, such as the global population growth – Figure 11 -, the growing investment in vital infrastructures in the U.S. and around the world, the importance of protecting the environment and the rapid technological changes.
To face these obstacles and grab these opportunities, Eaton must be always adjusting its Supply and innovating to keep up with the technological advances and try to be one step ahead of its competitors. With the increase of social awareness about the climatic changes and the environment, Eaton has been investing to have a more “green” and sustainable production.
Industrials sector
The sector in which Eaton operates is the industrials sector. According to the Global Industry Classification Standard (GICS), the industrials sector is composed by three industry groups divided into fourteen different industries. The industry group in which Eaton operates is the Capital Goods. This group is composed by seven industries, including Aerospace & Defence and Electrical Equipment.
Figure 8 – R&D expenses (million dollars)
Source: Corporate data
439
644 647 625 589
0 200 400 600 800
2012 2013 2014 2015 2016
Figure 9 – Population (millions of people) Source: IMF 0 1000 2000 3000 4000 5000 6000 7000 8000 United States Asia and Pacific Europe World
Aviation & Defence is an important source of revenue for the aerospace segment of Eaton. This industry has two sub-sectors: Commercial aerospace and Defence.
The Commercial aerospace sub-sector suffered a slowdown in 2016, but is expected to recover mainly due to the strong demand for next-generation aircraft and the growing in the number of passengers travelling (especially in the Asia Pacific and the Middle East regions). The two largest aircraft manufacturers, Airbus and Boeing, indicated that the production rate is expected to grow in the next couple of years – Figure 12.
Figure 10 – Aircraft production
Source: Deloitte
The Defence sub-sector, is also expected to grow, especially in the U.S., since the new U.S. administration is driven to strengthen the country’s military. In Figure 13 it’s represented the countries that have the largest military expense, and for that, are the major end markets for these products.
Figure 11 – Top 25 military spending nations 2015 (billion dollars)
Source: Deloitte 0
500 1000 1500 2000 2500
2009 2010 2011 2012 2013 2014 2015
With this growth, demand for aerospace equipment is expected to increase.
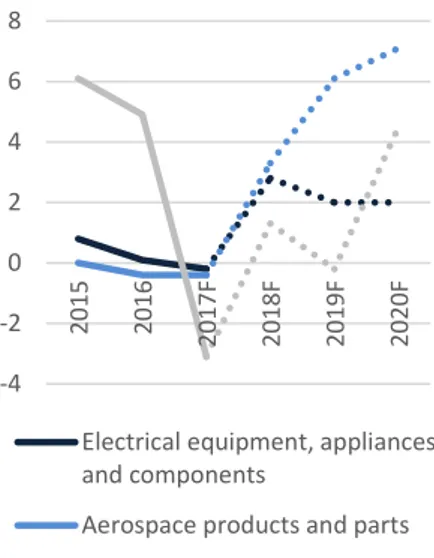
The Electrical equipment industry is the biggest contributor of revenues for Eaton. This industry has suffered because of the increase in international competition and because of the remaining effects of the economic recovery. However, over the next five years, it is expected a stimulation of demand caused by upgrades in infrastructures. Demand is also expected to increase due to the growth in the manufacturing sector and in new construction activity. (source: IbisWorld). To maintain its competitive position in this sector, Eaton must invest in R&D and in innovating technologies
From Figure 14 it can be seen that production is expected to increase in the United States in the upcoming years for the main industries in which Eaton operates. In 2017 a decrease is expected, especially for the Motor Vehicle and parts industry, but after that a positive output growth is forecasted.
Peers
The company as selected a group of twenty publicly traded companies that they consider as its peers - Table 13. Fourteen of the companies are direct peers in all segments, the remaining six are considered indirect but relevant peers. The selection of the peer companies considers, among other factors: market capitalization, revenue, research and development intensity and overlap with Eaton’s product portfolio and industry. Eaton is approximately at the median of this peer group in terms of revenue.
Competitive position
To analyse the competitive position of the company, the SWOT analysis and Porter’s five forces - Figure 15 - are generally used. These two approaches are explained with more detail in Appendixes O and N, respectively.
Table 13 – Peer companies
Direct competitors Indirect competitors
ABB Ltd. Deere & Company
Allison Transmission Holdings, Inc. Dover Corporation
BorgWarner Inc. Honeywell International Inc.
Bosch Hydraulics Illinois Tool Works Inc.
Danfoss Power Solutions Ingersoll-Rand Plc
Cummins Inc. United Technologies Corporation
Emerson Electric Co.
Federal-Mogul Holdings Corporation
Hubbell Incorporated
Legrand SA
Moog Inc.
Parker-Hannifin Corporation
Rockwell Automation Inc.
Scheider Electric SE
Siemens Aktiengesellschaft
Woodward, Inc.
Source: Corporate data
Figure 12 – Forecasted U.S. industry output growth (Inflation-adjusted percent change)
Source: MAPI Foundation – February 2017 -4
-2 0 2 4 6 8
2015 2016
2017F 2018F 2019F 2020F
Electrical equipment, appliances and components
Aerospace products and parts
Motor vehicles and parts
Figure 13 –Porter’s five forces
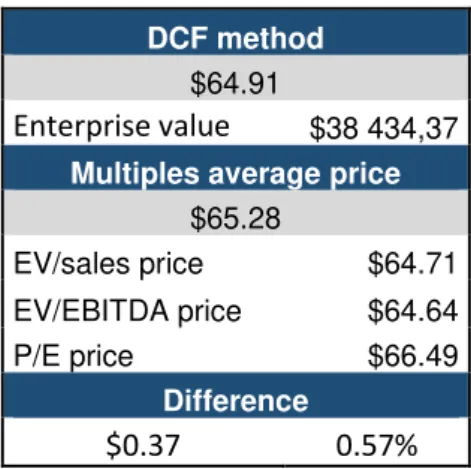
Our recommendation stands for sell with a Target price of $64.91 using the Discounted Cash Flow Method and $65.28 using the Multiples. From both methods, we get the conclusion that Eaton is currently overvaulted (Table 14 and Figure 16).
A downside of 13% is reached with DCF method and of 12.5% with the Multiples method.
Figure 14 – Target prices vs current price
Source: Author
Eaton actuates in the Industrials sector and has a diversified portfolio of products and services, but works mainly in the electrical industry.
Valuation
In our valuation, an absolute and a relative method were used. The absolute was the DCF method and the relative was the Market Multiples. This are two of the most important models when evaluating a company or investment.
Risks
Companies, such as Eaton, that actuate in a large variety of countries are very exposed to the volatility of its end markets. The countries may suffer from economic problems, war, supplies shortage or human resources shortage. This is a very difficult situation to predict and prevent.
To access the investment risk the Sensitivity Analysis was used (Table 15 ad Appendix J-3). To compute this analysis four variables were used, the WACC, the terminal growth rate and the market risk premium.
59 61 63 65 67 69 71 73 75
DCF Average multiples
Sell
5.
Investment Summary
Table 14 – Valuation summaryDCF method $64.91
Enterprise value
$38 434,37 Multiples average price$65.28
EV/sales price $64.71 EV/EBITDA price $64.64
P/E price $66.49
Difference
$0.37
0.57%
Source: Author
Sell
Table 15 – Effects of changing WACC in price
Change in WACC
$64.91 8.00% 8.50% 9.00% 9.61% 10.00% 10.50% 11.00% Price 80.08 74.55 69.82 64.91 62.13 58.97 56.15 Change 23.37% 14.85% 7.56% 0.00% -4.28% -9.15% -13.50% Source: Author
Two different models were used in order to make Eaton’s valuation, an absolute model and a relative model.
Discounted Cash Flow approach was used as the absolute model and the Multiples valuation was used as the relative model (Appendix J).
Forecast
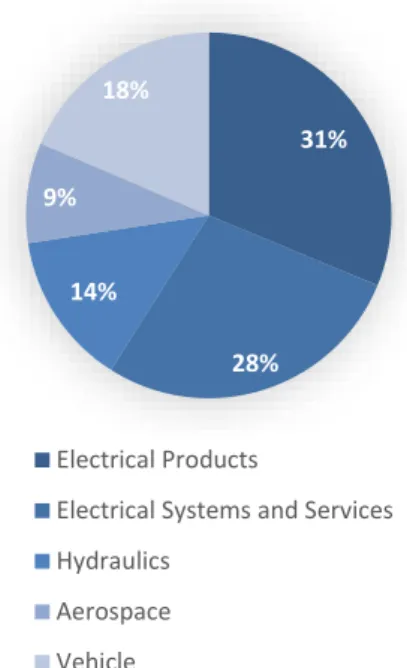
Net sales are forecasted to grow over the next years since it is expected a recovery of the economy and an increase of the purchase power of consumers. Each of Eaton’s business segments are expected to maintain a constant weight on total net sales over the next five years - Figure 17.
Cost of products sold (CPS) are forecasted as a percentage of net sales, but at a decreasing rate (Figure 18). Over the next five years, the weight of CPS on net sales is going to decrease mainly due to the restructuring plan that Eaton is undertaking.
Selling and administrative expenses (SAE) and Research and Development (R&D) are two of the most important expenses for Eaton. Over the last five years they had on average accounted for 17.45% (SAE) and 2.89% (R&D) of total net sales. We have considered that these costs will keep the same weight on sales over the next five years, since more sales will represent more SAE and more income to spend in R&D (Figure 19).
A negative change is forecasted to Net Working Capital (NWC), since current assets are expected to be higher than current liabilities (Table 16).
Table 16 –Changes in NWC
NWC 2016 2017F 2018F 2019F 2020F 2021F Current assets 6195 6276 6477 6665 6916 7177 Change current assets 81 201 188 251 260 Current liabilities 3919 4126 4235 4338 4461 4586 Change current
liabilities 207 108 104 123 125
Total change in NWC 126 -93 -84 -129 -136 Source: Corporate data & Author
Long-term debt is forecasted in Appendix D.
Discounted Cash Flow (DCF) method
The DCF method uses future Free Cash Flow to the Firm (FCFF) projections and discounts them to estimate the present value.
𝐹𝐶𝐹𝐹 = 𝐸𝐵𝐼𝑇(1 − 𝑀𝑎𝑟𝑔𝑖𝑛𝑎𝑙 𝑡𝑎𝑥 𝑟𝑎𝑡𝑒) + 𝐷&𝐴 − 𝑁𝑒𝑡 𝑖𝑛𝑐𝑟𝑒𝑎𝑠𝑒 𝑁𝑊𝐶 − 𝐶𝐴𝑃𝐸𝑋
6.
Valuation
Figure 15 – Average weight of each segment on Eaton’s net salesSource: Corporate data & Author
31% 28% 14% 9% 18% Electrical Products
Electrical Systems and Services
Hydraulics
Aerospace
Vehicle
Figure 17 – SAR and R&D costs
Source: Corporate data & Author 0 1000 2000 3000 4000 5000
2017F 2018F 2019F 2020F 2021F
SAE R&D
Figure 16 – CPS as a percentage of Net sales
Source: Corporate data & Author 60%
65% 70% 75%
The applied discount rate was the Weighted Average Cost of Capital (WACC). In this rate, the time value of money and the risks associated with the company’s industry are taken in consideration. (Table 18)
𝑊𝐴𝐶𝐶 = 𝑊𝐸× 𝐾𝐸+ 𝑊𝐷× 𝐾𝐷× (1 − 𝑡𝑐)
With,
𝐾𝐸= 𝑅𝐹𝑅 + 𝛽 × 𝑀𝑅𝑃
Table 18 – WACC assumptions
Assumption Description
Risk-free rate (RFR) 2.91% U.S.Treasury bonds 30 year yield - Source Bloomberg May 2017
Country risk premium (CRP) - USA
0.00% Calculations from Aswath Damodaran in January 2017
Market risk premium
(MRP) 5.69%
Calculations from Aswath Damodaran in January 2017
Beta unlevered 1.26 Based on Reuters 25/05/17
Beta levered 2.18
Cost of debt 4.05%
Calculations from Aswath Damodaran in January 2017 for the Electrical Equipment industry
Terminal growth rate 2.00% Based on the forecasted GDP growth rate for USA (Source: Trading Economics). Corporate marginal
tax 25.00% Ireland national statutory rate Capital structure
—
The terminal value of 53.44
%
equity and
46.56% debt is considered.
Over the years the WACC rate has been increasing for Eaton (Figure 20). The terminal WACC value reached was 9.61% (Table 17).
To compute the necessary Levered Beta, the following formula was used:
𝛽𝐿= 𝛽𝑈× [1 + 𝐷 𝐸⁄ × (1 + 𝑡)]
After all computations, an Enterprise Value (EV) of $38 434.37 was reached and a target price of $64.91.
Enterprise Value Terminal Value $40 330.51 PV of Terminal Value $27 854.58
NPV of FCFF $10 579.78
Enterprise Value $38 434.37
Net Debt $6 490.72
Equity Value $31 943.65
No. Of shares
outstanding 443
Equity value per share $72.13
Large cap discount 10%
Price at the end of 2017 $64.91
Table 17 – WACC computation
Terminal
value
Cost of equity
RFR
2.91%
CRP
0.00%
MRP
5.69%
Beta levered 2.18
Cost of equity
Rf+β(Rm-Rf)+CRP 15.33%
Cost of debt
Cost of debt 4.05%
Marginal tax rate 25.00% After-tax cost of
debt 3.04%
WACC
Wheight of equity 53.44% Wheight of debt 46.56%
WACC 9.61%
Source: Author
Figure 18 – WACC forecast
Relative valuation – Multiples
For valuation purposes, a group of five companies was selected from the peer group selected by Eaton (Appendix L). The criteria used in this selection process were the total revenues, the total assets and R&D expenses (Figure 21).
To compute the final target price for Eaton, three multiples were used: EV/Sales, EV/EBITDA and P/E (Table 19).
With EV/Sales multiple a $64.71 target price was reached with a downside risk of 13%.
For EV/EBITDA we get a $64.64 target price a downside risk of 13%.
Finally, for P/E, we get a target price of $66.49 with a downside risk of 11%.
Table 19 - Multiples
EV/SALES EV/EBITDA P/E PRICE/CF PRICE/BV
Eaton 1.92 11.42 18.93 9.93 1.91
ABB Ltd. 1.65 11.17 19.62 13.70 3.79
Cummins Inc. 1.46 9.78 16.46 12.06 3.45
Emerson Electric Co. 2.48 11.35 22.82 16.63 5.12 Parker-Hannifin Corporation 2.18 13.86 19.96 19.33 4.39 Scheider Electric SE 1.82 11.15 17.75 13.46 1.83
Average
1.92 11.46 19.32 15.04 3.72Source: Reuters & Author
With this method an average target price of $65.28 was reached (Table 20). This supports our previous conclusion that Eaton is currently overvalued and our recommendations stands to sell.
Table 20 – Multiples method output
Average
$65.28
Price on September 12 $74.57
Downside risk
-12.5%
Source: Author
Figure 19 – R&D expenses
Source: Companies data 0
Table 21 –Eaton’s financial ratios
Historical data Forecasted data
2015 2016 2017F 2018F 2019F 2020F 2021F
Liquidity Ratios
Current Ratio 1.43 1.27 1.43 1.52 1.60 1.60 1.67 Quick Ratio 0.93 0.85 0.96 1.02 1.09 1.09 1.14 Cash Ratio 0.10 0.14 0.16 0.17 0.22 0.22 0.27
Profitability
Ratios
Gross Profit
Margin 31.47% 32.14% 32.72% 33.31% 33.89% 34.47% 35.05% EBIT Margin 11.40% 11.95% 12.38% 12.97% 13.55% 14.13% 14.71% Net Profit Margin 9.50% 9.75% 10.15% 10.69% 11.21% 11.74% 12.26% ROE 13.04% 12.92% 13.55% 14.27% 14.85% 15.46% 15.96% ROCE 9.01% 9.46% 10.00% 10.75% 11.40% 12.15% 12.86% EPS 4.26 4.23 4.58 5.14 5.55 6.03 6.54
Solvency Ratios
D/E Ratio 1.04 1.04 0.98 0.92 0.87 0.83 0.78 Equity Multiplier 2.04 2.04 1.98 1.92 1.87 1.83 1.78 Debt ratio 50.86% 50.88% 49.41% 47.85% 46.56% 45.27% 43.72%
Activity ratios
Fixed asset
turnover 5.85 5.74 6.12 5.86 5.65 4.99 4.60 Total asset
turnover 0.67 0.65 0.67 0.69 0.71 0.72 0.73 Source: Corporate data & Author
Over the years, Eaton’s main Revenues driver has been the Electrical Products segment and it is expected to maintain its position. On the other hand, the Aerospace segment is the one with the lowest weight on Eaton’s revenues (Figure 22). The revenues are forecasted to keep an upward trend over the valuation period.
The Cost of products sold are expected to decrease the weigh they have over the revenues due to the restructuring plan that Eaton is undertaking. This decrease combined with the increase in revenues will lead to an increase in the Gross profit margin (Figure 23).
Eaton Liquidity ratios are expected to keep increasing over the valuation period (Table 21). For instance, Eaton’s quick ratio is forecasted to increase from 0.85 in 2016 to 1.14 in 2021. This increase indicates that Eaton’s short -term liquidity it’s increasing and it has a higher ability to meet its short-term obligations, which reduces the risk of refinancing.
The Net profit margin of Eaton has been increasing over the last few years and it’s expected to maintain its trend. This happens mainly due to the increase in revenues and decrease on the weight of the costs over the revenues (Figure 24). The costs will decrease in relative terms because of the restructuring plan that Eaton is undertaking.
7.
Financial Analysis
Figure 20 – Net sales by segment
Source: Corporate data & Author 0 5000 10000 15000 20000 25000 Vehicle Aerospace Hydraulics
Electrical Systems and Services
Electrical Products
Figure 22 – Net profit
Source: Corporate data & Author 0% 2% 4% 6% 8% 10% 12% 14% 0 5 000 10 000 15 000 20 000 25 000 Revenues Costs Net Profit
Net Profit Margin Figure 21 – Gross profit margin
Capital structure is projected to change over the upcoming years (Figure 25). Eaton’s debt is expected to decrease and its equity is expected to increase. The increase in Equity is explained by the company’s good performance and increase in Retained earnings. On the other side, Eaton is going to repay more debt than is going to subscribe.
ROE is forecasted to increase year over year. Even with an increase in Shareholder’s Equity, the increase of Net sales will be sufficient to increase this ratio (Figure 26).
Figure 24 – ROE
Source: Corporate data & Author
Eaton has a strong Dividend policy with four payments to its investors paid on a quarterly basis. The dividends have been increasing every year and are expected to continue with this trend (Figure 27).
0% 2% 4% 6% 8% 10% 12% 14% 16% 18%
0 2000 4000 6000 8000 10000 12000 14000 16000 18000 20000
2012 2013 2014 2015 2016 2017F 2018F 2019F 2020F 2021F
Net Profit Equity ROE
Figure 23 –Eaton’s capital structure
Source: Corporate data & Author
0% 10% 20% 30% 40% 50% 60% 70%
0 5 000 10 000 15 000 20 000 25 000
Debt
Equity
Capital structure
Figure 25 – Yearly cash dividend per ordinary share
Source: Corporate data & Author 0
1 2 3 4
Risks were divided into three categories: Market & Financial risk (MFR), Legal & Regulatory risk (LRR) and Operating risk (OR). Taking in consideration the probability of occurrence of the situation and its impact on Eaton’s operations, a risk matrix was made – Figure 28 and Appendix L.
Market & Financial risk | Macroeconomics (MFR1)
The macroeconomic conditions may have an effect on Eaton’s results, especially the conditions of the main end markets for Eaton’s products. Structural deficits and instability may negatively affect the company’s results and growth.
Market & Financial risk | End market volatility (MFR2)
Eaton operates in a large number of markets and is affected by the economic and political situation of these regions. Future downturns in any of the markets could adversely affect revenues, operating results, and profitability. To minimize the impact of this volatility, the company, has undertaken some measures such as the diversification of the markets and expansion of the geographical regions in which it operates.
Market & Financial risk | Exchange rates fluctuations (MFR3)
Eaton operates globally and it’s subjected to changes in the relative values of currencies, which can have a negative impact on operating results. To reduce the exposure to exchange rates fluctuations, the company uses hedging, especially currency swaps.
Market & Financial risk | Raw materials and components (MFR4)
A shortage in the supply of raw materials could affect the prices that Eaton’s businesses pay and negatively affect the competitive position of their products and services. On the other hand, Eaton’s component suppliers may increase their products prices in result of an increase in the cost of the raw materials they use. Eaton might not be able to increase its products prices for the same amount and both situations could adversely affect Eaton’s operating results.
Market & Financial risk | Rating grade (MFR5)
A decrease in the rating grade may affect Eaton’s ability for getting new financing and make it more difficult to access credit and maintain an appropriate level of liquidity.
Legal & Regulatory risk | Litigation and Environmental regulations (LRR1)
The company may be subjected to litigations at any moment. These situations may have a material adverse effect on Eaton’s businesses and results. Eaton is equally subject to environmental regulations that may increase the costs for the company.
Legal & Regulatory risk | Government regulations and policies (LRR2)
8.
Investment Risks
Figure 26 – Risk matrix
Having a global operation makes Eaton’s more exposed to different government regulations and policies. These include regulations and policies related to tariffs and trade barriers, investments, property ownership rights, taxation, exchange controls, and repatriation of earnings.
Operating risk | Production facilities location (OR1)
Eaton has worldwide operations and for that it needs to have production facilities throughout the world. The Company's manufacturing facilities and operations could be disrupted by a natural disaster, labor strike, war, political unrest, terrorist activity, economic upheaval, or public health concerns. These situations are more probable in certain geographic regions in which Eaton operates. Any disturbance could cause delays in the shipping of products and losses of sales and customers.
Operating risk | R&D (OR2)
To succeed in a competitive environment, Eaton needs to create new products and improve existing ones. These products depend on customers initial and continued acceptance. Some uncertainty may be created, since some of these products may have shortened life cycles and won’t generate enough results for Eaton to continue investing in R&D.
Operating risk | Human Resources (OR3)
To guaranty results of operations and future growth, the company, must be able to attract, develop and retain executives and other skilled personal, especially professionals with experience in the field. However, Eaton cannot be certain that these individuals will continue working in the company. Hire and develop new personal is time consuming and costly. Inability in hiring and development new people may affect operations, for instance, by delaying Eaton’s ability to bring new products to the market.
Operating risk | Intellectual property (OR4)
Appendices
Appendix A: Statement of Financial Position
Historical data
Forecasted data
In millions of U.S. dollars 2015 2016 2017F 2018F 2019F 2020F 2021F
Assets
Current assets
Cash 268 543 600 619 850 882 1145
Short-term investments 177 203 208 213 218 224 229
Accounts receivable - net 3479 3560 3550 3665 3773 3918 4069
Inventory 2323 2254 2336 2412 2483 2578 2678
Deferred income tax — — — — — — —
Prepaid expenses and other
current assets 369 381 390 400 410 420 429
Total current assets 6616 6941 7084 7309 7733 8022 8551
Property, plant and equipment
Land and buildings 2383 2369 2311 2386 2456 2551 2649
Machinery and equipment 5501 5670 5550 5730 5897 6125 6361
Gross property, plant and
equipment 7884 8039 7861 8116 8353 8676 9011
Accumulated depreciation -4319 -4596 -4596 -4596 -4596 -4256 -4030 Net property, plant and
equipment 3565 3443 3265 3520 3757 4420 4981
Other noncurrent assets
Goodwill 13479 13201 12909 12624 12648 12369 12261
Other intangible assets 6014 5514 5139 4942 4594 4477 4143
Deferred income taxes 362 360 309 309 309 309 309
Other assets 960 960 982 1008 1033 1058 1082
Total assets 30996 30419 29688 29712 30075 30655 31327
Liabilities
Current liabilities
Short-term debt 426 14 242 242 242 242 242
Current portion of long-term
debt 242 1552 573 340 241 302 302
Accounts payable 1758 1718 1845 1904 1960 2036 2114
Accrued compensation 366 379 418 418 418 418 418
Other current liabilities 1833 1822 1864 1912 1960 2007 2053
Total current liabilities 4625 5485 4941 4817 4821 5005 5130
Noncurrent liabilities
Long-term debt 7746 6711 6483 6180 5979 5679 5379
Pension liabilities 1586 1659 1659 1659 1659 1659 1659
Other postretirement benefits
liabilities 440 368 309 260 219 184 154
Deferred income taxes 390 321 321 321 321 321 321
Other noncurrent liabilities 978 934 955 980 1005 1029 1053
Total noncurrent liabilities 11140 9993 9728 9400 9182 8872 8566
Ordinary shares (449.4 million outstanding in 2016, 458.8 million in 2015, 467.9 million outstanding in 2014 and
475.1 million in 2013) 5 5 5 5 5 5 5
Capital in excess of par value 11701 11845 11581 11581 11581 11581 11581
Retained earnings 7346 7498 8464 9564 10764 12096 13572
Accumulated other
comprehensive loss -3863 -4448 -5069 -5690 -6311 -6932 -7553
Shares held in trust -3 -3 -3 -3 -3 -3 -3
Total Eaton shareholders’
equity 15186 14897 14978 15457 16036 16747 17602
Noncontrolling interests 45 44 41 38 35 32 29
Total equity 15231 14941 15019 15495 16071 16779 17631
Appendix B: Income Statement
Historical data
Forecasted data
In millions of U.S. dollars (except for per share
data) 2015 2016 2017F 2018F 2019F 2020F 2021F
Net sales 20 855 19 747 19 987 20 634 21 238 22 058 22 909
Cost of products sold 14 292 13 400 13 447 13 761 14 041 14 455 14 880
Selling and administrative expense 3 596 3 505 3 488 3 601 3 706 3 849 3 998
Litigation settlements 0 0 0 0 0 0 0
Research and development expense 625 589 578 596 614 637 662
Interest expense - net 232 233 232 239 247 256 266
Other income - net -35 -107 0 0 0 0 0
Income before income taxes 2 145 2 127 2 242 2 437 2 631 2 861 3 104
Income tax expense (benefit) 164 202 213 231 250 272 295
Net income 1 981 1 925 2 029 2 205 2 381 2 589 2 809
Less net income for noncontrolling
interests -2 -3 -3 -3 -3 -3 -3
Net income attributable to Eaton
ordinary shareholders 1 979 1 922 2 026 2 202 2 378 2 586 2 806
Net income per share attributable to
Eaton ordinary shareholders
Diluted 4,23 4,21 4,56 5,11 5,52 6,00 6,51
Basic 4,25 4,22 4,58 5,13 5,54 6,02 6,54
Weighted-average number of ordinary
shares outstanding
Diluted 467 457 444 431 431 431 431
Basic 466 455 443 429 429 429 429
Cash dividends declared per ordinary
share 2.20 2.28 2.40 2.58 2.75 2.93 3.10
Net sales by business segment
Historical data
Forecasted data
In millions of U.S. dollars 2012 2013 2014 2015 2016 2017F 2018F 2019F 2020F 2021F
Net sales
Electrical Products 3 846 7 026 7 254 6 976 6 957 6 248 6 450 6 639 6 895 7 161
Electrical Systems and
Services 3 872 6 430 6 457 5 931 5 662 5 542 5 722 5 889 6 117 6 353
Hydraulics 2 960 2 981 2 975 2 459 2 222 2 714 2 802 2 884 2 996 3 111
Aerospace 1 719 1 774 1 860 1 807 1 753 1 774 1 831 1 885 1 958 2 033
Vehicle 3 914 3 835 4 006 3 682 3 153 3 709 3 829 3 941 4 093 4 251
Appendix C: Cash Flow Statement
Forecasted data
In millions of U.S. dollars 2017F 2018F 2019F 2020F 2021F
Operating activities
Net income
2 029
2 205
2 381
2 589
2 809
Adjustments to reconcile to net cash provided by
operating activities
Depreciation and amortization 867 895 921 957 994
Changes in working capital
126
-93
-84
-129
-136
Other
584
597
613
628
643
Net cash provided by operating activities 3 606 3 605 3 831 4 046 4 311
Investing activities
Capital expenditures for property, plant and equipment -525
-585
-602
-625
-649
Other investments -325 -170 -931 -1 244 -1 179
Net cash (used in) provided by investing activities -850 -755 -1 533 -1 869 -1 828
Financing activities
Payments on borrowings
-936
-936
-936
-936
-936
Cash dividends paid -1 063 -1 106 -1 182 -1 257 -1 333
Exercise of employee stock options
79
79
79
79
79
Repurchase of shares -750
-838
0
0
0
Other - net
-13
-13
-13
-13
-13
Net cash used in financing activities -2 683 -2 814 -2 052 -2 127 -2 203
Effect of currency on cash
-16.8
-16.8
-16.8
-16.8
-16.8
Total increase (decrease) in cash 57 20 230 33 263
Cash at the beginning of the period
543
600
619
850
882
Appendix D: Long-term debt
Historical data
Forecasted data
In millions of U.S. dollars 2014 2015 2016 2017F 2018F 2019F 2020F 2021F
5.45% debentures due 2015 300
4.65% notes due 2015 100
0.95% senior notes due 2015 600 2.375% debentures due 2016 240 240 5.30% notes due 2017 ($150 converted to
floating rate by interest rate swap) 250 250 250 6.10% debentures due 2017 289 289 289
1.50% senior notes due 2017 ($750 converted to
floating rate by interest rate swap) 1000 1000 1000 5.60% notes due 2018 ($415 converted to
floating rate by interest rate swap 450 450 450 450 4.215% Japanese Yen notes due 2018 84 83 86 86 6.95% notes due 2019 ($300 converted to
floating rate by interest rate swap) 300 300 300 300 300
3.875% debentures due 2020 ($150 converted
to floating rate by interest rate swap) 239 239 239 239 239 239 3.47% notes due 2021 ($275 converted to
floating rate by interest rate swap) 300 300 300 300 300 300 300 8.10% debentures due 2022 100 100 100 100 100 100 100 100
2.75% senior notes due 2022 ($1,350 converted
to floating rate by interest rate swap) 1600 1600 1600 1600 1600 1600 1600 1600 3.68% notes due 2023 ($200 converted to
floating rate by interest rate swap) 300 300 300 300 300 300 300 300 0.75% euro notes due 2024 580 580 580 580 580 580 6.50% debentures due 2025 145 145 145 145 145 145 145 145
7.65% debentures due 2029 ($50 converted to
floating rate by interest rate swap) 200 200 200 200 200 200 200 200 4.00% senior notes due 2032 700 700 700 700 700 700 700 700
5.45% debentures due 2034 ($25 converted to
floating rate by interest rate swap) 136 136 136 136 136 136 136 136 5.80% notes due 2037 240 240 240 240 240 240 240 240 4.15% senior notes due 2042 1000 1000 1000 1000 1000 1000 1000 1000
5.25% to 8.875% notes (maturities ranging from 2018 to 2035, including $50 converted to
floating rate by interest rate swap) 239 239 239 239 239 239 239 239 Other 220 177 109 441 441 441 441 441
Total long-term debt 9032 7988 8263 7056 6520 6220 5981 5681 Less current portion of long-term debt 1008 242 1552 573 340 241 302 302
Appendix E: Common-Size Statement of Financial Position
Historical data
Forecasted data
2015 2016 2017F 2018F 2019F 2020F 2021F
Assets
Current assets
Cash 1% 2% 0% -3% -2% -1% 0%
Short-term investments 1% 1% 1% 1% 1% 1% 1%
Accounts receivable - net 11% 12% 12% 13% 13% 14% 14%
Inventory 7% 7% 8% 9% 9% 9% 9%
Deferred income tax — — — — — — —
Prepaid expenses and other current
assets 1% 1% 1% 1% 1% 1% 1%
Total current assets 21% 23% 21% 21% 22% 24% 25%
Property, plant and equipment
Land and buildings 8% 8% 8% 8% 9% 9% 9%
Machinery and equipment 18% 19% 18% 20% 21% 21% 22%
Gross property, plant and
equipment 25% 26% 26% 29% 30% 30% 31%
Accumulated depreciation -14% -15% -11% -16% -16% -15% -14%
Net property, plant and equipment 12% 11% 15% 13% 13% 15% 17%
Other noncurrent assets
Goodwill 43% 43% 43% 45% 44% 42% 40%
Other intangible assets 19% 18% 17% 17% 16% 14% 13%
Deferred income taxes 1% 1% 1% 1% 1% 1% 1%
Other assets 3% 3% 3% 4% 4% 4% 4%
Total assets 100% 100% 100% 100% 100% 100% 100%
Liabilities
Current liabilities
Short-term debt 1% 0% 0% 0% 0% 0% 0%
Current portion of long-term debt 1% 5% 2% 1% 1% 1% 1%
Accounts payable 6% 6% 6% 7% 7% 7% 7%
Accrued compensation 1% 1% 1% 1% 1% 1% 1%
Other current liabilities 6% 6% 6% 7% 7% 7% 7%
Total current liabilities 15% 18% 16% 16% 16% 16% 16%
Noncurrent liabilities
Long-term debt 25% 22% 21% 20% 19% 18% 16%
Pension liabilities 5% 5% 6% 6% 6% 6% 6%
Other postretirement benefits
liabilities 1% 1% 1% 1% 1% 1% 1%
Deferred income taxes 1% 1% 1% 1% 1% 1% 1%
Other noncurrent liabilities 3% 3% 3% 3% 3% 3% 3%
Total noncurrent liabilities 36% 33% 32% 31% 30% 29% 27%
Shareholders’ equity
Ordinary shares (467.9 million outstanding in 2014 and 475.1 million in 2013) (449.4 million outstanding in 2016
and 458.8 million in 2015) 0% 0% 0% 0% 0% 0% 0%
Capital in excess of par value 38% 39% 41% 42% 42% 42% 42%
Retained earnings 24% 25% 28% 31% 33% 36% 39%
Accumulated other comprehensive
Shares held in trust 0% 0% 0% 0% 0% 0% 0% Total Eaton shareholders’ equity 49% 49% 52% 53% 54% 55% 57%
Noncontrolling interests 0% 0% 0% 0% 0% 0% 0%
Total equity 49% 49% 52% 53% 54% 55% 57%
Appendix F: Common-Size Income Statement
Historical data
Forecasted data
2015 2016 2017F 2018F 2019F 2020F 2021F
Net sales 100% 100% 100% 100% 100% 100% 100%
Cost of products sold 69% 68% 67% 67% 66% 66% 65%
Selling and administrative expense 17% 18% 17% 17% 17% 17% 17%
Litigation settlements 0% 0% 0% 0% 0% 0% 0%
Research and development expense 3% 3% 3% 3% 3% 3% 3%
Interest expense - net 1% 1% 1% 1% 1% 1% 1%
Other income - net 0% -1% 0% 0% 0% 0% 0%
Income before income taxes 10% 11% 11% 12% 12% 13% 14%
Income tax expense (benefit) 1% 1% 1% 1% 1% 1% 1%
Net income 9% 10% 10% 11% 11% 12% 12%
Less net income for noncontrolling
interests 0% 0% 0% 0% 0% 0% 0%
Net income attributable to Eaton
Appendix G: Forecasting Assumptions
G-1: Statement of Financial Position
Balance sheet
Assumption
2017F 2018F 2019F 2020F 2021F
Assets
Cash
3.00%
3.00%
4.00%
4.00%
5.00%
Projected as a percentage of sales and is expected to increase its weight over the years.
Short-term investments
2.30%
2.60%
2.50%
2.40%
2.30%
Projected to be equal to 2016 nominal value and adjusted for inflation. Accounts receivable - net 17.76% 17.76% 17.76% 17.76% 17.76% Projected based on a 5 year historicalaverage as a percentage of sales. Inventory 11.69% 11.69% 11.69% 11.69% 11.69% Projected based on a 5 year historical
average as a percentage of sales. Deferred income tax 0.00% 0.00% 0.00% 0.00% 0.00% Projected to be equal to 2016 nominal
value. Prepaid expenses and
other current assets
2.30%
2.60%
2.50%
2.40%
2.30%
Projected to be equal to 2016 nominal value and adjusted for inflation. Land and buildings 11.56% 11.56% 11.56% 11.56% 11.56% Projected based on a 5 year historical average as a percentage of sales. Machinery and
equipment 27.77% 27.77% 27.77% 27.77% 27.77%
Projected based on a 5 year historical average as a percentage of sales. Accumulated depreciation -20.41% -20.41% -20.41% -20.41% -20.41%
Projected based on a 5 year historical average as a percentage of sales.
Goodwill -2.21% -2.21% 0.19% -2.21% -0.87%
This item includes the value of a company’s brand name, solid customer base, good customer relations, good employee relations and any patents or proprietary technology that result of the acquisition of a company for a premium value. Projected based on a 5 year historical average of its growth rate and taking in consideration new acquisitions in 2019 and 2021.
Other intangible assets -6.80% -3.83% -7.04% -2.55% -7.46%
Projected to be equal to the previous year minus the depreciation of the period and taking in consideration new acquisitions of intangible assets in 2018 and 2020.
Deferred income taxes 0.00% 0.00% 0.00% 0.00% 0.00% Projected to be equal to 2016 nominal value.
Other assets
2.30%
2.60%
2.50%
2.40%
2.30%
Projected to be equal to 2016 nominal value and adjusted for inflation.
Liabilities
Short-term debt 0.00% 0.00% 0.00% 0.00% 0.00% Projected to be equal to 2016 nominal value.
Current portion of long-term debt -63.08% -40.66%
-29.12% 25.31% 0.00%
Projected based on the previsions the company gives for the next 4 years and expected to maintain after that. Accounts payable 9.23% 9.23% 9.23% 9.23% 9.23% Projected based on a 5 year historical average as a percentage of sales.
Accrued compensation 10.29% 0.00% 0.00% 0.00% 0.00%
to maintain this value in the next 5 years.
Other current liabilities
2.30%
2.60%
2.50%
2.40%
2.30%
Projected to be equal to 2016 nominal value and adjusted for inflation. Long-term debt -8.54% -5.54% -4.16% -5.43% -5.75% Project to be equal to the year before
minus the current portion.
Pension liabilities 0.00% 0.00% 0.00% 0.00% 0.00% Projected to be equal to 2016 nominal value.
Other postretirement benefits liabilities
-15.94%
-15.94%
-15.94%
-15.94%
-15.94%
Projected based on a 5 year historical average of its growth rate.
Deferred income taxes 0.00% 0.00% 0.00% 0.00% 0.00% Projected to be equal to 2016 nominal value.
Other noncurrent
liabilities
2.30%
2.60%
2.50%
2.40%
2.30%
Projected to be equal to 2016 nominal value and adjusted for inflation.
Shareholders’ equity
Ordinary shares (467.9 million outstanding in 2014 and 475.1 million in 2013) (449.4 million outstanding in 2016 and 458.8 million in 2015)
0.00% 0.00% 0.00% 0.00% 0.00% Projected to be equal to 2016 nominal value.
Capital in excess of par
value -2.23% 0.00% 0.00% 0.00% 0.00%
Projected to maintain its average value of the last 5 years.
Accumulated other
comprehensive loss 13.96% 12.25% 10.91% 9.84% 8.96%
Projected to decrease by the same amount every year, $621.