#632 | 2019
VLADIMIR OTRACHSHENKO
LUÍS C. NUNES
Fire Takes No Vacation: Impact of Fires on Tourism
Vladimir Otrachshenko
Nova School of Business and Economics, Campus de Carcavelos, Rua da Holanda 1, 2775-405
Carcavelos, Portugal
Corresponding author’s email:
[email protected]
Luis C. Nunes
Nova School of Business and Economics, Campus de Carcavelos, Rua da Holanda 1, 2775-405
Carcavelos, Portugal
July 2019
Abstract
Many Mediterranean-type climates around the world will face increased risks of wildfires as a consequence of climate change. In this study we consider the case of Portugal and estimate the impact of the increasing risk of forest fires on tourism. Using data for 278 municipalities for the 2000-2016 period we find a considerable negative impact of burned areas on the number of tourist arrivals, both domestic and inbound. We go beyond the traditional impact analysis and provide predictions for 2030 and 2050. The estimated costs to the Portuguese economy due to the impact of burned areas in 2030 range between 17.03 and 24.18 million Euros for domestic tourist arrivals and between 18.26 and 38.08 million Euros for inbound ones. In 2050, those costs will increase at least fourfold. These findings underscore the importance of taking the forest fire risks into account when planning local investments.
JEL Code: L83, O13, Q54, Q56
Keywords: Climate change, Economic Development, Fires, Future Projections, Tourism, Portugal
Acknowledgements. Vladimir Otrachshenko acknowledges the research fellowship from
Fundação para a Ciência e a Tecnologia (FCT), Portugal (SFRH/BPD/122946/2016). All opinions
expressed are those of the authors and have not been endorsed by the FCT.
2 1. Introduction
Although forest fires are considered an integral part of many ecosystem dynamics around the world, the severity and the length of the fire season in several areas of the world is expected to increase substantially due to climate change (IPCC, 2014). Higher temperatures will be associated with earlier and dryer springs, while rarer rains will lead to drier and more flammable vegetation (Marques et al., 2011; Yohe and Schlesinger, 2002). As a result, wildfires, droughts, storms, and other natural disruptions will increasingly become major causes of life and property losses globally, present a challenge regarding the sustainability of the ecosystem services provided to society, and increase the likelihood of conflicts (FAO, 2016; Maystadt et al. 2015).
The Mediterranean region is one of the areas in the world most vulnerable to climate change (Santos et al., 2014). The climate of this region is characterized by mild winters and warm, dry summers, but will change as extreme weather events such as droughts, heat waves, fires, and floods become more frequent. In fact, most climate change scenarios forecast an increase in temperature and a decrease in precipitation in the Mediterranean region (García-Ruiz et al., 2011). Greece, Italy, France, Croatia, Spain, and Portugal are already experiencing the consequences of climate change. In these countries the number of wildfires has increased considerably. In fact, about half of the largest fires in Europe in the last decade were in Spain and Portugal, destroying around 90,000 hectares of forest per year (Hoinka et al., 2009).
For many countries in the world the tourism sector is an important driver of economic development, and this is worrisome because this sector is especially vulnerable to increasing risks of forest fires. While the immediate consequences of forest fires are easily visible, namely in the destruction of property values and the direct negative impact on recreation values (Vaux et al., 1984), the computation of the full economic costs associated with lower tourist arrivals in the future is a challenging task. An increased number of fire threats makes the endangered areas less attractive for tourists, which, in turn, leads to a negative impact on local businesses. These may include small, medium, and large scale businesses such
3
as hotels, restaurants, transportation services, and museums, which are important contributors to the local economies (Becken and Hughey, 2013; Seetanah, 2011; Brida and Risso, 2009; Cioccio and Michael, 2007).
In this study we focus on the particular case of Portugal. The tourism sector represents an important portion of GDP and employment (almost 10% each) and climate change scenarios suggest that the severity of forest fires will increase (Marques et al., 2011). The combination of these two factors makes Portugal a valuable case to study. The objective is to estimate the impact of the increasing risk of forest fires on the tourism industry in Portugal.
Using data from 2000 to 2016 on 278 municipalities we estimate the impact of burned areas on the number of inbound and domestic tourists. We go beyond the traditional impact analysis and provide predictions for 2030 and 2050. To the best of our knowledge, there are no reported studies addressing the impact of climate change and fires on tourism at such a fine scale within a country.
We find that burned areas have a considerable negative impact on the number of tourist arrivals. Under the A1B scenario for future burned area projections, results show that in 2030 most municipalities will face a reduction in domestic and inbound tourist arrivals up to 2% and 0.5%, respectively.1 This situation will be aggravated in 2050 when the reduction in domestic and inbound tourist arrivals for most municipalities will range between 2-4% and 0.5-1%, respectively. Overall, the estimated costs to the Portuguese economy due to the impact of increased burned areas in the year 2030 range between 17.03 and 24.18 million Euros for domestic tourist arrivals and between 18.26 and 38.08 million Euros for inbound tourist arrivals, depending on the assumptions made about overall growth of the tourism sector. In 2050, those costs will increase by a factor of at least four.
1 The A1B scenario is based on rapid economic growth, low population growth and rapid introduction of new and
4
This paper is organized as follows. The next section reviews the literature. Then, the methodology and data sections are presented. We then present the estimation results. The final section offers conclusions and discusses the avenues for future research.
2. Case Study
Continental Portugal is located between 37°N and 42°N latitude and 6°W and 10°W longitude in the Iberian Peninsula, which is the south-western corner of Europe. Portugal shares the border with Spain on its Eastern side and has the Atlantic Ocean on the West. The capital city of Portugal is Lisbon and the second largest city is Porto. The country also includes the archipelagos of the Azores and Madeira in the Atlantic Ocean. Based on the census of 2011, the population of Portugal was about 10.5 million inhabitants. The area covers 92,212 km2. The average annual temperature ranges between 7°C and 18°C and the amount of rainfall is between 400mm and 2,000mm. Regarding vegetation, one third of Portugal is covered by forests and woodlands and one quarter by shrubs (see Marques et al., 2011).
Portugal is a country with a long history, starting as an independent state in the beginning of the twelfth century. Currently it has 15 UNESCO World Heritage Sites2, ranking Portugal in this regard 17th in the world, out of 167 countries. Given the appeal and cultural diversity of the country, Portugal attracts many tourists from around the world, and the tourism industry is an important pillar of the Portuguese economy. In 2016 tourism in Portugal directly contributed 9.2% of GDP and 9% of the total employment, generating a total of 12.7 billion Euros in international tourism revenues. This is the second highest place as percentage of GDP among the OECD countries, just after Spain (OECD, 2018). Also, tourism is the largest export industry, constituting 16.7% and 48.3% of total exports and service exports, respectively.
Changes in climate became evident in Portugal as early as the end of the nineteenth century (Carvalho et al. 2014). Since then the annual precipitation has been falling while the annual temperature has been
5
increasing. Moreover, temperature in Portugal is above the global mean and heat waves have become more frequent and pronounced. As a result, weather conditions and fuel loading are today the main causes of forest fires in Portugal (Hoinka et al. 2009). In the last decades forest fire severity has increased and climate change scenarios suggest that this trend will continue (Marques et al., 2011).3
3. Literature Review
The incidence of forest fires has increased in the Mediterranean region.4 A number of studies show that forest fires in Portugal can be explained by changes in weather conditions such as the number of days with extreme fire hazard weather (Viegas and Viegas 1994; Pereira et al. 2005; Gomes and Radovanovic 2008). This is also supported by Pereira et al. (2005) who state that two thirds of fires in Portugal are due to changes in weather conditions. As stated by Marques et al. (2011), the burned area reached about 40% of Portugal in the 1975-2007 period. Gomes (2006) also highlights that wildfires affect much of the territory in Portugal, leading to substantial economic, social, and environmental impacts. However, determining the resulting total economic loss and the impacts on local economies is a challenging task.
A growing body of literature presents evidence on the consequences of fire for the tourism industry. Yet, to the best of our knowledge, all of them are case studies. For instance, the 2003 summer in Canada was dry and hot, leading to about 2,500 forest fires. The estimated costs of those fires in terms of property losses and costs of fighting amounted to about 700 million Canadian dollars (Hystad and Keller, 2006).
Hystad and Keller (2006) conduct an interview of businesses related to tourism in the region of Kelowna in British Colombia, Canada, where the largest fire occurred in 2003. They find that the tourism industry experienced considerable losses in the subsequent months. In the follow-up study, Hystad and Keller (2008) explore the long-term impact of this fire. They find that in 2004 about 20% of businesses were still
3 The year of 2017 was one of the most tragic in Portugal, when forest fires killed 64 people in June and 31 people
in October. In addition, many people were injured (CBS NEWS, October 16, 2017). See also
https://www.cbsnews.com/news/portugal-spain-galicia-wildfire-deaths-mount/.
6
experiencing the negative impact, while in 2005 it was still about 5%. This emphasizes that fires may have a long-lasting impact on local businesses.
In 2003, bushfires greatly damaged the regional tourism industry in Victoria, Australia, where some tourist operators lost their livelihoods and others had to close their businesses (Cioccio and Michael, 2007). Over three months about 1.1 million hectares of National Park lands were burned. In the face to such a threat, many tourists left the region or postponed their visits. This led to the loss of 20 million US dollars during the first month alone and affected more than 1,000 tourism businesses.
Rahn (2009) reviews wildfire history from 1978 to 2002 in California, in the US. The author points out that in order to estimate the economic loss five indicators – state (i.e. costs of suppression), infrastructure (i.e. replacement costs), natural areas (i.e. species, habitats, and ecosystem services), community (i.e. lives, health, homes, and quality of life), and businesses – have to be considered. The last indicator is used to estimate the impact of fires on economic activity (i.e. employees do not work during those days, costs related to shipping and distribution, air transportation), employment impacts (i.e. businesses may incur costs related to unemployment insurance claims), building and property loss (i.e. buildings, materials, and equipment might be lost or damaged), tourism impacts (i.e. diminished visitors’ spending). Overall, the share of business activity loss is only one third of the total.
Kountouris and Remoundu (2011) explore the relationship between the individual life satisfaction and fires in Spain, France, Italy, and Portugal. The authors find that burned areas as well as large and medium scale fire incidents substantially decrease the life satisfaction of individuals. Maida et al. (1989) and Kountouris and Remoundu (2011) explain this negative relationship by the consequences of fires on psychological disorders (i.e. depression, sleep disorders, etc.) and, in extreme cases, with losses of life.
Thapa et al. (2013) explore the impact of wildfires on tourists’ behavior in Florida, US. The authors find that 25% of tourists in their sample are willing to cancel a trip in the presence of wildfires and 42% are
7
most likely to cancel. The authors point out that wildfires negatively affect residential communities and the tourism industry. The lodging sector experienced 61 million USD losses and other sectors lost about 77 million USD due to the historic fire in Florida in 1998 (Butry et al. 2001).
There are a number of studies on the impact of fires on recreational demand. For instance, Boxall and Englin (2008) examine the impact of forest fires on recreational activity such as canoeing in the Canadian Shield region. The authors find a negative impact on the number of canoe trips in this area in the first years following a fire. Hilger and Englin (2009) confirm this finding, exploring the impact of the 40,000 acre Rat Creek Hatchery forest fire on the recreational demand within the Alpine Lakes Wilderness Area.
Hesseln et al. (2004) also find that forest fires decrease hiking demand at National Forests in Colorado and Montana. On the other hand, Loomis et al. (2001) find that forest fires increase the post-fire hiking demand and decrease mountain biking demand at National Forests in Colorado. This controversial effect is due to the fact that bikers need to dismount and carry their bikes over large logs which is not an issue for hikers. Note that Hilger and Englin (2009) also point out that post-fire recreational demand may, in fact, increase. However, the authors highlight that this increase occurs if the post-fire ecosystem recovers and there are no frequently repeated fires.
4. Econometric Model
In this section we present the models to estimate the relationship between (i) burned areas and the number of tourist arrivals in a particular municipality and (ii) temperature, precipitation, and burned areas.
Due to data confidentiality, the Portuguese statistical office5 presents the number of tourist arrivals only for those municipalities that have more than three hotels. Thus, using only these data in the analysis
8
creates a sample selection problem since the information on some municipalities is non-randomly missing. Ignoring this problem would bias the estimates and might lead to incorrect conclusions. To cope with this issue, we apply the Heckman’s sample selection model (Heckman, 1979). The estimation method consists of two steps. In the first, we estimate the selection equation with a binary dependent variable that equals one when the number of tourist arrivals is observed in a particular municipality and year and zero when it is missing. This equation includes as an independent variable the number of hotels in a particular municipality and the year that is the one causing the selection problem. The complete selection equation to be estimated is a probit model with fixed effects as suggested by Fernández-Val and Weidner (2016). This equation can be written as follows:
𝑍𝑖𝑡 = 𝛿0+ 𝛿1𝐻𝑜𝑡𝑒𝑙𝑠𝑖𝑡+ 𝚿′𝑋𝑖𝑡+ 𝜇𝑖+ 𝜔𝑡+ 𝜗𝑖𝑡 (1)
where the subscripts i and t stand for a municipality and year, respectively. 𝑍𝑖𝑡 is a binary variable and
equals one if the number of tourist arrivals is observed in a particular municipality i and year t. 𝐻𝑜𝑡𝑒𝑙𝑠𝑖𝑡
is the number of hotels. 𝑋𝑖𝑡 is a vector of explanatory variables including the share of burned area in the
current and past year, population density, and crime rate.6 The terms 𝜇
𝑖 and 𝜔𝑡 are municipality and time
fixed effects, respectively, 𝜗𝑖𝑡 is the error term, and 𝛿0, 𝛿1, and 𝚿 are parameters to be estimated.
Using the estimated probit model, we compute the following ratio for each municipality and year:
𝐿𝑎𝑚𝑏𝑑𝑎𝑖𝑡 =𝜙(𝑍̂ )𝑖𝑡
𝛷(𝑍̂ )𝑖𝑡 (2)
where 𝜙(·) and 𝛷(·) are the Normal probability density and cumulative distribution functions, respectively. 𝐿𝑎𝑚𝑏𝑑𝑎𝑖𝑡 is also known as the inverse Mill’s ratio.
In the second step we estimate the main equation, in which 𝐿𝑎𝑚𝑏𝑑𝑎𝑖𝑡 is included as an additional
regressor to correct the selection problem. For this case, we adopt a panel linear regression model with
9
fixed-effects as suggested by Vogelsang (2012). This model is robust to heteroskedasticity, autocorrelation, and spatial correlation. The equation is as follows:
ln (𝐴𝑟𝑟𝑖𝑣𝑎𝑙𝑠𝑖𝑡) = 𝛽0+ 𝛽1ln (𝐴𝑟𝑟𝑖𝑣𝑎𝑙𝑠𝑖𝑡−1) + 𝛽2𝐿𝑎𝑚𝑏𝑑𝑎𝑖𝑡+ +𝛽3𝑃𝑜𝑝𝑑𝑒𝑛𝑖𝑡+ 𝛽4𝐶𝑟𝑖𝑚𝑒𝑖𝑡+ 𝛽5𝐵𝑢𝑟𝑛𝑒𝑑 𝐴𝑟𝑒𝑎𝑖𝑡+ 𝛽6𝐵𝑢𝑟𝑛𝑒𝑑 𝐴𝑟𝑒𝑎𝑖𝑡−1+
+𝜃𝑖𝑡 + 𝛾𝑖+ 𝜇𝑡+ 𝑒𝑖𝑡 (3)
where 𝐴𝑟𝑟𝑖𝑣𝑎𝑙𝑠𝑖𝑡 stands for the number of tourist arrivals. The lagged dependent variable captures habit
persistence or “word of mouth”. That is, when people visited a site and liked it, they may revisit it or spread information about the site and recommend it to friends and relatives (Witt and Witt, 1995). 𝑃𝑜𝑝𝑑𝑒𝑛𝑖𝑡 and 𝐶𝑟𝑖𝑚𝑒𝑖𝑡 stand for population density and crime rate, respectively. As Hamilton (2003) and
Onofri and Nunes (2013) point out, these variables represent the economic development of a region. 𝐵𝑢𝑟𝑛𝑒𝑑 𝐴𝑟𝑒𝑎𝑖𝑡 and its lag stand for the share of burned area that includes burned forest and shrub.7 It might be the case that the trends in tourism and economic outcomes in certain municipalities correlate with burned areas. Thus, to control for this over the period studied, we introduce municipality-specific trends, 𝜃𝑖𝑡, where 𝜃𝑖 are municipality specific trend-slopes and 𝑡 is the linear time trend. This
municipality-specific trend may affect the outcome of interest and might correlate with burned areas. For instance, Otrachshenko et al. (2017) include the regional time trend when estimating the relationship between temperature and mortality in Russia, and Deschênes and Greenstone (2011) include state-year effects when estimating the same relationship for the US.
The terms 𝛾𝑖 and 𝜇𝑡 are the municipality and time fixed effects, respectively. The municipality fixed effects
control for time invariant unobserved regional characteristics that may affect the number of arrivals (i.e. landscape, the area of a municipality, infrastructure, the presence of coastline, the number of cultural heritage attractions, etc.). The time fixed effects control for any common changes across municipalities.
10
For instance, the tourism boom experienced during the 2003–2007 period or the financial crisis in 2008 (Witt and Witt, 1995; Otrachshenko and Bosello, 2017). Finally, 𝑒𝑖𝑡 is the error term.
In order to make predictions for the number of tourist arrivals that will be affected by burned areas in 2030 and 2050, we estimate the relationship between weather conditions and burned areas. We use a panel data model with fixed effects as described by the following equation:8
𝐵𝑢𝑟𝑛𝑒𝑑 𝐴𝑟𝑒𝑎𝑖𝑡 = 𝛼0+ 𝛼1𝑇𝑒𝑚𝑝𝑖𝑡+ 𝛼2𝑃𝑟𝑒𝑐𝑖𝑝𝑖𝑡+ 𝜃𝑖𝑡 + 𝜕𝑖+ 𝜌𝑡+ 𝜀𝑖𝑡 (4)
where 𝑇𝑒𝑚𝑝𝑖𝑡 and 𝑃𝑟𝑒𝑐𝑖𝑝𝑖𝑡 represent the average temperature in Celsius (°C) and amount of
precipitation in millimeters (mm) during the third quarter (July-September), the period when fires are most frequent in Portugal. All other explanatory variables have the same explanation as above.
5. Data
In this study we use data on the number of tourist arrivals, the share of burned areas, population density, and crime rate in 278 municipalities from Statistics Portugal (INE) from 2000 to 2016 (INE, 2018). The data on the number of inbound and domestic tourists account for arrivals at different types of establishments such as hotels, hostels, pensions, and others. Burned areas include forest and shrub lands. Population density is the number of people per km2.Crime rate is the number of crimes per 1,000 inhabitants.
The weather data are taken from the National Water Resources Information System (SNIRH, 2019). This database includes about 790 ground stations located across Portugal. Temperature and the amount of rainfall are measured in Celsius (°C) and millimeters (mm), respectively.
6. Estimation Results
In this section we present and discuss estimation results. The section is divided into three parts. In the first, we show the results on the impact of burned areas on the number of domestic and inbound tourist
8 For a detailed discussion regarding modeling the relationship between weather conditions and outcome of
11
arrivals for each municipality. Then the impact of temperature and precipitation on the share of burned areas and its future projections in 2030 and 2050 are presented. Finally, we compute losses in terms of the number of domestic and inbound tourist arrivals due to the future projected burned areas.
6.1. Impact of Burned Areas on Tourism
Table 1 presents the results of the impact of burned areas on the number of tourist arrivals. As shown, the lag of the dependent variable is significant in all equations, suggesting the strong effect of a “word of mouth”. That is, tourists may spread information about the place visited to others. Also, tourists who have visited a particular place and liked it, may visit it again in the next period. It is estimated that, ceteris paribus, a 1% increase in visitors in the current year contributes on average to a future increase in domestic and inbound tourist arrivals by 0.29 % and 0.25%, respectively.
The estimated coefficient on 𝐿𝑎𝑚𝑏𝑑𝑎𝑖𝑡 is significant in all equations, indicating that the correction in the
presence of non-random missing values is required. In fact, the coefficients estimated on the main explanatory variables are larger without the Heckman procedure for both domestic and inbound arrivals, indicating the presence of upward biases. The coefficients on population density (𝑃𝑜𝑝𝑑𝑒𝑛𝑖𝑡) and crime
rate (𝐶𝑟𝑖𝑚𝑒𝑖𝑡) have an expected sign but they are either marginally or not statistically significant.
The sign and significance of the coefficients on the burned areas of the previous and current periods suggest a considerable impact on the number of domestic and inbound tourist arrivals. Overall, a 1% increase in burned areas in a given year reduces the number of domestic and inbound tourist arrivals in that year and in the following year by 3.53% and 1.12%, respectively.9 Interestingly, the impact of burned areas is quite persistent in all estimated models: the current impact constitutes less than half of the total cumulative impact. This confirms that fires may be associated with psychological disorders (i.e.
9 The computation of the impact of one percentage point of Burned Areas on the number of arrivals in that same
year and in the following year is as follows. For domestic tourist arrivals, it equals (1.66341.6634*0.29201.3848)×0.01×100 = 3.53, while for inbound tourist arrivals, it equals (0.41990.4199*0.25190.5969)×0.01×100 = 1.12.
12
depression, sleep disorders, etc.) and the likelihood of losing life. People who have visited a place and faced such a threat might not want to visit this place in the subsequent period. This finding is of particular interest to policy makers since it suggests that the current period burned areas also affect the future number of visitors. As a result, government and local businesses should not ignore this risk in management and investment decisions.
Table 1: Impact of Burned Areas on the Number of Tourist Arrivals
Dependent Variable: Domestic Inbound
ln (𝐴𝑟𝑟𝑖𝑣𝑎𝑙𝑠𝑖𝑡) Coef. S.E. Coef. S.E. ln (𝐴𝑟𝑟𝑖𝑣𝑎𝑙𝑠𝑖𝑡−1) 0.2920 * 0.1422 0.2519 ** 0.0676 𝐿𝑎𝑚𝑏𝑑𝑎𝑖𝑡 -5.9393 *** 1.2806 -3.9751 ** 0.9831 𝑃𝑜𝑝𝑑𝑒𝑛𝑖𝑡 0.0005 ** 0.0001 0.0001 0.0001 𝐶𝑟𝑖𝑚𝑒𝑖𝑡 -0.0038 0.0026 -0.0025 0.0019 𝐵𝑢𝑟𝑛𝑡 𝐴𝑟𝑒𝑎𝑖𝑡 -1.6634 ** 0.4974 -0.4199 * 0.1966 𝐵𝑢𝑟𝑛𝑡 𝐴𝑟𝑒𝑎𝑖𝑡−1 -1.3848 ** 0.3883 -0.5969 *** 0.1373
Time F.E. Yes Yes
Municipality F.E. Yes Yes
Municipality Trend Yes Yes
Nr. Of Obs. 2,173 1,703
R-sq. 0.90 0.74
Notes: ***, **, and * stand for 1%, 5%, and 10% significance levels, respectively. Coef.
and S.E. stand for the estimated coefficients and for standard errors, respectively. Standard errors are robust to heteroskedasticity, autocorrelation, and spatial correlation. F.E. stands for fixed effects. Lambda is the Mill’s inverse ratio from (2).
6.2. Burned Areas and Weather Conditions
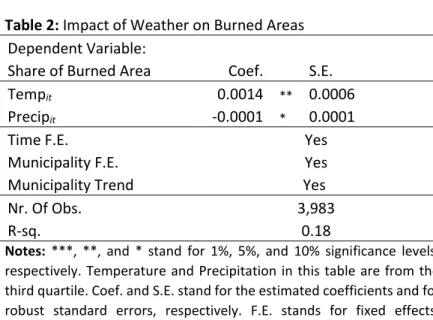
As discussed in the previous section, the many burned areas in Portugal are largely due to changes in weather conditions. Table 2 presents the impact of temperature and precipitation in the third quarter on the annual share of burned areas. As shown, both estimates on temperature and precipitation are statistically significant. If temperature increases by 1°C during the third quarter of the year, the share of burned areas increases by 0.14%. Regarding the precipitation variable, we find that the reduction in the amount of rainfall by 10mm increases the share of burned areas by 0.1%. These weather factors
13
contribute to an additional 12,909 and 9,921 hectares burned, respectively, which in total represent approximately 20% of the average annual burned area in Portugal.10
Table 2: Impact of Weather on Burned Areas
Dependent Variable:
Share of Burned Area Coef. S.E.
Tempit 0.0014 ** 0.0006
Precipit -0.0001 * 0.0001
Time F.E. Yes
Municipality F.E. Yes
Municipality Trend Yes
Nr. Of Obs. 3,983
R-sq. 0.18
Notes: ***, **, and * stand for 1%, 5%, and 10% significance levels,
respectively. Temperature and Precipitation in this table are from the third quartile. Coef. and S.E. stand for the estimated coefficients and for robust standard errors, respectively. F.E. stands for fixed effects. Lambda is the Mill’s inverse ratio from (2).
Next we compute the share of burned areas for each municipality in 2030 and 2050. The future projection values of temperature and precipitation for each municipality are taken from the study by Palma (2017). The resolution of data is 12 km. These data are based on the A1B scenario, which corresponds to rapid economic growth, population peak in 2050 and decline thereafter, the introduction of new and efficient technology, and substantial reduction in regional differences in per capita income (see IPCC, 2000). This scenario is the one most likely for Portugal (Palma, 2017). Note that the results on future projections in all figures are interpreted with respect to the average temperature and precipitation of the period studied.
As shown in Figure 1, each municipality is highlighted by one of four colors. White corresponds to the case when the share of burned areas decreases while the red with different shades corresponds to the opposite case. The shades of red stand for the following ranges of reduction: 0-0.5%, 0.5-1%, and 1-1.32%.
14
Figure 1a shows that the majority of municipalities will face a 0-0.5% increase in burned areas and a few will face a 1-1.32% increase in 2030. The situation will be exaggerated in 2050. As shown in Figure 2a, there is a substantial increase in the number of municipalities facing a 1-1.32% rise in burned areas. The majority of municipalities will be in the range of 0.5-1% increase in burned areas. In both years, several inland municipalities close to Spain are among the ones suffering the most.
Figure 1: Estimated Increase in the share of Burned Areas in 2030 and 2050
Note: Results are based on the A1B scenario and are interpreted with respect to the average temperature and
precipitation of the period studied.
We also estimate equation (4) using the annual average values of temperature and precipitation.11 However, when comparing the annual weather data from one period to another, one might find no
15
substantial difference over the years even though a tremendous difference might occur in terms of the corresponding quarterly data. This happens because the amount of rainfall might be offset during the first and/or fourth quarter of the year, smoothing the average annual values.
Note that modeling the relationship between burned area and weather conditions can be more complex than in equation (4). We also included the speed of wind. However, the sign of the estimate on wind does not make sense. This may happen because we are not able to control for the direction of the wind. We therefore decided to exclude this variable from our analysis. Nevertheless, our results related to the burned area in equation (4) are similar to those of Le Page et al. (2015, p. 897). Using a global fire model, Le Page et al. (2015) show the relationship between fires and weather conditions for the world, including Portugal.
6.3. Losses due to the Burned Area Projections for the future
We next estimate the future cost for the tourism sector due to the increase in burned areas. In order to simplify the exposure of our results for each municipality, we present them in figures. In Figures 2a and 2b the impacts of the burned area projections on domestic tourist arrivals in 2030 and in 2050 are presented, respectively.
In Figure 2a, 10 municipalities out of 278 are in white. Those municipalities benefit from climate change in 2030 while in 2050 only half of them continue to benefit.12 193 municipalities, 74 municipalities, and 1 municipality will face the reduction in domestic tourist arrivals in the 0-2%, 2-4%, and above 4% range, respectively. One municipality in the south of Portugal will face the largest reduction in the domestic tourist arrivals in 2030. In 2050 the situation will worsen. While the number of municipalities that will face reductions in the domestic tourist arrivals in the 0-2% range will fall to 52, in the ranges between 2-4%
12 In fact, in 2030 the largest benefit in those municipalities is 1.086 percentage points and the smallest is 0.10
percentage points, while the mean is 0.47 percentage points. In 2050, the largest, smallest, and mean benefits are 0.816, 0.05, and 0.26, respectively.
16
and above 4% their number will increase tremendously, to 215 and 6 municipalities, respectively. Considerable changes will also occur in the north of Portugal, in the Porto metropolitan area, including the city of Porto, and in the Lisbon metropolitan area, where many municipalities shift from the 0-2% range to the 2-4% range. These areas are very popular tourist destinations and currently are the objects of several tourism development programs. Therefore, those metropolitan areas require special attention from government and businesses.
Figure 2: Impact of Future Burned Area Projections on Domestic Tourist Arrivals
Note: Results are based on A1B scenario and are interpreted with respect to the average temperature and
precipitation of the period studied.
Next we estimate the impact of the burned area projections on the number of inbound tourist arrivals. As shown in Figure 3a, the impact on municipalities in 2030 and 2050 ranges between -0.35-0%, 0-0.5%, 0.5-1%, and 1-1.48%. The impact of the burned area projections on most municipalities is between 0-0.5%
17
(i.e. 135 municipalities), following the range between 0.5-1% (i.e. 125 municipalities), and only 6 municipalities are in the range above 1%.
In 2050 the number of municipalities affected in the range between 0.5-1% is almost double (194 municipalities) and its number becomes ten times larger (61 municipalities) in the range above 1%. Note that based on our projections, 10 municipalities will benefit due to weather condition changes in 2030 and only 5 will in 2050. As with domestic tourist arrivals, the greatest impact occurs in part in the Porto metropolitan area. Also, several municipalities close to Spain are among those that are most affected. Figure 3: Impact of Burned Area Projections on Inbound Tourist Arrivals
Note: Results are based on A1B scenario and are interpreted with respect to the average temperature and
precipitation of the period studied.
18
The first scenario is entitled “Realistic” and corresponds to 2.6 % and 5.7% annual growth rates in the overall number of domestic and inbound tourist arrivals, respectively. The second scenario is entitled “Optimistic” and corresponds to overall 5.2 % and 11.4% annual growth rates in the number of domestic and inbound tourist arrivals, respectively. The annual growth rate for the “Optimistic” scenario is taken from the OECD report on tourism (OECD, 2018) while the annual growth rate for the realistic scenario is half of those numbers. According this report, the revenue of hotels in Portugal reached 2.9 billion Euros in 2016.
As shown in this table, the estimated losses of hotel revenues due to weather conditions in 2030 when compared to the 2002-2016 period for the domestic tourism segment vary from 17.03 to 24.18 million Euros and for the inbound tourism segment from 18.26 to 38.08 million Euros, depending on scenarios. In 2030 these losses range between 0.59% and 0.84% for domestic tourism and between 0.63% and 1.31% for inbound tourism when compared to the hotel revenues in 2016. In 2050, those losses increase by a factor of about three for domestic tourist arrivals and by about six for inbound tourist arrivals.
Table 3: Estimated Losses of Hotel Revenues in 2030 and 2050
Scenarios
in 2030 in 2050
in Euros in % in Euros in %
Domestic Tourism Realistic Scenario 17,033,268 0.59 43,655,383 1.50 Optimistic Scenario 24,181,010 0.84 102,155,733 3.52 Inbound Tourism Realistic Scenario 18,256,655 0.63 84,841,559 2.93
Optimistic Scenario 38,085,884 1.31 506,379,063 17.46
Note: Estimated Losses are in 2016 prices. The percentage change is relative to the revenues in 2016. These
losses are based on the difference between temperature and precipitation of the 2002-2016 period and of 2030 and 2050 according to the A1B scenario.
7. Conclusion
This study quantifies the impact of burned areas on the number of domestic and inbound tourist arrivals in Portugal, using municipality level data. We find a negative relationship between burned areas and the number of tourist arrivals. Moreover, this relationship is persistent, suggesting that an increase in the
19
burned area reduces the number of visitors in the following periods. This finding is relevant for policy purposes as the impact of a fire on local economies extends over several years.
We also go beyond the traditional impact analysis by estimating the future burned area projections for the A1B scenario in 2030 and 2050. Then we provide the estimated losses in terms of the number of arrivals for each municipality. The results indicate that the majority of municipalities in 2030 will face a 0-2% reduction in the number of domestic tourist arrivals, while in 2050 this reduction will range between 2-4%. Regarding the number of inbound tourist arrivals, the reduction will range between 0-0.5% in 2030 and 0.5-1% in 2050. These results highlight that risk related to natural disasters should be taken into account when local businesses make investment and management decisions.
Our study can be extended in several different ways. First, our results represent the lower bound estimates since not only may tourist arrivals be affected, but also associated local businesses such as restaurants, shops, and taxis. Moreover, there may exist other costs associated with timber and agricultural sectors, property losses (i.e. houses), costs of fire suppression, loss of habitat and ecosystem services, impact on health due to smoke, and damaged infrastructures that should be replaced. Thus, it would be interesting to analyze the impact of fires on other sectors of the economy. Second, even though fires are considered as the main threat in Portugal, it would be interesting to estimate the economic costs related to other natural disasters. Finally, the impact of fires and other disasters on local economies in other Mediterranean countries should be analyzed thoroughly to manage and mitigate the costs of climate change in this region.
20 References
Becken S. and Hughey K.F.D. (2013). Linking Tourism into Emergency Management Structures to Enchance Disaster Risk Reduction. Tourism Management 36, 77-85.
Boxall P.C., and Englin J.E. (2008). Fire and Recreation Values in Fire-Prone Forests: Exploring an Intertemporal Amenity Function Using Pooled RP-SP Data. Journal of Agricultural and Resource Economics 33(1), 19-33.
Brida J. G. and Risso W. A. (2009). Tourism as a Factor of Long-run Economic Growth: An Empirical Analysis for Chile. European Journal of Tourism Research 2(2) , 178 – 185.
Butry D., Mercer D., Prestemon J., Pye J., and Holmes T. (2001). What is the Price of Catastrophic Wildfire? Journal of Forestry, 99(11), 9-17.
Dell M., Jones B.F., and Olken B.A. (2014). What do We Learn From the Weather? The new climate– economy literature. Journal of Economic Literature 52(3), 740–798.
Deschênes O. and Greenstone M. (2011). Climate Change, Mortality, and Adaptation: Evidence from Annual Fluctuations in Weather in the US. American Economic Journal: Applied Economics 3 (4), 152–185. Carvalho A., Schmidt L., Santos F.D., and Delicado A. (2014). Climate Change Research and Policy in Portugal, WIREs Climate Change 5, 199–217.
Cioccio L. and Michael E.J. (2007). Hazard or Disaster: Tourism Management for the Inevitable in Northeast Victoria, Tourism Management 28, 1-11.
FAO (2016). State of The World’s Forest. Forest and Agriculture: Land-use Challenges and Opportunities. Rome: Food and Agriculture Organization of the United Nations.
García-Ruiz J.M., Lopez-Moreno J.I., Vicente-Serrano S.M., Lasanta-Martınez T., and Beguerıa S. (2011). Mediterranean Water Resources in a Global Change Scenario. Earth-Science Reviews 105(3-4), 121–139. Gomes J.F.P. (2006). Forest Fires in Portugal: How It Happened and Why It Happened. International Journal of Environmental Studies 63(2), 109–19.
Gomes J.F.P. and Radovanovic M. (2008). Solar Activity as a Possible Cause of Large Forest Fires - A Case Study: Analysis of the Portuguese Forest Fires. Science of The Total Environment 394(1), 197-205. Fernández-Val I. and Weidner M. (2016). Individual and Time Effects in Nonlinear Panel Models with Large N, T. Journal of Econometrics 192, 291-312.
21
Hamilton JM (2003) Climate and the destination choice of German tourists. Research Unit Sustainability and Global Change Working Paper FNU-15. Hamburg University and Centre for Marine and Climate Research, Hamburg.
Heckman J. (1979). Sample Selection Bias as a Specification Error. Econometrica 47, 153-61.
Hesseln H., Loomis J.B., and Gonzáles-Cabán A. (2004). Comparing the Economic Effects of Fire on Hiking Demand in Montana and Colorado. Journal of Forest Economics 10, 21-35.
Hilger J. and Englin J. (2009). Utility Theoretic Semi-logarithmic Incomplete Demand Systems in a Natural Experiment: Forest Fire Impacts on Recreational Values and Use. Resource and Energy Economics 31, 287-298.
Hoinka K.P., Carvalho A., and Miranda A.I. (2009). Regional-scale Weather Patterns and Wildland Fires in Central Portugal. International Journal of Wildland Fires 18, 36-49.
Hystad P., and Keller P. (2005). Disaster Management: Kelowna Tourism Industry’s Preparedness, Impact and Response to a 2003 Major Forest Fire. Journal of Hospitality and Tourism Management, 13(1), 44–58. Instituto Nacional de Estatística (INE) (2018). Statistics Portugal. Available at: http://www.ine.pt (accessed 10 September 2018).
IPCC, (2000). Nebojsa Nakicenovic and Rob Swart (Eds.) Cambridge University Press, UK. pp 570 Available from Cambridge University Press, The Edinburgh Building Shaftesbury Road, Cambridge CB2 2RU England. IPCC (2014). In: CoreWriting Team, Pachauri, R.K., Meyer, L.A. (Eds.), Climate change 2014: synthesis report. Contribution of Working Groups I, II and III to the Fifth assessment Report of the Intergovernmental Panel on Climate Change. IPCC, Geneva, Switzerland.
Kountouris Y. and Remoundou K. (2011). Valuing the Welfare Cost of Forest Fires: a Life Satisfaction Approach. Kyklos 64(4), 556-578.
Loomis J., Gonzáles-Cabán A., and Englin J. (2001). Testing for Differential Effects of Forest Fires on Hiking and Mountain Biking Demand and Benefits. Journal of Agricultural and Resource Economics 26(2), 508-522.
Maida C.A., Gordon N.S., Steinberg A., and Gordon G. (1989). Psychosocial Impact of Disasters: Victims of Baldwin Hills Fire, Journal of Traumatic Stress, 37-48.
22 Sudan. Journal of Economic Geography 15(3), 649-671.
Marques S., Borges J.G., Garcia-Gonzalo J., Moreira F., Carreiras J.M.B., Oliveira M.M., Cantatinha A., Botequim B., and Pereira J.M.C. (2011). Characterization of wildfires in Portugal, European Journal of Forest Research 130, 775-784.
OECD (2018). OECD Tourism Trends and Policies 2018. OECD Publishing, Paris.
Onofri L. and Nunes P.A.L.D. (2013). Beach ‘Lovers’ and ‘Greens’: A World Empirical Analysis of Coastal Tourism. Ecological Economics 88, 49–56.
Otrachshenko V. and Bosello F., (2017). Fishing for Answers? Impacts of Marine Ecosystem Quality on Coastal Tourism Demand. Tourism Economics 23(5), 963-980.
Otrachshenko V., Popova O., Solomin P. (2017). Health consequences of the Russian weather. Ecological Economics 132, 290–306.
Le Page Y., Morton D., Bond-Lamberty B., Pereira J.M.C., and Hurtt G. (2015). HESFIRE: a Global Fire Model to Explore the Role of Anthropogenic and Weather Drivers. Biogeosciences 12, 887-903.
Palma J.H.N (2017). CliPick – Climate Change Web Picker. A Tool Bridging Daily Climate Needs in Process Based Modelling in Forestry and Agriculture. Forest Systems 26(1), eRC01, 4 pages.
Pereira M.G., Trigo R.M., Camara C.C., Pereira J.M.C., and Laite S.M. (2005). Synoptic Patterns Associated with Large Summer Forest Fires in Portugal. Agricultural and Forest Meteorology 129, 11-25.
Rahn M. (2009). Wildfire Impact Analysis, Fire Impact Analysis, Spring 2009. San Diego, CA: San Diego University. Retrieved from http://universe.sdsu.edu/sdsu_newscenter/images/rahn2009fireanalysis.pdf Santos F.D., Stigter T.Y., Faysse N., and Lourenςo T.C. (2014). Impacts and Adaptation to Climate Change in the Mediterranean Coastal Areas: the CIRCLE-MED Initiative. Regional Environmental Change 14(Suppl. 1), S1-S3.
Seetanah B. (2011). Assessing the Dynamic Economic Impact of Tourism for Island Economies. Annals of Tourism Research 38 (1), 291–308.
Soares P.M.M., Cardoso R.M., Miranda P.M.A., Medeiros J., Belo-Pereira M., and Espirito-Santo F. (2012). WRF high resolution dynamical downscaling of ERA-Interim for Portugal. Climate Dynamics 39(9-10), 2497-2522.
23 https://snirh.apambiente.pt/ (accessed 10 September 2018).
Thapa B., Cahyanto I., Holland S.M., and Absher J.D. (2013). Wildfires and Tourist Behaviors in Florida. Tourism Management 36, 284-292.
Vaux H. J., Gardner P.D., and Mills T.J. (1984). Methods of Assessing the Impact of Fire on Forest Recreation. General Tech. Rep. No. PSW-79, USDA/Forest Service, Berkeley, CA.
Vogelsang T.J. (2012). Heteroskedasticity, Autocorrelation, and Spatial correlation Robust Inference in Linear Panel Models with Fixed-effects. Journal of Econometrics 166, 303-319.
Witt S.F. and Witt C.A., (1995). Forecasting Tourism Demand: a Review of Empirical Research. International Journal of Forecasting 11(3), 447–475.
Yohe G. and Schlesinger M. (2002). The economic geography of the impacts of climate change. Journal of Economic Geography 2(3), 311-341.