THIS REPORT WAS PREPARED EXCLUSIVELY FOR ACADEMIC PURPOSES BY PATRICK PECHER, A MASTERS IN FINANCE STUDENT OF THE NOVA SCHOOL OF BUSINESS AND ECONOMICS.THE REPORT WAS SUPERVISED BY A NOVA SBE FACULTY MEMBER, ACTING IN A
MERE ACADEMIC CAPACITY, WHO REVIEWED THE VALUATION METHODOLOGY AND THE FINANCIAL MODEL. (PLEASE REFER TO THE DISCLOSURES AND DISCLAIMERS AT END OF THE DOCUMENT)
Page 1/32
M
ASTERS IN
F
INANCE
§ We recommend holding Henkel given our FY18 target price of 101,25€. This corresponds to an overall upside potential of 4.01% compared to the current market price, including a dividend of €1.72.
§ Adhesive Technologies, Henkel’s key segment, will be the main driver in terms of organic growth with an CAGR of 3.7% in the next 5 years. Growth in major end markets will reinforce the position as the world leader with 25% market share in 2016. An increase of raw material prices however may put pressure on the operating margin.
§ A highly competitive environment and potential increase of raw material prices hinder revenue growth and profitability in the laundry and home care segment. The CAGR for organic growth is forecasted at 3.3% until 2022, which is 1.7% points below the average of previous years.
§ The beauty care segment also faces high competition and increasing material prices. Nevertheless, organic growth is expected to reach previous years CAGR of 2.2%. A shifting focus on acquisitions in the sector and an extensive network of co-operations in the e-commerce business will be decisive. § Acquisitions remain a sales driver as a part of Henkel’s
strategy, contributing approximately €338 million on average in annually acquired revenue across all segments in the future, but a strong Euro will set limits.
Company description
Henkel is a German manufacturer of chemicals and consumer goods within the segments Adhesive Technologies, Laundry & Home Care and Beauty Care.
HENKEL
AG
&
C
O
.
KG
A
A
C
OMPANY
R
EPORT
C
HEMICALS
&
C
ONSUMER
G
OODS
03. JANUARY 2017
S
TUDENT
:
P
ATRICK
P
ECHER
27211@novasbe.pt
Evolution instead of Revolution
Performance in three solid growing sectors
Recommendation: HOLD
Vs Previous Recommendation HOLD
Price Target FY18: 101.25 €
Vs Previous Price Target N/A
Price (as of 2-Jan-18) 99.00 €
Reuters: HNKG.DE, Bloomberg: HEN3 GY Equity
52-week range (€) 92.54-114.25
Market Cap (€m) 46,559.2167
Outstanding Shares (m) 259.796
Outstanding Preferred Shares (m) 178.163
Source: Bloomberg Source: Bloomberg (Values in € millions) 2015 2016 2017F Revenues 18,089 18,714 19,860 EBITDA 3,105 3,345 3,557 EBIT 2,006 2,125 2,215 Net Profit 1,968 2,093 2,112 EPS 4.49 4.78 4.82 P/E 19.7 20.7 21.2 EV/Sales 2.26 2.53 2.42 EV/EBITDA 13.2 14.2 13.5 Net Debt/EV 1.8% 6.9% 7.3% ROIC 40.4% 38.6% 33.4%
HENKELAG&CO.KGAA COMPANY REPORT PAGE 2/32
Table of Contents
COMPANY OVERVIEW ... 3
SHAREHOLDER STRUCTURE ... 3
ADHESIVE TECHNOLOGY MARKET ... 4
MARKET TRENDS ... 5
OUTLOOK ... 7
LAUNDRY & HOME CARE MARKET ... 7
MARKET TRENDS ... 8
OUTLOOK ... 9
BEAUTY CARE MARKET ... 10
MARKET TRENDS ... 11
OUTLOOK ... 13
INORGANIC GROWTH FACTORS ... 13
M&AACTIVITY ... 13
FOREIGN EXCHANGE RATES ... 15
FINANCIALS ... 16
COST OF GOODS SOLD ... 16
OPERATING EXPENDITURES ... 18
CAPITAL EXPENDITURES ... 20
RETURN ON INVESTED CAPITAL ... 21
WORKING CAPITAL ... 21
CAPITAL STRUCTURE ... 22
VALUATION ... 23
COST OF CAPITAL ... 23
DISCOUNTED CASH FLOW ... 23
SCENARIO ANALYSIS ... 24
FINAL CONSIDERATIONS ... 25
APPENDIX ... 26
REVENUES ... 26
INCOME STATEMENT ... 27
BALANCE SHEET ... 28
STATEMENT OF SHAREHOLDERS EQUITY ... 29
HENKELAG&CO.KGAA COMPANY REPORT
PAGE 3/32
Company overview
Headquartered in Düsseldorf, Henkel AG & Co. KGaA is a listed German manufacturer of chemicals and consumer goods. The company’s operations are divided into the three business segments Adhesive Technologies, Laundry & Home Care and Beauty Care, serving both industrial and consumer markets. In its Adhesive Technologies business Henkel is the global market leader across all industry segments. In the Laundry & Home Care and Beauty Care segments, Henkel has a leading market position in various product categories.
Adhesives, sealants and functional coatings from Henkel are used in a wide range of industries including aerospace, automotive, construction, electronics and medical technology. This segment represents Henkel’s key value driver and accounted for about 48% of the revenue in FY16. All products for industrial usage are sold under the brands Loctite, Bonderite, Technomelt, Teroson and Aquence. Henkel’s adhesive products for consumers and private use belong to brands like Pritt, Ponal, Pattex and Ceresit. In the Laundry & Home Care business Henkel’s product range extends from universal detergents over special detergents and softeners to bath and glass cleaners, accounting for 31% of the revenue in FY16. Among the best known brands are: Persil, Pril, Purex, White Giant and Bref. In the field of Beauty Care Henkel manufactures products for hair, body, skin and oral hygiene that are sold under brand names like Schwarzkopf, Syoss, Dial, Fa or Schauma. The Beauty Care segment is the smallest of all three divisions and generated 20% of Henkel’s revenue in FY16.
Shareholder structure
The current shareholder structure of Henkel consists of 178.2 million preferred shares, which have been listed publicly since 1985 and 259.8 million ordinary shares, which have been listed since 1996. The major shareholders of the Henkel ordinary shares with approximately 159 million shares, correspondingly to 61.02%, are members of the Henkel family. Other mentionable large shareholders are the Vanguard Group, Blackrock and the Tweedy Brown Company each owning around 1% of the ordinary shares. In terms of geographic ownership, Germany is clearly the most dominant country followed by the USA, Canada and Luxembourg. The preferred shares in contrast are entirely in free float apart from the treasury shares. The institutional investors that own a majority of preferred shares are internationally broadly distributed. In contrast to the ordinary shares the geographic ownership is completely different. Whereas investors from the USA and the UK account for more than 50% of the institutional investors, only 10% of investors are from Henkel’s home country Germany.
Graph 1 – Henkel’s revenue by segment in percent
Graph 2 – Geographic ownership of Henkel’s ordinary shares in percent Source: Annual report
HENKELAG&CO.KGAA COMPANY REPORT
PAGE 4/32
Adhesive Technology Market
As the worldwide market leader in the adhesive market this segment represents Henkel’s most important business unit in terms of revenue and value generation. The separation of the Adhesive Technology segment shows a high significance of industrial adhesives, with about 80% of overall adhesive revenue, in comparison to adhesives for consumers, craftsmen and buildings. Current studies of the ‘Coatings World’ estimate the market value of the adhesive and sealants on $53.8 billion in 2016. Henkel is the clear leader in this market with an estimated market share of 25%, followed by Silka with 7%, 3M (6%) and HB Fuller (4%). This leading position is also reflected in the broad range of industry applications, mentioned previously.
Due to the high dependence on various industry sectors we see a close connection between the organic growth of Henkel and macroeconomic developments, as well as current market trends. The industrial production index (IPX), shown on the left, covers manufacturing, mining, utilities and construction sectors and is therefore an appropriate indicator for the market environment in the industrial adhesive sector. In retrospect, the IPX can describe the organic growth of Henkel’s adhesive business quite well, capturing the slump in 2013 (organic growth: 2.7%) and following upturn in the next year (organic growth: 3.7%). Over the last few years, the IPX has reflected the industrial upturn since 2010, reaching a record high in the second quarter of 2017. Visibly regaining momentum in the second half of 2016, the index is expected to grow 2.5% in 2017. These positive dynamics from the industry can already be seen in Henkel’s interim reports for the adhesive segments, which let us conclude that organic growth in FY17 will accelerate to approximately 4.4%. This value is significantly above the CAGR of 2.9% for the previous 5 years. Regarding our future growth expectations of Henkel we anticipate a reduction of the market’s momentum and a settlement at annual average growth rates of 3.7% until 2022. Our forecasts can be attributed to positive economic development and various industrial trends that are presented in the following.
Global economic growth is expected to slightly pull on over the next years, creating decent conditions for businesses depending on many industries. Subsequent to the slump in 2016, which can be seen on the left, global GDP is expected to increase to 3.6% in 2017 and further to 3.8% until 2022 according to the World Bank. Key contributors are especially emerging and developing countries. Broad-based upward revisions in the euro area, Japan, emerging Asia, emerging Europe, and Russia clearly offset downward revisions for the United States and the United Kingdom in the short term. However, while the baseline
Graph 3 – Company market shares 2015 in adhesives in percent
Graph 4 – Industrial Production Index
Graph 5 – Global GDP growth in percent
Source: Report on adhesive industry – Ajay Kottakota
Source: OECD
HENKELAG&CO.KGAA COMPANY REPORT
PAGE 5/32
outlook is strengthening, growth remains weak in many countries and inflation is below target in most advanced economies. The broad distribution of Henkel’s revenue generation (see graph 6) with 42% of revenue coming from emerging markets in FY16, allows the company to incorporate growth in all relevant and dynamic countries. The positive outlook for economic growth still provides a solid base for potential organic business growth. Whereas global GDP grew annually by 3.4% on average since 2012, the market for adhesives and sealants has increased by 4% annually worldwide. This development was supported by a steady recovery and driving trends in the major end markets of the adhesive sector. The three most important end markets are packaging, construction and automotive, which all together amount for over 75% of the worldwide adhesive market (see graph 7). In the following we discuss recent and influencing trends that occur in these three key end markets.
Market Trends
The first major trend that affects the adhesive and sealants market occurs in the typically dynamic automotive sector. The car manufacturers have started to focus on the weight reduction of cars, by replacing metal components with composites that can be bonded, support sales of automotive adhesives. There are two main factors that drive vehicle weight reduction. First of all, stricter CO2 and fuel economy regulations cause the industry to commit sustainability efforts to reduce exhaust emissions. Secondly, increasing fuel prices support the motivation of customers to purchase fuel efficient vehicles. Lightweight vehicle construction is one of the most significant factors that immediately contribute to reduce fuel consumption and implicitly CO2 emissions. Additionally, the emergence of electric vehicles offers new opportunities for manufacturers of adhesives, as market shares of such cars are expected to increase from less than 0.02% in 2012 to 2% in 2020. Although the use of automotive adhesives in electric vehicles is lower due to less engine related assemblies, a key focus remains on the overall weight of the car. The high weight of batteries forces car manufacturers to reduce the overall weight by substituting traditional materials like steel with substrates that cannot be welded. The current usage of automotive adhesives per car lies around 15kg on average and industry experts forecast that this amount may increase by a minimum of 30% throughout the next 10 years. Overall car sales are predicted to consistently go up during the next years, sales of light vehicles are expected to exceed its previous level by more than 18% in 2022 compared to 2016 (see graph 8). As Henkel is serving all significant car manufacturers and offers extensive solutions in lightweighting we expect the company to capture a lot of future growth potential in this market. The global automotive adhesive and sealants market was valued $4,879.3 million in 2014 and is expected to grow
Source: Report on adhesive industry – Ajay Kottakota
Graph 8 – Global light vehicle sales in million
Graph 6 – Revenue of Henkel FY 16 by region in percent
Graph 7 – Application of adhesives by industry in percent
Source: Annual report
HENKELAG&CO.KGAA COMPANY REPORT
PAGE 6/32
with a CAGR of 8.8% between 2015 – 2020. In general, we see various growth opportunities in the trend towards lightweight construction in the transport business through the adoption of adhesive bonding technologies. This includes also the aerospace, marine and train markets besides automotive, which Henkel is all serving.
Another important trend that accelerates high demand for adhesives occurs in the construction sector, which is the second largest in terms of demand (see graph 7). It profits from the recovery of the housing and building market in developed regions like the USA and Europe, in combination with a rapid urbanization and population growth in developing countries. Graph 9 on the left demonstrates the rapid urbanization in China, which increased from 50% in 2010 to approximately 56% in 2015 and is expected to continue growing. The general importance of China for the adhesive market induced Henkel to open the world’s largest adhesives factory in 2013 to expand production capacity for this region and serve demand. Additionally, within the trend towards green buildings and isolation, construction adhesives are used in numerous applications due to their high durability. Based on the 50 most relevant countries worldwide, the global construction industry is expected to regain growth momentum and to reach an average annual increase of 3.9% over 2016 – 2020, which is significantly higher compared to the CAGR of 2.8% between 2010 – 2015. Due to the increasing range of applications resulting from the higher demand for green buildings, especially in developed countries, construction adhesives are expected to exceed the industry’s average growth. The global value of the construction adhesive market was therefore estimated to reach $10.56 billion in 2020 and is projected to grow at a CAGR of 5.1% during 2015 – 2020. Henkel’s broad presence in the developed and relevant developing markets support the company to remain a key player in construction adhesives.
Lastly, the largest application within the adhesive sector, packaging, will continue to support the trend of consumerism, pre-packed food and other articles purchased in a packed format. With a worldwide proceeding urbanization, the consumer habits of buying packed goods in supermarkets, retail outlets and online will displace other means of obtaining goods such as local markets. This modern way of consuming food is well established in advanced (especially western) economies, but is still evolving in many regions such as Asia, Africa or the Middle East. Correspondingly the forecasted growth rates for the food packaging market in the Asia-Pacific region and rest of the world are higher compared to developed regions (see graph 12). As such, these factors drive the demand for packaging materials which in turn use packaging adhesives. All in all,
Source: Markets and Markets Graph 12 – Food packaging market size by region in $ billion
Graph 10 – Construction market in top 50 countries in $ billion
Graph 9 – Urbanization rate of China in percent
Graph 11 – Size of green building market in the USA in $ billion Source: PR Newswire Association Source: Statista
HENKELAG&CO.KGAA COMPANY REPORT
PAGE 7/32
the global market of packaging adhesives is estimated at $14.7 billion in 2016, expected to reach $18.2 billion by 2021 driven by a CAGR of 4.3%.
Outlook
Whereas demand for adhesives in Europe has only shown slight growth, influenced by overall economic developments, the Asia-Pacific region has become the world’s largest purchaser of adhesives. This results from a fast-paced growing economy and a dominant position in adhesive-intensive industries of China, which is nowadays already contributing more than 20% of the global adhesives and sealants revenue. The dominance of the Asia-Pacific region is also reflected in our forecast for Henkel’s adhesive segment. While the North American market has been the second most important one for Henkel, Asia-Pacific will close this gap in terms of revenue during the forecast period (see graph 14). Emerging markets in general represent a major growth opportunity, due to increasing levels of consumption and industrialization. Especially the growing middle class in these regions may drive growth in end markets. Incorporating all previously mentioned factors and trends research expects the worldwide adhesive market to reach a value of $66,876 million by 2022, growing at a CAGR of 3.7% during 2016 – 2022. This forecast is in line with our expectations (3.7%) for Henkel’s future generated organic growth. The strong market position enables Henkel to seize main trends on a broad basis and to serve demand on various major end markets. Due to appropriate research expenses (see Operating Expenses in the Financials chapter), which are required in this technologically driven market to maintain the innovation standard, and the continuing of targeted acquisitions Henkel will be able to strengthen its worldwide leading position within adhesive markets and preserve its current market share level. On average, we expect acquired companies to contribute about 0.7% points per year to Henkel’s future revenue. However, due to high exposure to currency fluctuations, later discussed in more detail, operating revenue of Henkel’s adhesive segment will grow with a CAGR of 2.7% between 2017 – 2022.
Laundry & Home Care Market
Henkel’s second important source of revenue generation is the laundry and home care business. Revenues in this market are mostly generated in the laundry care segment, accounting for almost 50% of the market’s value in 2016. The remaining value is contributed by household cleaners (20%), dishwashing detergents (17%) and polishes, room scents and insecticides (14%). Henkel has been active in all mentioned sub-segments, offering a broad portfolio of brands
Graph 13 – Henkel’s annual organic and overall growth in adhesives in percent
Graph 14 – Henkel’s revenue in the adhesive segment by region in € billion
Graph 15 – Laundry & Home Care market 2016 by revenue in percent Source: Annual report, Analyst estimates
Source: Annual report, Analyst estimates
HENKELAG&CO.KGAA COMPANY REPORT
PAGE 8/32
and products. Overall, Henkel has a strong position in developed countries, being a market leader in Europe and North America. Worldwide the company is established as the third largest market player in the laundry market with a share of 9% behind the market leader Procter & Gamble (27%) and Unilever (15%). Those three companies alone represented half of the worldwide laundry market in 2015. While western regions have contributed to a solid growth, the emerging regions and especially Asia-Pacific were the key drivers in the last years. For the future we expect a continuation of this growth pattern, but with a different pace and driven by the latest market trends.
Market Trends
Characteristic for fast-moving consumer goods, the consumers’ shopping habits are shaped by various forces, including product availability, innovation, cultural tradition and financial considerations. In the following we present the most important socioeconomic trends that affect the home and laundry care industry. According to the OECD the global middle class will increase from 1.8 billion in 2009 to 4.9 billion by 2030. Economic prosperity will be a growth engine for consumption, as consumers will be able to purchase appliances such as washing machines or dishwashers and become more likely to trade up premium cleaning and laundry products. Graph 17 on the left shows the penetration rates of washing machines and dryers for households in the different regions. It is clearly visible that developing regions are lagging behind Europe and North America with penetration rates of 87% and 82% respectively. A closure of the gap, which is likely in the long-term, means also higher demand for detergents for the usage of such appliances.
Another trend in modern society is the need for efficiency and products that reduce the time spent on cleaning tasks. The global increasing workforce, particularly driven by a growth of women labour force of more than 4% between 1990 and 2013 according to the World Bank, supports the demand for convenient cleaning tools. Furthermore, the proceeding urbanization, as already presented in graph 9, is likely to lead to a greater adoption of modern cleaning appliances, because residences will have the infrastructure needed to support these machines.
Lastly, the development towards omnichannel is pioneering in retail as many consumers use digital devices to complete their shopping. Graph 18 shows that online shopping penetration rates are independent of regional location and can also be very high for emerging countries. Therefore, it is even more important to be present in the e-commerce business to distribute products also via this channel and secure market shares. Henkel has agreed to various co-operations
Source: Statista
Graph 17 – Washing machine and dryer penetration rates 2016 in percent
Graph 16 – Company market shares in laundry care 2015 in percent
Graph 18 – Online shopping penetration rates 2016 in percent by country
Source: The Nielson Company Source: Reuters
HENKELAG&CO.KGAA COMPANY REPORT
PAGE 9/32
with online suppliers like Amazon and Alibaba to cover its online channel and face competitors. We will discuss this topic in more detail in the beauty care chapter. However, in order to succeed in the new retail landscape, manufacturers will need to use a combination of online and offline offers to inform consumers and add value throughout the entire shopping experience, which Henkel can offer in many regions.
Outlook
Compared to the overall laundry and home care market, which showed a CAGR of 2.7% in the last 5 years, Henkel could clearly outperform with annual average growth being almost twice as much (5%). While Henkel’s organic growth was approximately in line with market growth in Western Europe (1.1%) and North America (0.6%), it highly exceeded market growth in emerging markets. In the Asia-Pacific region Henkel’s CAGR of organic growth was approximately 9.6% in comparison to the market’s CAGR of 4.3%. Henkel has still been profiting from its early presence in China in 1971 and the first joint venture in 1990, producing for the laundry and home care market. Nowadays the company is present in 12 locations across China, which helps Henkel to keep establishing its brands and products. The strong positioning in such regions has significantly contributed to Henkel’s positive development in the past. Consequently, the dependence on emerging markets demonstrates potential opportunities and risks for Henkel. Incorporating the mentioned trends the global laundry and home care market was estimated by ‘Statista’ at $57.8 billion in 2016 with a CAGR of 2.3% over the following years, reaching $64.3 billion by the end of 2021. However, considering overall developments and Henkel’s current positioning, we expect Henkel’s future organic growth to exceed average growth rates of the estimated laundry and home care market reaching a CAGR of 3.3% between 2017 – 2022. While Henkel is still expected to outperform the market, the pace of growth will clearly go down. The average annual outperformance will decrease from 2.3% to 1% respectively. Consequently, Henkel will still gain market share from competing companies, but with a decent pace. We come up with this conclusion, because of different key factors that emphasise Henkel’s future performance. Henkel has strong brands with a common international positioning and therefore high recognition value. Based on the strong performance and well standing in key markets, sales will still increase above market expectations. However, Henkel’s organic growth will be hindered by a further increase in competition. Besides the competition with international players like Unilever, Procter & Gamble and Reckitt Benckiser, retail chains and private labels are also launching own, mainly cheaper, products. As a manufacturer of branded products Henkel will be forced
Graph 19 – Henkel’s annual organic and overall growth in laundry and home care in percent
HENKELAG&CO.KGAA COMPANY REPORT
PAGE 10/32
to offer more promotional activities, in order to maintain the number of customers and sales. Although established brands like Henkel’s Persil or Pril continue to be preferred by most customers, the large target group of price-consciousness consumers should not be neglected.
Analogous to previous years, we therefore expect that Henkel can maintain its excess growth in developing regions, but with a significantly lower premium. For example, the forecasted average annual market growth for Asia-Pacific until 2021 reaches 3.9%, whereas Henkel can grow organically by 6.9% on average. While we expect organic growth in Western Europe to meet market expectations (0.8%), organic growth in North America (1.1%) is likely to slightly exceed market expectations of 0.8%. This is mainly assigned to synergies from the acquisition of ‘The Sun Product Corporation’ in 2016, which lifted Henkel on the second rank in the North American laundry and home care market. Furthermore, the incorporation of of $1.1 billion revenue in North America in FY17 from this acquisition made it the most important region for Henkel in this segment, visibly in graph 20.
The laundry and home care segment has benefited the most from acquisitions in the past, and we expect to see a continuation of that in the future, but in combination with a shift towards the beauty care sector (for more details see Inorganic Growth Factors). When also taking into account the fluctuations in currency exchange rates the growth in operating revenue will reach a CAGR of 3.6% between 2017 – 2022. This growth rate is far below the last 5 year average of 6.2%, attributable to slower organic growth, fewer acquisitions and higher currency fluctuations.
Beauty Care Market
The third pillar of Henkel’s business is the beauty care market. Unlike to the previous two segments, Henkel is not maintaining a similar strong market position. Except a leading role in the category hair products, Henkel cannot fall back on a dominating position. Furthermore, the beauty care market can be segmented in more product categories. The most important are skin care, hair care, colour cosmetics and men’s grooming. Henkel is not participating in all categories, only in the first three mentioned and oral care. Beauty products can also be subdivided into premium and mass production segments, according to brand prestige, price and distribution channels. From a global perspective, the mass segment represents about 72% of total sales, while the premium segment accounts for the remaining 28%. The majority of global premium cosmetics sales is concentrated within developed markets, mostly the USA, Japan and France. In concerns of the geographic aspect, Asia-Pacific is clearly the leading market,
Source: Euromonitor
Graph 20 – Henkel’s revenue in the laundry and home care segment by region in € billion
Graph 21 – Beauty care market 2016 by product category in $ billion
Graph 22 – Regional split of beauty care market 2016 in $ billion
Source: Annual report, Analyst estimates
HENKELAG&CO.KGAA COMPANY REPORT
PAGE 11/32
which can be seen in graph 22. The gap to the developed regions of Western Europe and North America is going to increase even further over the next years. Since the turn of the century the beauty market of emerging countries has been growing significantly with a CAGR of 4.4%. From 2010 to 2015 the four biggest emerging countries (China, Russia, India, Brasil) increased their market share in overall beauty market from 21% to 25%. At the moment, most of the major international beauty care manufacturers are focusing on expanding their presence in these regions, which applies also for Henkel. For most of them the main challenge is to make their brands relevant to shoppers in markets where consumer’s habits and cultures differ from what the companies are familiar with. As manufacturers keep pushing into these markets, competition is reinforced and prices are likely to stagnate or even decrease, which is already the case in developed countries. Graph 23 shows the changes in consumer prices of personal care products in the euro area and the USA since 2010. The overall price increases were on a very low level and have even shifted towards stagnation in recent years. Due to high competition, we expect to see similar developments in emerging markets throughout the future.
Market Trends
The shifting focus on emerging markets has also enforced the relevance of the mass market. International players have been attempting to penetrate this market through product diversification in the context of product line prices, as new product lines are being released at lowering price levels. This trend implicates two important conclusions: First of all, companies have to show a high innovation by launching new or improved product lines. And secondly, the high competition involving decreasing prices, hinder sales growth. Henkel is severely affected by these developments, which justifies why the company shows a high amount of product launches and innovations in this segment and has been struggling with decreasing market share, lagging behind in terms of organic growth compared to overall market growth. Prestige beauty companies like L’Oréal, Procter & Gamble, Unilever and Estée Lauder all have products in their portfolio with significant national and international brand name recognition and consumer loyalty. Additionally, these competitors devote significant resources to promote their brands through advertising (see chapter Operating Expenditures). Graph 24 on the left demonstrates the balance of power among companies within the beauty care segment. L’Oréal was the clear leader in this segment with over $27 billion in revenue, followed by Unilever and Procter & Gamble. Henkel on the other hand ranks only at the 16th position, still far behind the German competitor Beiersdorf. The segmentation of the market reveals how difficult it will be for Henkel to compete with the high number of peers, many of them being
Graph 23 – Changes in consumer prices of personal care products in percent
Graph 24 – Revenue in $ billion of selected companies in the beauty care sector 2016
Source: Annual report Source: Bloomberg
HENKELAG&CO.KGAA COMPANY REPORT
PAGE 12/32
significantly larger. An important factor why Henkel will struggle to gain further market share is that in contrast to most of the competitors the focus is not lying on the beauty care sector. L’Oréal and Estée Lauder for example are pure beauty care companies, but also diversified companies like Unilever (38% of revenue) or Beiersdorf (83% of revenue) generated a significantly larger share of their revenue in FY16 from this segment in comparison to Henkel (20% of revenue). The higher specialization of competitors also comes along with a broader brand and product portfolio, which Henkel is lacking. ‘Schwarzkopf’ is the driving force among all brands of Henkel, giving the company a strong position in the hair care segment, supported by ‘Syoss’. However, there are no other mentionable brands in Henkel’s portfolio that play an important role in any other product category of the beauty care market. Consequently, Henkel is well positioned to capture future growth in the hair care segment, but with a forecasted CAGR of 2.2% between 2017 – 2022 the segment is among the slowest growing in beauty care. In all other product segments it will be difficult to keep up with market growth, which is why we expect a decreasing market share for Henkel in the overall beauty market.
The competition and need for innovation however initiated Henkel to set up a global operating research & development team to serve customers with the latest products. The local presence of testing & development centres in Asia, Africa and South America are supposed to take account of local distinctions and specific customer needs that Henkel will have to cover in order to compete in the emerging markets. Yet, the most influential trend in the beauty care sector is the shift towards sales over the internet, similar to products of the laundry and home care segment. E-commerce shops continue to expand their range of products and websites explain the specifics of different products. Currently Henkel is distributing most of its products and brands online in co-operation with online retailers like Amazon or store chains like dm. However, such co-operations are not available in all countries, including Portugal, and leave space for expansion to capture all potential growth. Advantageous was particularly the launch of a partnership with Alibaba in 2015 to sell its Schwarzkopf hair care brand also online in China. Although Henkel entered this market quite late, more than half of the sales are generated digitally now. Typical consumers, who buy online, know which products they want mainly because of satisfaction with the product quality during previous use. As technology develops, manufacturers are trying to take advantage of new opportunities and interact with consumers in a more practical way. This happens through channels like websites, Facebook, Youtube or apps for smart phones. Henkel has been using these media, enforcing especially the awareness of its key brand Schwarzkopf. For example, the previously launched
Importance of e-commerce Increasing competition and Henkel’s slim brand portfolio
HENKELAG&CO.KGAA COMPANY REPORT
PAGE 13/32
Schwarzkopf app encourages users to test new looks and implicitly new products via a ‘live mirror’ application.
Outlook
Recent studies estimate the total value of the beauty care market at $130.7 billion in 2016. The forecasted growth of the overall market is expected to follow up previous years with an CAGR of 4.4% between 2017 – 2022. Taking into account all recent factors we expect to see a slightly lower organic growth of Henkel until 2022 compared to the last 5 years, dropping 0.1% points to a CAGR of 2.2%. Consequently, Henkel is expected to lose market share as it cannot keep up with overall market growth. Slower organic growth affects almost all regions, except of Eastern Europe, which profits from the recovery of Russia, and correspondingly results in lower market shares. Although Henkel’s average organic growth remains high in emerging markets like Asia-Pacific (5.4%), it will still lag behind the regional growth (6.4%). Especially the high competition, enforcing price wars and limiting Henkel’s market share are damaging for future growth. Additionally, most products are related to the dominant brand Schwarzkopf, leaving hardly any other brands in Henkel’s portfolio that can seriously compete in other beauty categories apart from hair care. However, growth impulses can be created by focusing on acquisitions in this segment and expanding the slim brand and product portfolio. When including inorganic growth, the beauty care segment can succeed its previous 5-year average (3.7%) with 5.2%. However, the expectation of higher fluctuation in currency exchange rates pushes operating revenue down to a CAGR of 3.3% until 2022. In terms of regional developments, Asia-Pacific will become more important to Henkel and clearly strengthens its position as the third largest market for the company, whereas most other regions show decent growth (see graph 26).
Inorganic Growth Factors
M&A Activity
Henkel has been highly active in the M&A market in the last years and as a part of Henkel’s strategy this trend is likely to continue in the future. Since 2011 Henkel made an amount of 5 acquisitions per year on average, by spending over €1.1 billion annually. Most of the acquired revenue can be attributed to companies from the laundry and home care segment, followed by beauty care. In both business units Henkel is striving to strengthen its categories, whereas acquisitions in the adhesive technologies sector aim to expand the company’s technology leadership. The regional M&A activities of Henkel are not limited to
Graph 26 – Henkel’s revenue in the beauty care segment by region in € billion
Graph 25 – Henkel’s annual organic and overall growth in beauty care in percent
Source: Annual report, Analyst estimates
HENKELAG&CO.KGAA COMPANY REPORT
PAGE 14/32
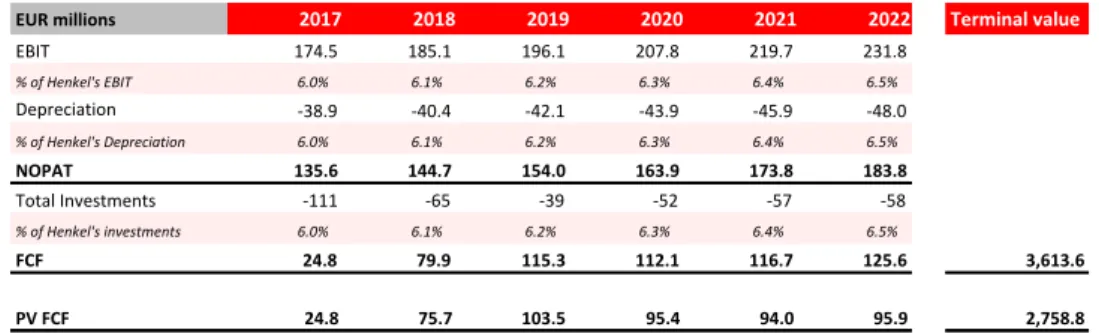
any specific markets, instead acquisitions are reported worldwide. However, it appears a recent focus on the North American region due to Henkel’s largest acquisition of ‘The Sun Products Corporation’ in the USA in 2016 and the acquisitions of ‘Darex Packaging Technologies’ and ‘Nattura Laboratories’ in 2017. In view of the considerable amount of acquisitions we incorporated future potential acquisitions into our model. In order to determine whether Henkel’s acquisitions are value creating we conducted a precedent case analysis. Therefore, we chose the acquisition of the previously mentioned ‘The Sun Products Corporation’, as it has been the largest takeover and happened previously. The availability of evaluable data is also a crucial factor as most companies among Henkel’s acquisition are relatively small, with a revenue below €100 million. When Henkel acquired ‘Sun Products’ the revenue multiple of 2.2 was just slightly above the average of recent transactions (2.0), which validates the acquisition as a precedent case. We used a discounted cash flow model to estimate the value of ‘Sun Products’ at the time of the acquisition with the following assumptions: ‘Sun Products’ contributed 6% to Henkel’s EBIT in 2017, this amount is expected to increase constantly to 6.5% until 2022 and captures future potential synergies between both companies. Other metrics like depreciation or total investments equal the amount of Sun Products EBIT contribution. A peer analysis for the The Sun’s beta, including a size premium, allowed us to determine its cost of capital, in combination with a perpetuity growth rate of 2% analogous to our valuation of Henkel. After incorporating all assumptions we estimated the value of ‘Sun Products’ at €3.25 billion for Henkel, exceeding the original purchase price of approximately €3.2 billion. This corresponds to a net present value of €48.2 million or a value generation of 1.5% per invested Euro. However, the positive return is based on the assumption of synergies and by excluding them the value would fall on €3.01 billion. Therefore, we consider the takeover of ‘Sun products’ as a value creative precedent case, which is representative for Henkel’s acquisitions in the future.
Table 1 – Discounted cash flow valuation of ‘Sun Products’ (Source: Annual report, Analyst estimates)
Forecasting acquisitions is problematic and nearly impossible for a longer timer period, but in order to include them in our forecast we analysed Henkel’s
Graph 27 – Henkel’s annual amount spend on acquisitions in € million
Positive NPV in acquisitions
Source: Annual report
EUR millions 2017 2018 2019 2020 2021 2022 Terminal value EBIT 174.5 185.1 196.1 207.8 219.7 231.8 % of Henkel's EBIT 6.0% 6.1% 6.2% 6.3% 6.4% 6.5% Depreciation -38.9 -40.4 -42.1 -43.9 -45.9 -48.0 % of Henkel's Depreciation 6.0% 6.1% 6.2% 6.3% 6.4% 6.5% NOPAT 135.6 144.7 154.0 163.9 173.8 183.8 Total Investments -111 -65 -39 -52 -57 -58 % of Henkel's investments 6.0% 6.1% 6.2% 6.3% 6.4% 6.5% FCF 24.8 79.9 115.3 112.1 116.7 125.6 3,613.6 PV FCF 24.8 75.7 103.5 95.4 94.0 95.9 2,758.8
HENKELAG&CO.KGAA COMPANY REPORT
PAGE 15/32
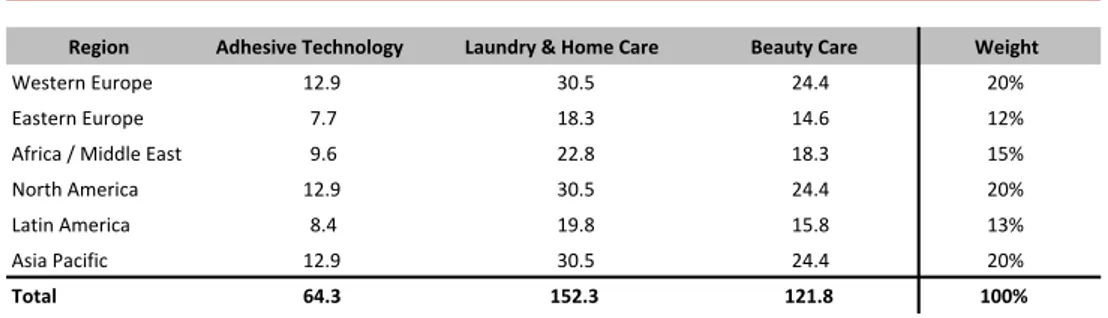
previous acquisition pattern. The starting point is to estimate the future amount spent per year on acquisitions for which we came up with approximately the half (€560 million) of the previous years’ average. This amount seems reasonable as transaction activity of Henkel has increased significantly over the last 4 years (see graph 27) and is very likely to fall on a lower level. By applying the historical revenue multiple we conclude that the annually acquired revenue is about €338 million. Table 2 shows how this revenue will be distributed among all segments and regions where Henkel is operating. Clearly visible is a remaining high focus on the laundry and home care segment, followed by beauty care. However, we are expecting to see a relative shift towards acquisitions in the beauty care sector, because Henkel will have to strengthen its brand portfolio and face competition, and adjusted the historical weighting. The acquired revenue of laundry and home care will amount for 45%, compared to previously 60%, and beauty care will amount for 36% instead of 21%. In terms of regional distribution, we also considered the historical focus and reasonable future concentrations. The highest weights remain on Henkel’s most important markets: Western Europe, North America and Asia-Pacific. Although North America has been clearly in focus over the last two years, we expect to see a shift towards emerging markets, especially Asia-Pacific. This shift anticipates that Henkel will capture additional future potential growth in such an important market.
Table 2 – Henkel’s forecasted acquired revenue for each segment and region in € million (Source: Analyst estimates)
Henkel’s CAGR for overall organic growth is forecasted at 3.3% between 2017 and 2022, when adding inorganic growth from acquisitions the CAGR increases to 4.9% in the same time frame. This difference results from the annually acquired revenue of €338 million. However, in order to finally reach Henkel’s operating revenue we have to account for changes in foreign exchange rates.
Foreign Exchange Rates
The global operations of Henkel highly expose the company to currency fluctuations. Respectively, a strong Euro in the future can have extensive limits to
Graph 28 – Forecasted amount spend by Henkel for acquisitions by sector in percent
Region Adhesive Technology Laundry & Home Care Beauty Care Weight
Western Europe 12.9 30.5 24.4 20% Eastern Europe 7.7 18.3 14.6 12% Africa / Middle East 9.6 22.8 18.3 15% North America 12.9 30.5 24.4 20% Latin America 8.4 19.8 15.8 13% Asia Pacific 12.9 30.5 24.4 20% Total 64.3 152.3 121.8 100% Acquired revenue EUR(m) by region Source: Euromonitor
HENKELAG&CO.KGAA COMPANY REPORT
PAGE 16/32
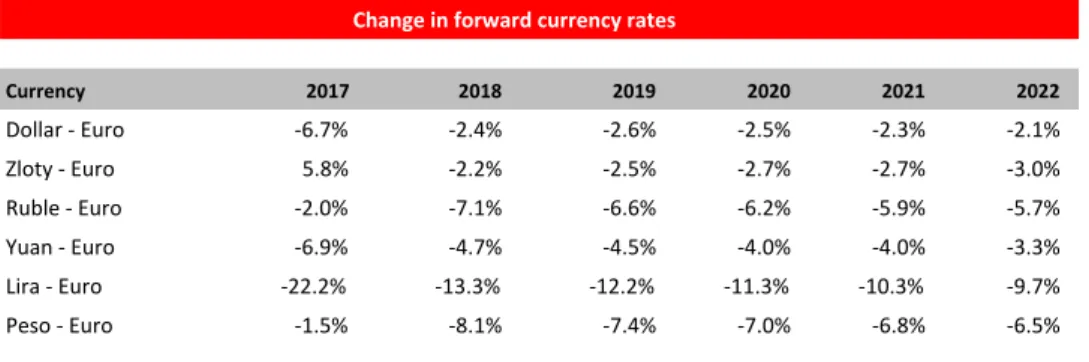
revenue growth. In order to adjust revenue for foreign exchange rates, we used the forward rates of the main currencies (see table 3) for each region as a proxy. All currencies are equivalently considered by Henkel in their financial reporting.
Table 3 – Annual change in forward currency rates (Source: Bloomberg)
The change in forward currency exchange rates concludes an appreciation of the Euro compared to all other main currencies in almost every period until 2022. Hence, the strong Euro can be related to the economic recovery and upturn in the euro-zone, accompanied with a likely increase of the interest rate level by the European Central Bank. As a result, we expect to see a hindered revenue growth of Henkel in all regions. However, the forward rates appear to be very consequent and relatively high, which is why we adjusted them for each region to get a, from our perspective, more reasonable and valid forecast. The Turkish Lira for example, which shows the most significant depreciation to the Euro, is not representative enough for the whole region of Africa and Middle East. Adjustments for this region were therefore the highest, followed by other emerging markets. For developed countries, we used slight adjustments of the Polish Zloty and the US Dollar. Finally, when adjusting the organic and inorganic revenue (CAGR: 4.6%) for changes in foreign exchange rates we obtain a forecasted CAGR of 3.1% for Henkel’s operating revenue between 2017 – 2022. The difference (1.5% points) in growth between the sum of organic and inorganic revenue and operating revenue shows the significance of currency fluctuations for Henkel’s business.
Financials
Cost of Goods Sold
In terms of cost of goods sold (COGS) we do not expect to see significant changes over the next years. They basically depend on two contrary developments, the manufacturing costs and the material costs. Although Henkel has shown proper efficiency results in the production process in the past (see below), which are likely to continue, we also expect overall slightly higher prices
Graph 29 – Henkel’s COGS by category in percent Currency 2017 2018 2019 2020 2021 2022 Dollar - Euro -6.7% -2.4% -2.6% -2.5% -2.3% -2.1% Zloty - Euro 5.8% -2.2% -2.5% -2.7% -2.7% -3.0% Ruble - Euro -2.0% -7.1% -6.6% -6.2% -5.9% -5.7% Yuan - Euro -6.9% -4.7% -4.5% -4.0% -4.0% -3.3% Lira - Euro -22.2% -13.3% -12.2% -11.3% -10.3% -9.7% Peso - Euro -1.5% -8.1% -7.4% -7.0% -6.8% -6.5% Change in forward currency rates
HENKELAG&CO.KGAA COMPANY REPORT
PAGE 17/32
for materials. Materials like oil and special chemicals are relevant for the production of most Henkel products and therefore prize changes can have notable influence on the COGS. Oil prices are expected to rise, as discussed in the following, and clearly affect the production costs for adhesives, whereas special chemical prices can fluctuate but will not have severe impacts on Henkel’s margin. Overall, we anticipate a very slight margin decrease in COGS until 2022 to 52.5% of revenue, after a spike to 52.7% in 2017. Graph 30 is the result of our benchmark analysis, which compares the COGS of Henkel with the average COGS of its peers in each segment. This illustrates that Henkel’s COGS can be replicated by the weighted average from the different sector averages. With Henkel’s average of 52.5% in COGS in the last 5 years they are slightly above the laundry care sector (50.4%) and are closer to the main segment adhesives (65.7%) than the beauty care sector (29.1%). The weighted average (by revenue) suggests historical COGS of 53.5%, which is just 1% point above the historic average of Henkel and may indicate efficiency efforts in manufacturing.
Despite efficiency efforts and the positive revenue forecast in the adhesive technology market, higher material costs may hinder profitability in the future. The cost side of adhesives, which is mainly driven by prices of raw materials that are derived from crude oil, so called petrochemicals, showed a positive development since the price drop of oil at the end of 2014. However, since crude oil prices have rebounded from their price low of $27 per Brent barrel at the beginning of 2016, we expect to see a decent continuation of the increase in raw material prices. Recently OPEC, Russia and nine other producers announced that they want to extend the agreement on oil supply cuts until the end of 2018. Following the agreement to cut oil production in the end of 2016, crude oil prices have been revived and inventories are slowly declining toward their five-year average. With the continuation of the cartel the crude oil prices are expected to increase and settle above the current level of around $65 per barrel. Many key commodity raw materials like ethylene or propylene (petrochemicals) have correspondingly shown significantly higher price levels in the last months. A further factor is the rising demand for such petrochemicals, which are also used in large industries like construction and transportation. Since the adhesive industry only makes up a small segment of this market, it tends to be a price taker rather than a price setter. Accordingly, high volatility in the raw material prices are a key factor that will probably hinder profitability in the adhesive segment of Henkel in the future.
Similar to the adhesive technologies sector, volatility in raw material prices can hinder growth and profitability of Henkel’s laundry and home care products, as
Graph 31 – Brent crude price in $ per barrel
Graph 30 – COGS of Henkel and peer groups in percent
Source: Bloomberg Source: Annual reports
HENKELAG&CO.KGAA COMPANY REPORT
PAGE 18/32
well as products from the beauty care segment. The key resource palm oil, of which the majority is palm kernel oil, forms the basis of many surfactants used in detergent and cosmetic products. In the recent past palm kernel oil has reached a higher price level prior to the years of 2016. However, after an interim high at the beginning of 2017 prices have recovered (see graph 32). In the short term, analysts forecasted a slight price increase of palm kernel oil until the mid of 2018. Due to limitations to acreage in the key supplier countries Indonesia and Malaysia, which produce about 90% of the global palm oil, prices also tend to increase in the long run.
Operating Expenditures
For the operating expenditures we identify different developments relating to administrative and research expenses and marketing, selling and distribution expenses. Latter represent the highest stake of Henkel’s operating expenditures as graph 33 shows on the left. In order to ensure comparability with peers, we combined administrative and marketing, selling and distribution expenses to sales, general and administrative expenses (SGA) as most of the analysed companies do not differentiate between these positions. Graph 34 on the left demonstrates that there have been only small changes in the SGA margins across all relevant sectors. While the beauty care peers have the highest SGA margin, due to above average expenses for advertising, the adhesive peers have the lowest margin, because of low advertising expenditures. Henkel’s average SGA margin (30.8%) however lies above the peers weighted average of 26% over the last years. This fact suggests that there is still potential for improvement in efficiency. Consequently, we expect to see a slight decline in Henkel’s SGA margin to 29.2% until 2022.
Going more into detail, the expenses for administration as percent of revenue have increased from 5.0% in 2012 to 5.7% in 2016 and we expect a settlement at this margin until FY22. Administrative expenses are not simply increasing with the size of Henkel, but also with its acquisitions. Many overhead functions consequently need to be consolidated, which decrease expenses in the long term, but not in the short term. As we assume a consistent acquisition rate of Henkel this has to be taken into account. More significant change, in terms of margins, will be likely to happen in the advertising expenses. Over the past 5 years the margin decreased from 26.1% in 2012 to 24.8% in 2016 and from our point of view this trend will continue. Alongside classic advertising and point of sale activities, advancing digitalization enables a significant increase in media efficiency. Additionally, co-operations with large online retailers like Amazon and
Graph 33 – Henkel’s operating expenditures in FY16 in %
Graph 32 – Palm kernel oil price in $ per metric ton
Graph 34 – Sales, general and administrative expenditures of Henkel and peer groups in percentage of revenue
Source: Bloomberg
Source: Annual report
HENKELAG&CO.KGAA COMPANY REPORT
PAGE 19/32
Alibaba push down distribution costs. Finally, we estimate a constant margin decrease to 23.6% of revenue until 2022.
Research and development are the last relevant expenses, which also influence Henkel’s innovation and competitiveness. There have been no significant changes in Henkel’s research and development margin as percentage of revenue over the last years, similar to the peers from various sectors. However, it is recognisable that research expenses in the adhesive sector require a higher amount of investments relative to the revenue compared to beauty and laundry sector. This is also in line with Henkel’s research and development expenditures, as the adhesive segment amounted for 62% of the investments although the revenue contribution was only 48% in FY16. For the future development of the research and development margin we expect to see a maintenance of the previous level at around 2.6%.
After taking into account all previous considerations, Henkel can improve its EBIT margin to 15.4% (see table 4). Following a weak slump in 2017 to 14.6%, due to higher COGS, the EBIT margin clearly exceeds the average of 14.1% of the previous 5 years, which is mainly attributable to relatively lower advertising and distribution expenses.
Graph 37 – Henkel’s total EBIT in € million and EBIT margin in percent (Source: Annual report, Analyst estimates)
Graph 37 summarizes the development of total EBIT and the EBIT margin over the last years and the forecast period. While the overall EBIT grew with a CAGR of 6% between 2012 – 2016, the pace is expected to clearly slow down until 2022 with an CAGR of 4.2%. This is attributable to the slowdown in revenue growth and in the EBIT margin. Latter has a limited scope for improvements in efficiency, with an exception of the mentioned marketing expenses.
The conduction of a peer analysis allows us to compare Henkel’s profitability to its competitors in the appropriate business segments and to evaluate the potential for improvement in efficiency. Graph 38 compares the EBIT margin of selected companies in FY16 that operate in all three segments of Henkel in
Graph 35 – Research and
development expenditures of Henkel and peer groups in percentage of revenue
Graph 36 – Research and
development expenditures of Henkel in FY16 by segment in percent
Source: Annual report Source: Annual reports
HENKELAG&CO.KGAA COMPANY REPORT
PAGE 20/32
combination with their revenue. Although there are partly large discrepancies between the margins, depending on size and sector of the companies, Henkel’s EBIT margin (14.8%) was just slightly below the average of 16.3%, suggesting further room for improvement. Over the next years, we expect to see an approach to the peers’ average.
Graph 38 – Henkel’s total Sales in € million, EBIT margin and Average EBIT margin in percent of selected companies in FY16 (Source: Annual reports)
Capital Expenditures
Henkel’s capital expenditures (CAPEX) have been highly volatile in the past due to high spending for acquisitions. In 2016 the peak of over €4.4 billion was reached when the ‘Sun Products’ was acquired. The CAPEX can be attributed to intangible assets or property, plants and equipment (PPE). While the investments in PPE have been constant with decent increases, the expenditures for intangible assets are depending on acquisitions and are therefore highly volatile (see graph 39). Our assumption of consistent acquisitions clearly flattens the CAPEX in the future, after 2017. Consequently, the CAPEX slowly increases from €1.2 billion in 2018 to almost 1.4€ billion in 2022. Each year includes CAPEX of €560 million for acquisitions at a constant level. The further rise in CAPEX is explained by expansion CAPEX that Henkel invests mainly in its PPE to create further production capacity. New plants are built especially in emerging countries like Russia, India and China, but also in developed countries like the USA. Additionally, to the plant expansions, inflation will increase overall expenditures. When comparing Henkel’s overall PPE as a percentage of revenue one can see that its PPE ratio is relatively smaller using a weighted average approach. Henkel’s historical average of 14.6% is much closer to the beauty sector (13.8%) than to the laundry sector (18.6%) or the adhesive sector (21.7%). This may suggest that Henkel has been able to manufacture its products more efficiently than peers, as the necessary amount of plants and equipment to generate revenue has been relatively lower. Nevertheless, the analysis captures a
Graph 40 – PPE of Henkel and peer groups by percentage of revenue in percent
Graph 39 – Henkel’s capital expenditures for intangible assets and PPE in € billion
Source: Annual reports Source: Annual report
HENKELAG&CO.KGAA COMPANY REPORT
PAGE 21/32
historically decent and consequent increase of the PPE to revenue ratio in all sectors and Henkel itself. For the future, we expect a slight decrease in FY17 in this ratio for Henkel as the revenue of ‘Sun Products’ will be incorporate, but PPE was already recognised in FY16. From FY18 onwards we expect to see a consequent increase, correspondingly to the overall industry trend, of the PPE ratio to 15.2% in 2022.
Return on Invested Capital
Furthermore, we analysed the return on invested capital (ROIC) of Henkel in comparison to its competitors to assess the company’s efficiency at allocating the capital under its control to profitable investments. With an average ROIC of 41% over the last couple of years, Henkel belongs to the companies with the highest potential for value creation. Considering Henkel’s WACC of 4.51% (for calculation details see the Valuation section) the investments were highly value creating as the cash flow for investors clearly exceeded its risks. Through the observed years occurs a conversion of the ROIC rates from Henkel, Reckitt Benckiser, L’Oréal and 3M, all settling at a similar level in FY16. Noticeable is the almost parallel development of 3M and Henkel, which may be explained to the high dependency on the adhesive business and similar efficiency.
Graph 41 – Return on invested capital (ROIC) of selected companies in percent (Source: Annual reports)
In our forecast, we predict that Henkel’s ROIC will settle slightly above the level of 2016 (39%). 2017 will represent the only divergence with a drop related to the high investments in the acquisition of ‘Sun Products’. However, the operating cash flow after tax is expected to follow up already in 2018 and push the ROIC towards its previous historical level of 41%, which we assume to be constant for the future. Consequently, the level of value creation will remain high.
Working Capital
The total working capital of Henkel has fluctuated around zero with a tendency to be negative in the recent past. While for most peers the working capital has been
0% 10% 20% 30% 40% 50% 2012 2013 2014 2015 2016
3M Avery Dennison HB Fuller Reckitt Benckinser Unilever Procter & Gamble L'oreal Beiersdorf Estee Lauder Henkel
HENKELAG&CO.KGAA COMPANY REPORT
PAGE 22/32
positive, there is no particular pattern identifiable. Whereas companies from the beauty care and adhesive business showed a positive working capital, especially 3M, laundry and home care companies tend to have a negative working capital.
Graph 42 – Average working capital in home currency billions of selected companies over the past 6 years (Source: Annual reports)
For the future we expect to see a continuation of fluctuations in Henkel’s working capital close to zero, meaning there is no definite convergence to the peers. Overall, we anticipate a little faster increase in trade accounts receivables compared to trade accounts payable and inventories. Although Henkel has short terms of payment in the beauty and laundry care segments, which serve mainly private customers, in the industrial segment of adhesive technologies, which has companies as customers, the terms of payments are longer. As this segment is the fastest growing in the future, trade accounts receivables will inflate correspondingly. Due to growing bargaining power, particularly in the adhesive business, trade accounts payable tend to follow. Inventories on the other hand increase at a slower pace, because the e-commerce channel will allow a more efficient distribution, especially in the beauty and laundry care segment.
Capital Structure
The current capital structure of Henkel with only 10% of debt slightly diverges from the weighted average capital structure (12.8% of debt) of the previously selected peers. Whereas companies from the laundry and home care business showed the highest leverage with a debt to equity ratio of 19.2% followed by the adhesive business (15.6%) and the beauty care business, which has clearly the lowest leverage (5.6%). Nevertheless, we expect to see a convergence of Henkel’s capital structure towards the peers average due to the dominant and growth driving adhesive business, in which leverage is higher than currently. Consequently, the target capital structure (11.1%) will be between the current one and the peers’ average with a debt to equity ratio of 12.5%. This ratio was also applied in the valuation (see below).
Graph 43 – Henkel’s capital structure at market value in percent
Source: Annual reports, Analyst estimates
HENKELAG&CO.KGAA COMPANY REPORT
PAGE 23/32
Valuation
In order to value Henkel we used a Discounted Cash Flow model. The forecasting period for the DCF model was set to 5 years until the year 2022. A top-down approach was chosen to forecast the company’s revenue and implicitly the free cash flow, in order to determine its enterprise value. We started from the overall market size, estimated Henkel’s market and how it will change in the next years and multiplied them to obtain the future revenue. Given the high complexity of Henkel, operating in different markets, we estimated the individual revenue for each region in all three segments to forecast more accurately. Additionally, we incorporated future revenue gains and losses attributable to acquisitions and exchange rate fluctuations that significantly differ over regions and segments.
Cost of Capital
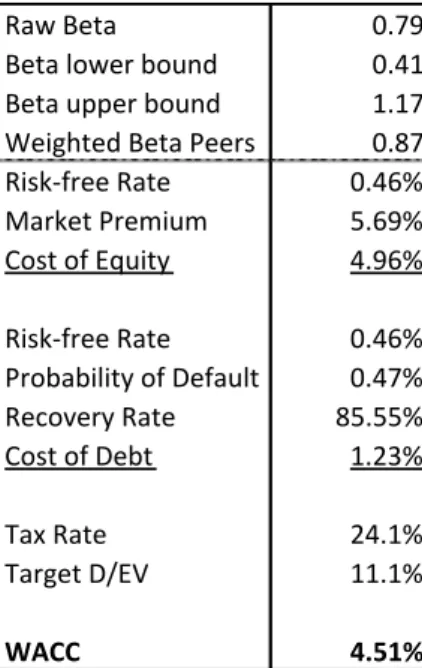
For the cost of equity we used the CAPM model by determining Henkel’s beta and ultimately its WACC. We used the current yield of the 10y German government bond as our risk-free rate with a value of 0.46%. In terms of market premium we used the latest published numbers of Mr. Damodaran for Germany with 5.69%. Finally, we conducted a beta analysis of Henkel’s stock returns with the MSCI World Index. We obtained a raw beta of 0.79, considering a target debt to equity ratio of 11.1%. This beta value seems reasonable, as our benchmark analysis from peers suggested just a slightly higher beta of 0.87. In order to determine the cost of debt, we took use the yield of Henkel’s bond with the longest maturity, in this case until 2022, corresponding to 1.3%. Subsequently we adjusted the yield considering a 5 year default probability of 0.5% according to Bloomberg and Moody’s 5 year recovery rate of 85.5% for similar companies. Taking into account these factors the cost of debt are 1.23% before tax. By taking Henkel’s average individual tax rate of the past 5 years we reached a cost of capital of 4.51% using the conventional WACC formula with the previously mentioned target capital structure.
Discounted Cash Flow
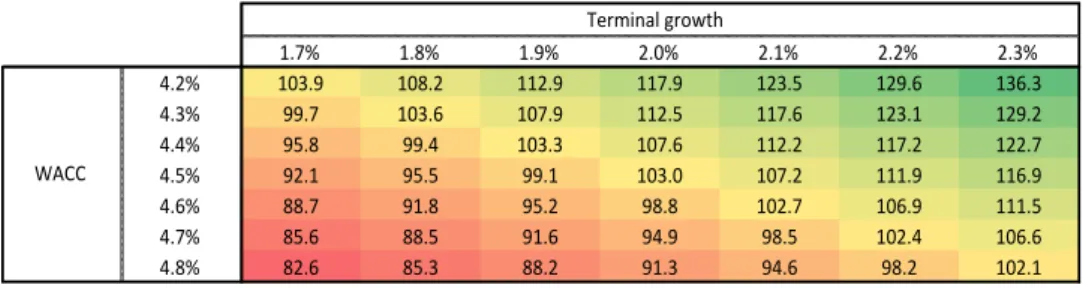
By discounting the future cash flows we assign Henkel an enterprise value of €48 billion. For the terminal value we assumed a perpetuity growth rate of 2%, which is equivalent to the target inflation of the European Central Bank. About 90% of the total present value are attributable to the terminal value, which shows that a high weight of Henkel’s overall value lies in the long-term future. Table 5 summarizes the price sensitivity of Henkel’s stock to changes in the WACC and the terminal value.
Top-down approach Raw Beta 0.79 Beta lower bound 0.41 Beta upper bound 1.17 Weighted Beta Peers 0.87 Risk-free Rate 0.46% Market Premium 5.69% Cost of Equity 4.96% Risk-free Rate 0.46% Probability of Default 0.47% Recovery Rate 85.55% Cost of Debt 1.23% Tax Rate 24.1% Target D/EV 11.1% WACC 4.51%
Table 4 – Inputs for cost of capital
Source: Annual reports, Bloomberg, Damodaran, Moody’s