Paula Tristão Santini, Ronei Aparecido Barbosa, Lorena Gabriela Almeida, Kamila Rezende Dázio de Souza4, João Paulo Rodrigues Alves Delfino Barbosa5,
José Donizeti Alves6 (Received: March 28, 2019; accepted: June 06, 2019)
ABSTRACT: The ecophysiological parameters of coffee canopy were mapped throughout the day. Therefore, evaluations were carried out in ‘Catuaí Vermelho’ Coffea arabica L., measuring 1.7 meters. A vertical gradient (from the apex to the base of the plant canopy) and a horizontal gradient (plagiotropic branches) were established to analyze different positions of the canopy. Thus, in the vertical direction, four heights were analyzed in the plant: top, upper, middle and lower regions. In the horizontal gradient, the plagiotropic branches were divided into three parts: basal, median and apical. Collection was performed on the east and west sides of the canopy, at four times of the day: 6 a.m., 9 a.m., noon, and 3 p.m., totaling 24 collection points at each time. Gas exchange, photosynthetically active radiation and leaf temperature were evaluated in each of the 24 points of the coffee canopy. The gas exchange characteristics of an individual coffee leaf diverge considerably from other leaves, which require caution when scaling estimates of leaf photosynthesis at the global canopy level. The analysis of some punctual leaves does not serve to discriminate the overall dynamics of a canopy.
Index terms: Coffea arabica, plant physiology, photosynthesis, canopy, solar radiation.
PADRÕES ESPAÇO-TEMPORAIS DA FISIOLOGIA DO CAFEEIRO
RESUMO: Os parâmetros ecofisiológicos da copa de cafeeiro foram mapeados ao longo do dia. Para tanto, as avaliações foram realizadas em Coffea arabica L. da cultivar Catuaí Vermelho, medindo 1,7 metros de altura. Um gradiente vertical (do ápice das plantas até a base da saia) e um gradiente horizontal (ramos plagiotrópicos) foram estabelecidos para analisar diferentes posições da copa. Assim, no sentido vertical, foram analisadas quatro alturas em uma planta: topo e regiões superior, intermediária e inferior. No sentido horizontal, os ramos plagiotrópicos foram subdivididos em três partes: basal, mediana e apical. A coleta foi realizada nos lados leste e oeste do dossel, em quatro horários do dia: 6h, 9h, 12h e 15h, totalizando 24 pontos de coleta em cada horário. Foram avaliadas as trocas gasosas, radiação fotossinteticamente ativa incidente e a temperatura foliar em cada um dos 24 pontos estabelecidos no dossel. As características das trocas gasosas de uma folha individual de cafeeiro divergem consideravelmente de outras folhas, o que requer cautela ao dimensionar as estimativas da fotossíntese foliar no nível global do dossel. Análises pontuais de folhas de cafeeiro não servem para discriminar a dinâmica geral de um dossel.
Termos de indexação: Coffea arabica, fisiologia vegetal, fotossíntese, dossel, radiação solar. 1 INTRODUCTION
The coffee tree canopy acquires a dynamism during its development, being modified by environmental conditions, physical structure, age and type of leaves (sun and shade leaves) (RODRÍGUEZ et al., 2011), besides the distribution and translocation of photoassimilates among different parts and heights of the plant. In this sense, inside the canopy, there are variations in the interception of solar radiation, interception of rainfall through foliage layers, wind speed, air temperature, canopy temperature, humidity, CO2 availability, nitrogen partitioning, pigment content, vapor pressure deficit and cell metabolism (CAMARGO, 2010). These variations interfere
1,3,5,6Universidade Federal de Lavras/UFLA - Departamento de Biologia/DBI - Cx. P. 3037 - 37.200-000 - Lavras - MG-
[email protected], [email protected], [email protected], [email protected]
2Universidade José do Rosário Vellano/UNIFENAS- Departamento de Agronomia - Rodovia MG 179, Km 0 - 37.132-440 -
Alfenas - MG - [email protected]
4Universidade Federal de Alfenas/ UNIFAL - Departamento de Biologia - Rua Gabriel Monteiro da Silva, 700 - Centro -
37.130-001 - Alfenas - MG - [email protected]
and modify the efficiency at which light is captured and its use by plants (NIINEMETS, 2007).
The coffee tree has a suitable architecture for light interception with upper branches with small angles to the orthotropic branch, leaves distributed over great vertical distances and conical structures, allowing the canopy to receive a moderate shade (CUNHA; VOLPE, 2010; RODRIGUES et al., 2016). However, it is known that there is greater photosynthetic rates in outer leaves of the upper third of the canopy (upper region or top) in relation to the shaded inner leaves of the middle third (CUNHA; VOLPE, 2010). The net photosynthetic rate of shaded leaves seems to be more limited by the low light availability for leaves than by stomatal conductance (ARAÚJO et
2 MATERIAL AND METHODS
The experiment was carried out in the middle of January 2015, in the Experimental Field at the Coffee Section of the Department of Agriculture (DAG), Federal University of Lavras (UFLA) (21o 14’ S and 45º 00’ W), at 918 m
altitude. The daily mean temperature was around 27 oC and RH was around 60% (INMET, 2015).
Aiming to create a map of the ecophysiological responses of a coffee tree, one ‘Catuaí Vermelho’ coffee tree (Coffea arabica L.), measuring 1.7 meters in height, was evaluated. The canopy of one coffee tree was evaluated in 24 different parts at four different times along the day, allowing to build a map of coffee ecophysiological behavior throughout the day.
The coffee canopy was divided into a vertical (from the apex to the base of the canopy) and a horizontal gradient (plagiotropic branches). Therefore, in the vertical gradient, four h eights were analyzed in the plant: top of the canopy, upper region, middle and lower region. For the horizontal gradient, plagiotropic branches were subdivided into three parts: basal (next to the orthotropic branch), median and apical (external part of the plagiotropic branch). Sampling was performed on the east and west sides of the canopy, at four times of the day: 6 am, 9 am, noon, and 3 pm, totaling 24 collection points at each time. al., 2015). In addition, a decrease in photosynthesis
in the afternoon has been associated to stomatal closure (MAYOLI; GITAU, 2012), besides the accumulation of soluble sugars in leaves.
Despite the spatio-temporal variations in the coffee canopy, the relationship between coffee tree architecture and light interception as well as the effects of management practices on radiation interception, have received little attention. Although few studies have described physiological variations in coffee canopy (ARAÚJO et al., 2008; CHAVES et al., 2012), the coffee tree physiology has been described punctually, considering only measurements based on samples of the middle third of the canopy. Nevertheless, due to the canopy dynamics, gas exchange and metabolism of an individual leaf can diverge considerably from the whole plant leaves. Thereby, it is necessary to correlate the spatio-temporal and physiological variations inside the coffee canopy and then create a map to understand coffee physiological variations, since there are variations in the canopy as a function of depth and height. Not only will the knowledge about physiological variations help studies related to plant metabolism, but it will also give clues about plant responses to climatic variations and plant production. Thus, the aim of this study was to evaluate and map the ecophysiological responses in the canopy of a coffee tree.
FIGURE 1 - Representative draft of the 24 parts of the coffee canopy sampled at each of the four times of the day: 6 am, 9 am, noon and 3 pm. The orthotropic branch is represented by the vertical dashed gray line and the plagiotropic branches are represented by the gray horizontal line. The vertical gradient consisted of top, upper, middle and lower branches (represented by the gray lines) and the horizontal gradient consisted of basal, median and apical portions (represented by the black dots) of the plagiotropic branches. Samples were collected from both eastern and western faces of the canopy.
One fully expanded leaf was sampled in each canopy position for measurements of gas exchange, water potential, photosynthetically active radiation and leaf temperature at each collection time.
Gas exchange evaluations were performed using an infrared gas analyzer (LI-6400XT Portable Photosynthesis System, LI-COR, Lincoln, USA) in fully expanded leaves of each portion. The evaluations were performed using a LED source and the photosynthetically active radiation (PAR) was 500 µmol m-2 s-1. Net photosynthetic rate
(A), stomatal conductance (gs), internal carbon concentration (Ci), and transpiration rate (E) were evaluated. Incident photosynthetically active radiation and leaf temperature were also analyzed in each canopy position.
The water potential was evaluated in a fully expanded leaf of each canopy position using a pressure chamber (PMS Instruments Company, USA) (SCHOLANDER et al., 1965).
The data were submitted to geostatistical analysis, with the SURFER 8.04 - Surface Mapping System software (GOLDEN SOFTWARE, 2004), using the kriging method. The semivariograms were calculated from the sampling data, so that a theoretical model was adjusted.
3 RESULTS AND DISCUSSION
Higher A rates were obtained at 9 a.m. and noon at the eastern side of the plant canopy (Figure 2A, B, C). An increase in A was also observed, from the basal to the apical region of the branches. Considering the vertical gradient, net photosynthetic rate varied in response to the time of the day: at 6 a.m., higher values occurred at the eastern side of the plant; at 9 a.m., it was concentrated at the top and upper branches; at noon, the lower branches showed higher A and, at 3 p.m., leaves from the top of the canopy showed the highest net photosynthetic rates (Figure 2D).
FIGURE 2 - Isolines of the net photosynthetic rates (A) of a coffee tree in different canopy positions and at different times of the day: 6 a.m. (A); 9 a.m. (B); noon (C); 3 p.m. (D). The numbers on the ordinates indicate the height of the plant (cm) and, in the abscissa, the length of the plagiotropic branches (cm), considering the 0/0 coordinates as the starting point of the stem system. The vertical line represents the orthotropic branch. UFLA, 2015.
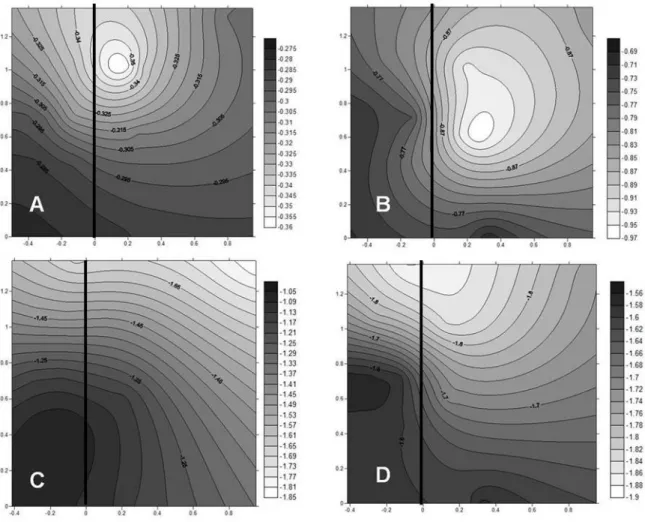
Leaf water potential also varied in response to the times of the day and canopy position (Figure 3). Higher water potential was observed in leaves from the western face of the canopy and in the middle and lower branches. The lowest water potential at 6 a.m. and 9 a.m were verified in leaves from the basal branches from the upper and middle portions of the canopy (Figure 3 A, B). At noon and 3 p.m. the lowest water potential was observed in leaves from the top of the canopy (Figure 3 C, D).
There were variations in stomatal conductance among the position of the branches and the time of the day (Figure 4). At noon, leaves from lower branches showed the highest stomatal conductance (Figure 4C). Nevertheless, only a few variations in gs between the sides of the coffee canopy were observed.
The internal carbon concentration was higher at 6 a.m. and lower at noon (Figure 5 A, C). Generally, branches from the western face and lower branches of the canopy showed the highest Ci concentrations (Figure 5 B, C, D), except at 6.am. (Figure 5A).
Transpiration rate was higher at the top of the canopy at 6 a.m. and 9 a.m. (Figure 6 A, B) and lower in branches since noon (Figure 6 C, D). The canopy showed a vertical and horizontal gradient of E rates, once the highest rates were observed in the top branches and at the apical portion of the plagiotropic branches.
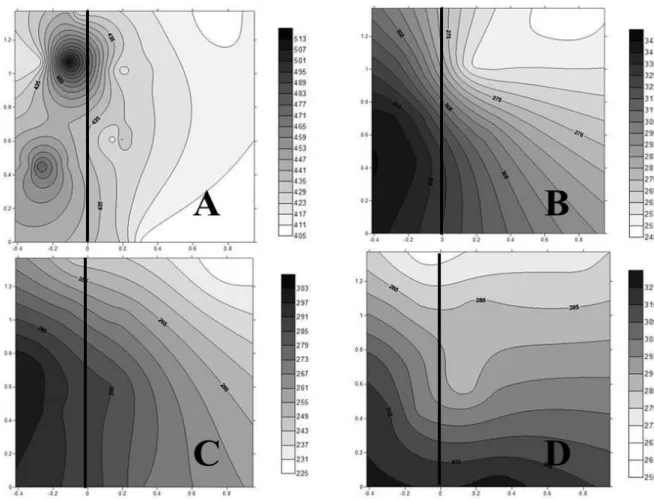
The incidence of photosynthetically active radiation was high at the top of the plant canopy and low at the western side and in the lower branches (Figure 7 A, B, C). At 3 p.m., when the highest PAR was at the western face of the canopy, a low radiation was observed in lower branches from the eastern side of the canopy (Figure 7D).
FIGURE 3 - Isolines of the water potential (ψw) of a coffee tree in different canopy positions at different times of the day: 6 a.m. (A); 9 a.m. (B); noon (C); 3 p.m. (D). The numbers on the ordinates indicate the height of the plant (cm) and, in the abscissa, the length of the plagiotropic branches (cm), considering the 0/0 coordinates as the starting point of the stem system. The vertical line represents the orthotropic branch. UFLA, 2015.yw
In a vertical gradient, PAR was gradually reduced from the top branches to the lower branches and from the apical (outer) region of the plagiotropic branch to the basal regions. Thus, the closer to the orthotropic branch, the lower the PAR at the coffee canopy. PAR reached the highest values at noon.
The leaf temperature was highly influenced by PAR since 9 a.m. Thus, higher leaf ToC were
observed in the top of the canopy (Figure 8 B, C, D). Conversely, the higher temperature at 6 a.m. was noted at the lower branches of the western side of the canopy (Figure 8 A). Under the higher PAR, at 9 a.m. and noon, there was a vertical and
FIGURE 4 - Isolines of leaf stomatal conductance (gs) of a coffee tree in different canopy positions at different times of the day: 6 a.m. (A); 9 a.m. (B); noon (C); 3 p.m. (D). The numbers on the ordinates indicate the height of the plant (cm) and, in the abscissa, the length of the plagiotropic branches (cm), considering the 0/0 coordinates as the starting point of the stem system. The vertical line represents the orthotropic branch. UFLA, 2015.
horizontal gradient, since the highest temperatures were observed at the top of the canopy and in the apical region of the plagiotropic branch. At 6 a.m. and 3 p.m., when PAR was lower, only a vertical gradient was observed. The range of temperature variation inside the coffee canopy was higher at 9 a.m. and noon, reaching 4 oC of difference.
The incidence of PAR and leaf temperature influenced net photosynthetic and transpiration rates in the coffee canopy. Light interception changes the balance of radiation and energy, once it depends on the characteristics of the canopy related to its architecture and dimensions (CUNHA; VOLPE, 2010).
FIGURE 5 - Isolines of the internal carbon concentration (Ci) of a coffee tree in different canopy positions at different times of the day: 6 a.m. (A); 9 a.m. (B); noon (C); 3 p.m. (D). The numbers on the ordinates indicate the height of the plant (cm) and, in the abscissa, the length of the plagiotropic branches (cm), considering the 0/0 coordinates as the starting point of the stem system. The vertical line represents the orthotropic branch. UFLA, 2015.
Therefore, the structure and thickness of the branches and shade leaves, as well as the density and width of the canopy (LONG et al., 2015), can reduce light interception in the canopy.
Since the microclimate inside the canopy can be considered as more conducive to photosynthesis, the lower values of carbon assimilation observed in the shaded leaves seems to be related to the low levels of PAR (5% of the radiation observed under full sun conditions). However, comparing the outer foliage of the lower layer and upper leaves of the canopy (lower interlayer leaves of 50-65% less irradiance than leaves at the top of the canopy), it is suggested that the intercepted PAR was not enough to stimulate leaf responses (MATOS et al., 2009).
On the other hand, the higher intensity of radiation received at 3 p.m. by the upper branches was related to the higher photosynthetic rate and lower internal carbon concentration in these
branches than in the lower ones. However, due to
its origin in protected habitats, it is already known that high photosynthetically active radiation (PAR) can be harmful to coffee plants and cause photoinhibition of photosynthesis (BATISTA et al., 2011). Thus, the photosynthetic rates at noon
and 3 p.m. were lower than at 9 a.m., probably due to the fact that PAR was higher, contributing to increase leaf temperature, which acts reducing the stomatal conductance in the whole coffee canopy (RODRIGUES et al., 2016).
In fact, the reduction in photosynthesis and in mesophyll conductance has been observed in coffee leaves under high solar radiation and leaf temperatures between 25 °C and 35 °C (DAMATTA et al., 2007). High temperatures are known to disturb plant metabolism, especially in C3 plants. Coffee cultivation in the open is the usual practice in Brazil, and this causes leaf exposure to high irradiance and the absorption of much more
Such conditions may cause an energy overcharge and leaf overheating which, in extreme
cases, can reach temperatures of 40 °C or even above, especially if stomata are closed, as occurs on sunny days in unshaded crops (RODRIGUES et al., 2018).
When considering biochemical levels, light excess and high temperatures lead to the reduction in biochemical phase of the photosynthesis due to enzyme activity reduction (Reviewed by YAMORI, 2016). Consequently, there is a reduction in photochemistry due to the lower demand of ATP and NADPH. Once there is high PAR incidence and higher leaf temperature, besides the damage
FIGURE 6 - Isolines of the leaf transpiration rate (E) of a coffee tree in different canopy positions at different times of the day: 6 a.m. (A); 9 a.m. (B); noon (C); 3 p.m. (D). The numbers on the ordinates indicate the height of the plant (cm) and, in the abscissa, the length of the plagiotropic branches (cm), considering the 0/0 coordinates as the starting point of the stem system. The vertical line represents the orthotropic branch. UFLA, 2015.
to cell membranes by temperature, high radiation interception by photosynthetic pigments can culminate in the generation of reactive oxygen species (ROS). ROS are highly reactive species that attack cellular targets such as membranes, proteins and DNA, causing extensive cell damage (MITTLER, 2017).
Modifications of the microclimate in shaded leaves generate lower temperature fluctuation, reduction in wind speed and greater relative humidity of the air, improving water use efficiency. It may also lead to greater stomatal opening, especially when soil water supply is not limiting (DAMATTA et al., 2007).
FIGURE 7 - Isolines of the photosynthetically active radiation incident (PARin) of a coffee tree in different canopy positions at different times of the day: 6 a.m. (A); 9 a.m. (B); noon (C); 3 p.m. (D). The numbers on the ordinates indicate the height of the plant (cm) and, in the abscissa, the length of the plagiotropic branches (cm), considering the 0/0 coordinates as the starting point of the stem system. The vertical line represents the orthotropic branch. UFLA, 2015.
These leaves of the inner layers have a microclimate more conducive to gas exchange, attenuating the adverse effects of the evaporative demand of the atmosphere, resulting in increments in water use efficiency (BATISTA et al., 2010). Temperature and relative humidity, but not irradiance, would be the most important environmental factors involved in the stomatal regulation of coffee (RICCI; JUNIOR; ALMEIDA, 2013).
In general, the gas exchange of coffee is limited by radiation and diffusive factors (CAVATTE et al., 2012) and, at 6 a.m., the limitation was imposed by the low light intensity. It should be noted that the lower stomatal conductance observed on the sunny side in relation to the left side is due to leaf heating, causing a
reduction in stomatal opening as a mechanism to avoid dehydration and, as a consequence of this reduction, lower values of stomatal conductance are observed (BALIZA et al., 2014).
The internal carbon dioxide concentration was inversely related to the net photosynthetic rate. Particularly at 6 a.m., stomatal conductance was practically uniform between both sides of the coffee canopy. Thus, it can be suggested that the photosynthesis in the upper region of the coffee tree on the western side of the canopy was limited by solar radiation and not by stomatal factors, which is in accordance with Araújo et al. (2008), who observed that a limiting factor for net photosynthesis of shaded leaves would be the low light availability and not stomatal conductance.
Stomata of coffee leaves are frequently closed early in the morning, with stomatal conductance reaching values as low as those reached in the afternoon (CHAVES et al., 2012). This is due to a strong stomatal sensitivity to the increase in vapor pressure throughout the day which restrain the influx of CO2 into leaves to a large extent, thus limiting photosynthesis, particularly in the afternoon (BATISTA et al., 2010; OTTO et al., 2013). An increased stomatal closure was observed throughout the day, with the lowest conductance at noon and 3 p.m.
Changes in water relations in the coffee tree are also of extreme importance, since small changes in water conditions can intensively reduce growth, even with the typical plant responses under these conditions, such as leaf wilt (SILVA; COELHO; SATO, 2008). Water potentials up to -1.0 MPa cannot influence photosynthesis in coffee leaves, which is reduced by 25% when the potential drops
FIGURE 8 - Isolines of leaf temperature (T oC) of a coffee tree in different canopy positions at different times of the day: 6 a.m. (A); 9 a.m. (B); noon (C); 3 p.m. (D). The numbers on the ordinates indicate the height of the plant (cm) and, in the abscissa, the length of the plagiotropic branches (cm), considering the 0/0 coordinates as the starting point of the stem system. The vertical line represents the orthotropic branch. UFLA, 2015.
to -2.0 MPa (RONCHI et al., 2015). On the other hand, even with the soil at field capacity, in the hottest hours of the day the leaf water potential can reach values close to -1.5 MPa (SILVA; COELHO; SATO, 2008). Leaf water potential contributed to limiting photosynthetic rates at noon and 3 p.m., when a leaf water potential from -1,5 MPa to -2,0 MPa was observed. The lower water potential was probably related to the lower stomatal conductance, leading to lower net photosynthetic rates, mainly at 3 p.m.
4 CONCLUSION
The gas exchange characteristics of an individual coffee leaf diverge considerably from other leaves, which require caution when scaling estimates of leaf photosynthesis at the global canopy level. The analysis of some punctual leaves does not serve to discriminate the overall dynamics of a canopy.
5 ACKNOWLEDGEMENTS
The authors would like to thank Coordenação de Aperfeiçoamento de Pessoal de Nível Superior (CAPES), Conselho Nacional de Pesquisa (CNPq) and Fundação de Amparo à Pesquisa do Estado de Minas Gerais (FAPEMIG).
6 REFERENCES
ARAÚJO A. V. et al. Microclimate and vegetative growth of conilon coffee consorted with banana trees. Coffee Science, Lavras, v. 2, p. 214-222, 2015. ARAÚJO W. L. et al. Limitations to photosynthesis in coffee leaves from different canopy positions. Plant Physiology and Biochemistry, Paris, v. 10, p. 884-890, Oct. 2008.
BALIZA D. P. et al. Sucrose metabolism in coffee trees under different levels of shading. Coffee Science, Lavras, v. 4, p. 445-455, Oct. 2014.
BATISTA K. D. et al. Photosynthetic limitations in coffee plants are chiefly governed by diffusive factors. Trees, New York, v. 26, p. 459-468, Apr. 2011.
BATISTA L. A. et al. Anatomia foliar e potencial hídrico na tolerância de cultivares de café ao estresse hídrico. Revista Ciência Agronômica, Fortaleza, v. 41, p. 475-481, 2010.
CAMARGO M. B. P. The impact of climatic variability and climate change on arabic coffee crop in Brazil. Bragantia, Campinas, v. 69, p.239-247, 2010.
CHAVES A. R. et al. Varying leaf-to-fruit ratios affect branch growth and dieback, with little to no effect on photosynthesis, carbohydrate or mineral pools, in different canopy positions of field-grown coffee trees. Environmental and Experimental Botany, Oxford, v. 77, p. 207-218, Apr. 2012.
CUNHA A. R., VOLPE C. A. Radiometric relationships in the upper third of the coffee canopy. Bragantia, Campinas, v. 69, p. 263-271, 2010.
DAMATTA F. M. et al. Ecophysiology of coffee growth and production. Brazilian Journal Plant Physiology, Viçosa, v. 19, p. 485-510, Dec. 2007.
INSTITUTO NACIONAL DE METEOROLOGIA – INMET (2015). Gráficos dos parâmetros diários da estação meteorológica de Lavras-MG em janeiro 2015. Disponível em: http://www.inmet.gov.br/sim/abre_ graficos.php. Acesso em 21 de maio 2019.
LONG N. V. et al. The Effects of Shade Tree Types on Light Variation and Robusta Coffee Production in Vietnam. Engineering, Amsterdam, v. 7, p. 742-753, Nov. 2015.
MATOS F. S. et al. Phenotypic plasticity in response to light in the coffee tree. Environmental and Experimental Botany, Oxford, v. 67, p. 421-427, Dec. 2009.
MAYOLI R. N., GITAU, K. M. The effects of shade trees on physiology or Arabica Coffee. African Journal of Horticultural Science. Kenya, v. 6, p. 35-42, June 2012.
MITTLER, R. ROS are good. Trends in Plant Science, London, v. 22, p. 11-19, Jan. 2017.
NIINEMETS Ü. Photosynthesis and resource distribution through plant canopies. Plant, Cell and Environment, Oxford, v. 30, p. 1052-1071, Sept. 2007. OTTO M. S. G. et al. Photosynthesis, stomatal conductance and productivity of Eucalyptus clones under different soil and climatic conditions. Revista Árvore, Viçosa, v. 37, p. 431-439, June 2013.
RICCI M. S. F., JUNIOR C. D. G., ALMEIRA F. F. D. Condições microclimáticas, fenologia e morfologia externa de cafeeiros em sistemas arborizados e a pleno sol. Coffee Science, Lavras, v. 8, p. 379-388, Jul/Sept 2013.
RODRIGUES W. P. et al. Stomatal and photochemical limitations of photosynthesis in coffee (Coffea spp.) plants subjected to elevates temperatures. Crop and Pasture Science, Clayton, v. 69, p. 317-325, Mar. 2018. RODRIGUES W. P. et al. Whole canopy gas exchanges in Coffea sp. is affected by supra-optimal temperature and light distribution within the canopy: The insights form an improved multi-chamber system. Scientia Horticulturae, Amsterdam, v. 211, p. 194-202, Nov. 2016.
RODRÍGUEZ D. et al. A coffee agroecosystem model: I. Growth and development of the coffee plant. Ecological Modelling, Amsterdam, v. 19, p. 3626-3639, Oct. 2011.
RONCHI C. P. et al. Respostas ecofisiológicas de cafeeiros submetidos ao deficit hídricopara concentração da florada no Cerrado de Minas Gerais. Pesquisa Agropecuária Brasileira, Brasília, v. 50, p. 24-32, Jan. 2015.
SCHOLANDER P. F., BRASTREET E. D., HAMMEL H. T. Sap pressure in vascular plants: Negative hydrostatic pressure can be measured in plants. Science, California, v. 148, p. 339-345, Apr.1965.
SILVA A. C. et al. Produtividade e potencial hídrico foliar do cafeeiro Catuaí,em função da época de irrigação. Brazilian Journal of Agricultural and Environmental Engineering, Campina Grande, v. 12, p. 21-25, 2008.
SURFER, Golden Software. Counting and 3D surface mapping for engineers, users guide. Golden Software, New York, v. 1, p. 462-483, 2004.
YAMORI, W. Photosynthetic response to fluctuating environments and photoprotective strategies under abiotic stress. Journal of Plant Research, Tokio, v. 129, p. 379-395, May 2016.