Own Brand Product Development
Optimization of the Development Process
Miguel Morais Gomes Cêra
Projecto – Empresa
Mestrado em Marketing
Orientador:
Professor Doutor José Crespo de Carvalho, Professor Catedrático do ISCTE-IUL, Departamento Marketing, Operações e Gestão Geral
Co-Orientador:
Professor João Faria Gomes, Professor Associado do ISCTE-IUL, Departamento Marketing, Operações e Gestão Geral
2
AGRADECIMENTOS
À empresa de grande distribuição na qual este projecto foi desenvolvido, o meu muito obrigado por toda a disponibilidade manifestada e ajuda concebida.
Ao Professor Doutor José Crespo de Carvalho e ao Professor João Faria Gomes, agradeço os conselhos e ensinamentos transmitidos, o apoio demonstrado, acompanhamento e dedicação.
3
INDEX
CONTENT:
1. ABSTRACT ... 5
2. EXECUTIVE SUMMARY ... 6
3. SETTING THE CONTEXT OF THE PROBLEM ... 8
4. LITERATURE REVIEW ... 9
4.1. Brand ... 9
4.1.1. Brand definition... 9
4.1.2. Brand Identity and Brand Image ... 9
4.1.3. Own Brand / Private Label ... 10
4.2. New Product Development Process ... 10
4.2.1. Product ... 11
4.2.2. Doing it Right - The Stage-Gates ® Process ... 11
4.3. Innovation Success ... 21
4.3.1. Managing Product Life Cycle ... 21
4.3.2. Product Data Record ... 22
4.4. Open Innovation: Connect & Develop... 24
5. CONCEPTUAL FRAMEWORK OF REFERENCE... 28
6. METHODS AND TECHNIQUES OF DATA COLLECTION ... 29
7. INFORMATION ANALYSIS AND CONCLUSIONS ... 30
7.1. Own Brand Product Development Process Analysis... 30
7.1.1. Need Release ... 31
7.1.2. Validation and Product Development ... 33
7.1.3. Release / Commercialization ... 35
7.2. Analysis to the Overall Average Time for Product Development in the 1st Quarter of 2012 ... 36
7.3. Analysis of the number of processes in the 1st Semester of 2012 ... 39
8. METHODS OF IMPLEMENTATION ... 46
8.1. New flowchart process operation ... 47
8.2. The Product File – Fact Sheet Release ... 48
8.3. Database ... 49
9. CONCLUSIONS ... 52
4
11. ATTACHMENTS... 57
11.1. TOP 25 - Turnover (€ Million) - Portugal ... 57
11.2. TOP 10 Food Turnover (€ Million) – Portugal ... 58
11.3. TOP 15 Non-Food Turnover (€ Million) – Portugal ... 58
11.4. Overall Average Time for Product Development in the 1st Quarter of 2012 . 59 11.5. Overall Average Time for Product Development in the 1st Quarter of 2012 . 59 11.6. 2011 & 2012 Total Processes in Quality Control Department ... 60
11.7. 1st Semester of 2012 – Product Development Total Processes in Product Development Department ... 60
11.8. Product Development started in 2011 that passed to 2012 in Product Development Department ... 61
11.9. Product Development started in 2012 in Product Development Department 61 11.10. New flowchart of the process ... 62
5
1. ABSTRACT
The main purpose of this study was to optimize the process of developing and launching new own brand products in the Perishable Commercial Department from a large retail company in Portugal. Specifically, study the process currently in use and identify its weakest points, in order to make it faster and more efficient.
Data selection was carried out and a methodology for its analysis was established, in order to achieve the company’s goals and concerns, namely, the importance of launching the best products as quickly as possible to the market.
SUMÁRIO
O grande objectivo deste projecto consistiu em optimizar o processo de desenvolvimento e lançamento de novos produtos de marca própria na Direcção Comercial de Perecíveis de uma grande empresa de retalho em Portugal. Mais concretamente, estudar o processo actualmente em prática e identificar os seus pontos fracos, de forma a torná-lo mais rápido e eficiente. Foi necessário proceder a uma selecção dos dados a utilizar, estabelecer uma metodologia de análise e ir ao encontro dos interesses e preocupações da empresa, nomeadamente a importância de lançar os melhores produtos da forma mais rápida possível para o mercado.
6
2. EXECUTIVE SUMMARY
The main challenge of any retail company is to satisfy the needs of its client, to fidelize and win their trust. Their true ambition is to continuously search to offer the right product, in the right time and place, and with minimum costs.
With the advent of a new strategy made by some retail companies, the use of a private label became a following example worldwide; the supplier brand became the retailer brand. Having the power of distribution on its side, the retailer was easily able to convince its suppliers to sell their products through its brand and with a significant decrease on the costs. The suppliers did not have much of a choice; not acceptance would increase their losses and they would not be able to drain their products into the market.
Regarding the retail companies, the amount of products that they would have has their own brand and the ability to manage them, led to a significant change of its structure and skills. In addition to all logistics and storage procedures already existent, now they are faced with a new one: the own brand product development and launch, and the management of each. It was at this point that these companies realized one of the great difficulties that all types of production companies face: the time spent developing its own products and putting them into the market.
Any company producing any kind of product wants to see it being produced quickly and entering the market as soon as possible. Furthermore, they also want their products to have the best quality possible to meet the consumer expectations. To make it possible, the company has to be structurally organized and prepared for any challenge that would come, regarding the development of their products.
This study was conducted in a business environment, by carrying out a five-month-traineeship in a large retail company. With allowed access to all company’s data, the main objective was to optimize the process of developing new own brand products, assuring the quality of the process in all its stages.
After the literature review on the subject and a period of acquiring knowledge about the company's business, it was clear the need to develop a new type of procedure, based on the one in current use, by setting timings for each stage of the process and developing a new database that could be shared through all the teams responsible for the Perishable Commercial Department.
7 By so, it was intended to elaborate a methodology that allows a full understand about the best strategies to take into account for the process, in order for it to be more efficient. All results are demonstrated, and conclusions drawn.
Key-words: Product Development, Product Lifecycle Management, Product Launching and
Reduce Time do Market.
JEL Classification System:
8
3. SETTING THE CONTEXT OF THE PROBLEM
The context of the problem studied in this investigation is the result of a constant concern for companies, both national and international, in developing and launching their products more efficiently and quickly into the market.
In Portugal there are three retail companies leading the retail market: Sonae (Continente), Jerónimo Martins (Pingo Doce) and Auchan (Jumbo – Pão de Açúcar). According to APED, in 2010, Sonae led the ranking of companies in the retail sector, by turnover, with 5.203 million euros. Jerónimo Martins is in second place with 3.453 million euros and the Auchan group appears in third place with 1.601 million euros (Annex 11.1). Making the distinction between retail food and non-food, in 2010 the insignia Continente led the ranking with a turnover of 3.555 million euros and, in the second, there is the Worten with 765 million euros (Annexes 11.2 and 11.3).
This study rests on the Commercial Department of Perishable Goods of a great food retail company, which integrates six business units (Butcher, Fish, Delicatessen, Bakery and Confectionery, Fruits and Vegetables and Take-Away), who are directly responsible for the commercial management of the products, and four other support units: Procurement, Quality Control, Product Development, and Supply and Inventory Department.
By so, this study focuses on a solution that companies should adopt in order to provide the best products on the market that meet the customers’ needs and expectations.
9
4. LITERATURE REVIEW
The literature review presented below exposes the main concepts in the area of New Product Development and exposes the major theories of development models, in order to better fit the purpose for which we propose in this dissertation: Own Brand Product Development – Optimization of the Development Process.
A proper definition of concepts involved in the field of study is complex but necessary, in order to maintain a conceptual consistency throughout the work.
4.1. Brand
4.1.1. Brand definition
The brand is and has been defined in many different ways over the years, depending on the perspective from which the brand is perceived. Often that depends on the academic background of the author/originator of the different definitions (Tilde Heding, Charlotte F. Knudtzen, Mogens Bjerre, 2009).
Stephen King of WPP Group, London, differentiates brand and product as: A product
is something made in a factory; a brand is something that is bought by the customer. A product can be copied by a competitor; a brand is unique. A product can be quickly outdated; a successful brand is timeless.
Philip Kotler, Kevin Keller and David Aaker refer in their books to the American Marketing Association’s definition of a brand: A brand is a name, term, design,
symbol, or a combination of these intended to identify the goods and services of one seller or group of sellers and to differentiate them from those of competition.
A brand is essentially a company's promise to provide a particular series of attributes, benefits, values and uniform services to consumers (Kotler, 2004).
4.1.2. Brand Identity and Brand Image
If a company treats a brand only as a name, is totally wrong. The challenge in establishing a brand is developing deep positive associations about it. Marketers must decide at what level to anchor the brand identity (Kotler, 2004).
10
The brand identity should be formed by the physical aspects of the company, by its character and values, by their mission and also by the variables of the marketing mix. It is the concept of the issuer. The brand image is the way the brand is identified and seen by the consumers. It is the concept of the receiver (Mercator XXI, 2004).
In order to create a unique and strong brand, the development of brand identity and brand image is essential (Mercator XXI, 2004).
4.1.3. Own Brand / Private Label
Keith Lincoln and Lars Thomassen define as retailer brands: Brands owned and sold
by the retailer and distributed by the retailer. Private Label covers all products that are produced by, or on behalf of, a specific retailer for sale in their stores (Keith
Lincoln and Lars Thomassen, 2008).
Private label is define as brands that are owned, controlled, merchandised, advertised, priced and sold by the retailer in his store. (Ray Rajesh, 2010).
Other commonly used terms include “store brand” and “own label” but if we want a simple definition, it is that private labels are retailer brands (Keith Lincoln and Lars
Thomassen, 2008).
4.2. New Product Development Process
Today, time is on the cutting edge of competitive advantage. The way leading companies manage time – in production, in sales and distribution, in new product development and introduction – are the most powerful new sources of competitive advantage (Robert J.
Dolan, 1991).
New product development (NPD) is widely recognized as an important source of competitive advantage, and emphasis is being placed on systems which simultaneously provide quality, variety, frequency, speed of response and customization (John Bessant
and David Francis, 1997).
To Avan R. Jasswalla and Hemant C. Sashittal (2000) speed has become a source of
competitive advantage. In the pursuit of accelerating new product development, many are entrusting product innovation to cross-functional teams, which often include not only
11
representative from multiple functional groups, but also from leading suppliers, customers, and re-sellers.
In a turbulent, competitive environment in which customers are demanding and speed is essential, the underlying source of superior performance is integration…linking problem-solving cycles, bringing functional groups into close working relationships, and achieving a meeting of the minds in concept, strategy, and execution (Robert J. Dollan, 1991).
To meet these challenges, companies’ attention has been placed on internal mechanisms (cross-functional teams, advanced tools, current engineering, etc.) in order to optimize the NPD process.
4.2.1. Product
According to Levitt (1981), a product is all the satisfaction of values that a consumer obtains, in an organizational and / or personnel level. Product is also defined as
something that can be offered to satisfy a need or desire (Kotler, 1995: 26). The
product can be understood as a set of attributes (features, functions, benefits and uses) likely to use or exchange, usually in the form of combined tangible and intangible ways (Levitt, 1981).
The concept of new product, according to Kotler (1995), covers original products,
modified products and new brands that companies develop, using the efforts of its own R&D departments (pp.278). We can also consider a new product as a product (good or
service) new to the commercialization of a company, thus excluding, products that are only different in the way of promotion, repositioned products. (Crawford, 1991). As for the Degree of Product Innovation, this can have a wide variation. According to their degree of innovation, the product may be regarded as a breakthrough lower, medium or higher.
4.2.2. Doing it Right - The Stage-Gate® Process
With shorter life cycles and demand for greater product variety, pressure is also placed upon NPD systems to work with a wider portfolio of new product opportunities and to manage the risks associated with progressing these through development to launch. To deal with this, attention has focused on systematic screening, monitoring
12
and progression frameworks such as Cooper’s stage-gate approach (John Bessant and
David Francis, 1997).
As the need for product innovation has never been greater, and as Dr Robert G. Cooper argues (2000), there are two ways for companies to win at product innovation:
doing projects right and doing the right projects. To do projects right means that
leading companies have focused on the process of innovation, re-engineering their new product process: Many companies now utilize a Stage-Gate® new product
process to drive their new-product projects to market quickly and successfully
(Cooper, 2000: 3). Doing the right projects, the second way to win, means that management focuses on project selection for product innovation, very important and useful for this project, in order to implements the portfolio management principle. Product life cycles are shorter than ever and new products make the old ones obsolete.
4.2.2.1. New Products – Critical Success Factors
Delivering a differentiated product with unique costumer benefits and superior value is, for Cooper (2000), the top success factor once such superior products have five times the success rate, more than four times the market share and four times the profitability of products that lack this ingredient. The message from Cooper to seek differentiated, superior products, based on the idea that we should spare no effort in the search for product advantage. Build in a user
needs-and-wants study early in your new-product process in order to identify the components of a truly superior product. Use “fly-on-the-wall” or “camping out with the customer” research to identify his or her true and often unarticulated needs. Conduct a thorough analysis to identify weaknesses in your competitors’ products.
(Cooper, 2000: 4). And once we get the concept of a viable product, we must constantly test with the costumer through concept tests, protocep tests, rapid prototypes and full-product tests.
13 Secondly, it is important to have a solid pre-development homework that drives up new product success rates significantly and is strong correlated to financial performance. For Cooper (2000), must be devoted more time and more resources to the activities that precede the design and development of the product: Up-front
homework means undertaking thorough market and competitive analyses, research on the costumers’ needs and wants, concept testing, and technical and operations feasibility assessments. (Cooper, 2000:4).
Also, for the new product process, the voice of the costumer must be an integral part. At the same time, it is really important a sharp definition of the product including, according to Cooper (2000), a target market definition, a product concept and benefits to be delivered, the positioning strategy, and the product features, attributes, performances requirements and high-level specs.
Another pertinent conclusion of the author (Cooper, 2000) is that a marketing plan is an integral part of the new product process, and it should begin early. Also and very important, we should build trough Go/Kill decision points into our process (a funnelling approach), moving towards effective portfolio management, where we can view each new-product project as an investment.
It is also crucial an organization around true cross functional project teams, where functional managers must increasingly play the role of resource providers to project teams and team advisers, rather than bosses. For the launch of new products, there must be a strong fit between the needs of the new-product project and the resources, strengths and experience of the company in terms of marketing, distribution, selling, technology and operations. So, as it is fundamental to attack from a position of strength, it is also important to build an international orientation into the new product process, which means defining the market as an international one and designing products to meet international requirements, not just domestic ones. (Cooper, 2000).
Finally, the role of top management is central to success. Top-management
support is a necessary ingredient for product innovation, though it must provide the right kind of support. (Cooper, 2000: 6).
14
4.2.2.1.1. Building the success factors into a new product game plan – The Stage-Gate® Process
A Stage-Gate®1 process is a conceptual and operational road map for moving
a new-product project from idea to launch, improving effectiveness and efficiency, and breaking the innovation process into a predetermined set of stages, each one consisting of a set of prescribed, cross-functional and parallel activities, as we can see in Figure 1.
Figure 1 – The Stage-Gate ® Process
Source: Cooper, Rober G. (2000), “Doing it Right: Winning with New Products”, Product Innovation Best
Practices Series, Product Development Institute Inc.
At the entrance to each stage is a gate, which serves as the quality control and Go/Kill check point in the process (Cooper, 2000).
Stages are where the action occurs and the players on the project team undertake key tasks to gather information needed to advance the project to the next gate or decision point. Stages are cross-functional, meaning that each stage consists of a set of parallel activities undertaken by people from different functional areas in the firm, working together as a team and led by a project team leader.
In order to drive down the technical arid business risks via a Stage-Gate method, the parallel activities in a certain stage must be designed to gather vital information (technical, market, financial, operations). Each stage costs more
than the preceding one, so that the game plan is based on incremental
1 Stage-Gate® is a registered trademark of the Product Development Institute Inc. It is a process developed by Cooper in 1988 to conceive, develop and launch new products.
15
commitments. As uncertainties decrease, expenditures are allowed to mount and risk is managed. (Cooper, 2000: 7).
The key stages are five, and they consist in (1) a quick investigation and
sculpting of the project; (2) in building the business case, with a defined product, a business justification and a detailed plan of action for the next stages; (3) in the actual design and development of the new product, mapping out the manufacturing process, developing the marketing launch and operations plan, and defining the test plans for the next stage; (4), in testing and validation of the proposed new product; and finally (5) in the full commercialization of the product (Cooper, 2000).
Preceding each stage is an entry gate, a Go/Kill decision point, as we can see in Figure 1. To the success of a fast-paced, new product process effective gates are central, as they serve as quality-control checkpoints, and as Go/Kill and prioritization decision points, providing the funnels where mediocre projects are successively culled out. According to Cooper (2000), gates are where the path forward for the next stage is decided, along with resource commitments:
Gate meetings are usually staffed by senior managers from different functions, who own the resources the project leader and team require for the next stage. These decision-makers are called “gatekeepers. (Cooper, 2000: 8).
If a business does not have a systematic Stage-Gate process in place, or if the process is creaky or broken, the time is ripe for an overhaul. Those firms that have made the effort to design and implement such a process have reaped the benefits faster: They are more successful and enjoy more efficient product developments (Cooper, 2000).
In 2006, Cooper moves forward with the proposal to integrate principles of NPD in new-product methodology, resulting in a next generation idea-to-launch process, or NexGen Stage-Gate. Principles as “costumer focused”, where the costumer becomes an integral part of the entire process: scoping, product definition, development, validation, and beyond, which begins with the quest for unique, superior products; as “front-end loading”, which means that a
16
and producing higher success rates (Cooper, 2006); as “spiral development”, a
series of build, test, obtain feedback and revise iterations or loops; as “a holistic approach”, where the number one key to reduce cycle time and promptly getting to market focuses on the core team, an effective cross functional group that remain involved from start to finish; as “metrics, accountability, and continuous improvement”, because as Cooper (2006) argued: “you can’t manage what you don’t measure”. The point is that continuous learning and improvement becomes an integral, routine facet of the development process: every project is executed better than the one before. Top performing companies measure how well individual projects perform by building post-launch and gate reviews into their idea-to-launch processes, and hold teams accountable for delivering promised results against these metrics. “Focus and effective portfolio management”, and “a lean, scalable, and adaptable process”, are also part of the principles of next generation of idea-to-launch process (NexGen Stage-Gate). As Cooper claimed (2006), by moving toward NexGen processes, companies can make Stage-Gate even more effective. The process must be lean, scalable, and adaptable, ensuring that each principle becomes ingrained in the process’ language and method of operation. Success in product innovation requires many behavioral changes, such as discipline; deliberate, fact-based, and transparent decision making; responsible, accountable, effective, and true cross functional teams; continuous improvement and learning from mistakes; and risk taking and risk awareness.
The structure and content of Stage-Gate is a vehicle for change: altering how people think, acts, decide, and work together (Cooper, 2006).
4.2.2.2. Portfolio Management
The second way to win with a new product is to pick the right projects, complementing a Stage-Gate process with project selection and portfolio management.
Portfolio management deals with the vital question: How should the corporation most effectively invest its R&D and new-product resources? Much like a stock market portfolio manager, those senior executives who optimize their R&D investments - define the right new product strategy for the firm, select winning new
17
product projects and achieve the ideal balance of projects - will win in the long run. (Cooper, 2000:10).
In portfolio management there are four goals. Firstly, the goal is to ensure that the total worth of new product projects in the development pipeline yields maximum value to the corporation. To maximize the value of the portfolio, one should try to combine the use of a financial model with a scoring model. Secondly, the goal is to achieve the right balance of projects, balancing between high-risk and low-risk, short-term versus long-term, genuine new products versus product improvements and extensions. Achieving a strategically aligned portfolio, where all the projects are on strategy, and where the spending breakdown mirrors the strategic priorities of the business, is also a goal in portfolio management, being necessary to develop a product innovation and technology strategy, to build strategic criteria into the project selection approaches, so that all projects are “on strategy”, and to ensure that spending splits by arena and by project type mirror the desired splits and strategy (Cooper, 2000).
Lastly, the aim is based on resource balancing, seeing the correct balance of projects – resource demands with resources available.
Robert Cooper and Scott J. Edgett, in their article “10 WAYS to Make Better Portfolio and Project Management Selection Decisions” (2006), present the 10 best practices of the best companies, with regard to portfolio management and project selection. Under the NPD, is a real challenge to be affective in project selection and resource allocation. As we can see in Figure 2, only 21% of businesses’ portfolios contain high value-to-the-business projects, only one in four businesses effectively rank and prioritize their projects, less than one business in five has the right balance in projects in its development portfolios, and 76% of businesses have too many projects for the resources available, which means that projects are under-resources, as it was argued by Cooper and Edgett (2006), and only 21% have a systematic portfolio management or project selection system in place.
On the other hand, companies that are doing well at NPD, also shown in Figure 2, have superior portfolio management practices. Although far from perfect, these
18
best performers effectively rank and prioritize projects, and they boast a systematic portfolio management system much more so than do worst performers2
(Cooper & Edgett, 2006).
Figure 2 – Portfolio Management Practices
Source: Cooper, Robert G. & Scott J. Edgett (2006), “10 WAYS to Make Better Portfolio and Project Management Selection Decisions”, Product Innovation Best Practices Series, PDMA Visions Magazine.
To transmit the secrets of those businesses that achieve superior portfolio and NPD results, Cooper and Edgett (2006) show and explain the 10 best practices that leading companies use to improve their project selection methods.
According to studies conducted by Cooper and Edgett, 10 practices improve a company’s portfolio management: The first one, Focus on data integrity;
front-end load the project, focuses on the fact that the lack of good, early information
plagues many companies’ new product projects. In order to get better data for more effective project-selection, it is necessary to make sure information needs are defined for each of the Go/Kill decision points or gates, and these information
requirements should be spelled out in the form of gate deliverables for each of the gates in the business’s gating process (Cooper & Edgett, 2006). It is also
imperative, to achieve this first best practice, to front-end load your projects (Cooper & Edgett, 2006), that is, to move the center of gravity of the work effort
2 As Cooper and Edgett explained, here “best” and “worst” performers were identified on a number of productivity metrics including: NPD profitability versus funds spent; NPD profitability versus competitors; percentage of NPD projects meeting sales and profit targets; and on-time performance).
19 forward. Before a project moves into the development phase, it must be placed much more management emphasis on doing the up-front or front-end homework. The second best practice according to Cooper and Edgett (2006) is based on install
a systematic idea-to-launch process and make the gates work, namely, as it was
earlier explained, install an idea-to-launch process or Stage-Gate system, which helps to ensure that better information is available at gates, by defining what key tasks should be undertaken in each of the stages of the project, and by specifying deliverables (what information is really needed at each gate).
Thirdly, adopt an incremental commitment or “options” approach, is a practice that has the goal to build in a series of Go/Kill decision points, with each successive gate involving more and more resource commitments, and as resource commitments increase at successive gates, information is better and uncertainties are reduced and risk is managed. As the authors (2006) refer, the mistake that a lot
of management makes is to make an irrevocable “Go decision” on a NPD project very early in the project when relatively little is known, and then never seriously consider stopping or killing the project once past this initial Go decision (Cooper
& Edgett, 2006).
This best practice is directly related to the fourth one, that is know when to walk
away, which means that Go/Kill meetings must yield some kills, and unless some
projects are stopped, according to the authors, the gatekeepers are not doing their job.
The fifth practice, one size does not fit all, means that criteria to evaluate and select different categories must be different, because there are huge differences
between small incremental projects, genuine new products, and platform developments (Cooper & Edgett, 2006). The solution, put forward by the authors,
is to categorize the developments projects into buckets, such as: New products;
Platforms and technology developments; Improvements, modifications, and extensions; and Costumer requests. And the point is to use different criteria for
each bucket.
There is no one best way to pick projects, so triangulate, is the sixth best practice
20 somewhat unreliable, and considering using multiple selection methods in combination.
Another practice suggested by the authors is to try scorecards, one of the top-rated
but overlooked methods. As it is said, although scorecards are not the most popular Go/Kill decision tool, they produce surprisingly good results in terms of the resulting portfolio of projects. Based on the theory that if you can explain success, then you can predict success, the gatekeepers’ score the project on six to
ten key evaluative criteria and the resulting scores are then combined to yield an overall project attractiveness score. This scoring exercise and final score become
key inputs to the Go/Kill decision. (Cooper & Edgett, 2006).
Use success criteria, too. This eighth practice pointed out, the use of success
criteria, is employed with considerable success at firms, such as P&G, and typically include metrics on profitability, first year sales, launch date, and expected interim metrics, such as tests market results. Although this method does have risks, and its use should be reserved for businesses with considerable experience with gating systems, it allows the project team to custom-tailor criteria to suit the nature of its project, and it forces the team to make much more realistic and accurate sales, costs, and time projections, which provide better data for management to
make the Go/Kill decision (Cooper & Edgett, 2006).
Another practice that leading companies use to improve their project selection method, is to use the right financial approaches, suggesting the Productivity Indezz, as an extension of the Net Present Value (NPV). The Productivity Index is a financial approach based on the theory of constraints, and as it is argued, “in order to maximize the value of your portfolio subject to a constraining resource, takes the factor that you are trying to maximize and divide it by your constraining resource.” (Cooper & Edgett, 2006). Then the project should be ranked, where those projects at the top of the list are Go projects, are resourced, and accelerated to market. This method is designed to maximize the productivity of a portfolio.
Build in periodic portfolio reviews to force rank your projects, the tenth practice
exposed, has the goal to correct the “yea-saying tendency”, using portfolio reviews in conjunction with gates. “Portfolio reviews are typically held about four times
21 per year” (Cooper & Edgett, 2006) , as it is important to ensure that a business has the correct set of Go projects, the right mix and balance of projects, the right priorities and the resources to undertake these Go projects.
4.3. Innovation Success
The success of new products (New Product Success) requires a degree of excellence in three areas stipulated by Perry & Chochet (2009): (1) Reducing product development
cycle time, (2) Increasing product development innovation, and (3) reusing company knowledge assets (pp.115).
Cycle time or time-to-market determines the time it takes a company to recoup its
investment in a new product. Increased product development innovation determines the extent of a product that consumers can earn and maintain this consumer base. The ability
to reuse knowledge assets leads us to lower costs in product development, re-creating
existing knowledge. (Perry & Chochet, 2009). This way, companies, to succeed in these three areas, should look at the factors that fuel innovation: people, knowledge, and systems.
In the XXI century, the state of innovation has been rocked by market needs even better success rates for new, better and more sustainable. To this end, the practice begins to emerge Product Life Cycle Management (PLM), constituting itself as a key innovation these days.
4.3.1. Managing Product Life Cycle
In order to better understand how Product Life Cycle Management (PLM) has emerged as a key factor for innovation, Perry & Cochet (2009) explore the history of the formulation and design of the product, i.e., how we were creating the tools for managing PLM, investing R&D.
When an organization begins to move forward with the process of formulation and design of a product, the impact will be spreading beyond R & D. Naturally grows the ability to create connections and interactions around a broader set of business functions, such as packaging, design, marketing, and manufacturing, in order to bring a new product to market.
22 In this way, and now towards a transformation of the enterprises themselves in the direction of PLM, starting by giving value to this discipline as a way to significantly improve its area of product development, these began to raise questions such as: How
good are our processes?; What are our strengths and where are processes underdeveloped?; How does our company compare against the best in our industry?; Which companies excel in organizing their product development resources and what benefits do they get as a result? (Perry & Cochet, 2009: 118).
In order to respond to many innovation challenges caused by competitive environments, companies had to constantly reduce cycle times and time-to-market, improving the quality and safety of the product and increasing his income, and ensuring that they were offering products that a costumer would buy. Were then developed platforms known as PLM solutions by incorporating complex networks of both point-solutions and collaboration work processes.
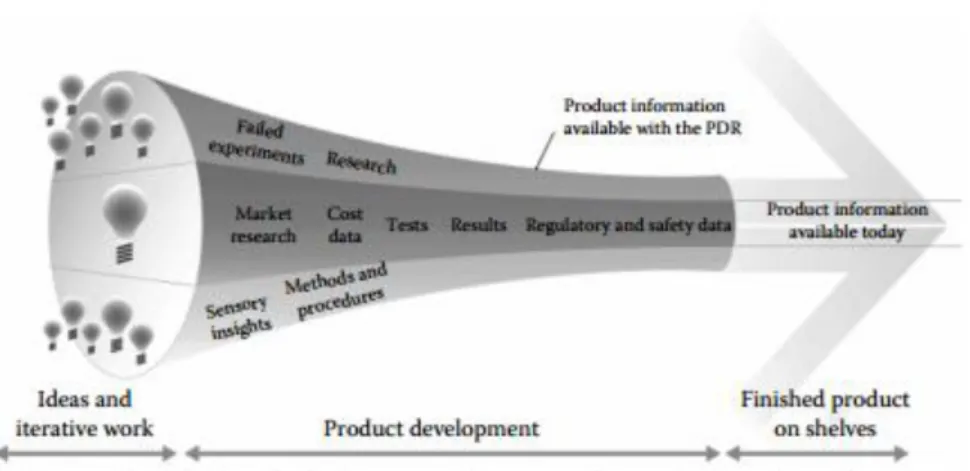
The PLM solutions allow the data management of the product since the first steps of idealization, to the end-of-life of product on the market: The Consumer Packaged
Goods (CPG) PLM Platform comprises as many capabilities, applications, and work processes as are found in today’s product development processes, functions, and work areas. (Perry & Cochet, 2009: 119).
The turning point in the evolution and birth of PLM as a discipline occurred when, around a single concept, software suppliers began to build their solutions. The success of PLM is in the Product Data Management (PDM), using a data model called Product Data Record (PDR), as write the authors (2009:120): Whereas PDM does not have the
scope and the capabilities of PLM, it contains the PDR, the building block which “pumps” essential information from and to the different applications composing the PLM platform. PLM is not possible without first creating a single version of the “truth” for all product data through the PDR.
4.3.2. Product Data Record
If they are guided by a vision and a strategy that will lead to the adoption of a true platform technology, PLM solutions helps solve the challenges of managing product information, and for Consumer Packaged Goods (CPG), the development of a PLM
23 strategy constitutes as a prerequisite to achieve substantial results, as compared to other industries.
The first step in defining a PLM strategy is to understand, define and map the required data and produced throughout the development lifecycle of the product, which begins with the creation of PDR. The data for development of a product, in addition to consist of the information that defines it, consists also in all the knowledge that was created during its development, from ideation, to launch, through the end-of-life of the product. (…) the PDR is the heart of PLM, and successful product management is not
possible without it”. (Perry & Cochet, 2009: 123). Once built, the PDR should be taken as "single version of the truth (Perry & Cochet, 2009:125) for product data,
acting as a reference for all interactions present or future product, organization, processes and work in technology solutions.
The PDR has many benefits and improvements to the different business activities involved in the product development process: Product design; Packaging; Product claims; Traceability; Regulatory, environmental, and safety; Procurement; Project and portfolio management; and Knowledge management, as we can see in Figure 3.
Figure 3 – The types of information available in the PDR
Source: Perry, Chip & Max Cochet (2009), “Consumer Packaged Goods Product Development Process in the 21st Century: Product Lifecycle Management Emerges as a Key Innovation Driver”, in Moskowitz, Howard R.
24 As we could see, the PDR improves the innovation productivity, and its building and management becomes a prerequisite to PLM initiatives targeted at improving innovation. It contains all critical information necessary to design, produce, and modify the product, defines the product hierarchy (classification and management of product data), it contains linkages to the authoring tools used for the conception and development of a product, and also identifies areas of opportunity to streamline, standardize, and integrate systems and processes to help accelerate speed-to-market, reduce costs, increase knowledge reuse, and guarantee data integrity. (Perry & Cochet, 2009).
In the same line of thought, Steven C. Wheelwright and Sasser W.Earl (1989) show that a map with the corporate managers involved in product development is needed. In order to expose the market and technologies that have been driving the evolution of a company’s product line – the “where we’ve come from” – managers need a way to see the evolution– the “where we are”. Such a map provides a basis for sharing information, as was supported by Perry & Cochet (2009), presenting the evolution of current product lines in a summarized and clear way so that all functional areas in the organization can respond to a common vision. “And by enabling managers to compare the assumptions underlying current product lines with the ideal assumptions of new research, it points to new market opportunities and technological challenges.” (Wheelwright & Sasser, 1989: 2). As it is argued by the authors, the map generates the right discussions, because when managers know how and why they leveraged products in the past, they know better how to leverage the company in the present.
4.4. Open Innovation: Connect & Develop
Henry Chesbrough (2005) argued that Open Innovation is the use of purposive inflows
and outflows of knowledge to accelerate internal innovation, and expand the markets for external use of innovation, respectively. Open Innovation processes combine internal and external ideas to create value, while defining internal mechanisms to claim some portion of that value.
Chesbrough describes an innovation paradigm shift from a closed to an open model. In the closed model, the research projects were launched from the science and technology base of the firm, the only one to enter the process, and the only one way to exit the process was
25 by going into the market. In the Open Innovation model, projects can be launched from
either internal or external technology sources, and new technology can enter into the process at various stages. Chesbrough labeled this model “open” because there are many ways for ideas to flow into the process, and many ways for it to flow out into the market
(Chesbrough, 2005).
Figure 4 – Open Vs Close Innovation Paradigm
Source: Chesbrough, Henry William (2003), Open Innovation – The New Imperative for Creating And Profiting from Technology, Harvard Business School Press.
Formerly, the launch (inclusion) of a product on the market took too long, which could be as unfavorable to the company that developed, having to deal with investment risk and the consequent internal. But, by applying a fundamentally new approach to innovation, there are several success stories that have been shown feasible to launch a product in a short time and also minimized costs. As an example of this optimization in the development process of new products, the case of the new model of innovation at Procter & Gamble (P&G), which was challenged by its CEO A.G. Lafley, and was advanced and executed by Larry Huston, vice president for innovation and knowledge of P&G, and Nabil Sakkab, vice president for corporate research and development at P&G in Cicinnati.
In their article "Connect & Develop: Inside Procter & Gamble's New Model for
Innovation" (2006), the authors, to face the challenge from the CEO of reinventing the
company's innovation business model, they realized that the best innovations from P&G emerged from the connection and interaction of ideas between internal affairs, and that, similarly, the external connections could also produce innovations highly profitable:
26
acquire 50% of our innovations outside de company (…) and we needed to change how we defined, and perceived, our R&D organization – from 7,500 people inside to 7,500 plus 1,5 million between them. (Huston & Sakkad, 2006: 2-3).
And so it was that created and developed the innovation model Connect & Develop that, with a clear understanding of consumer needs, can identify promising ideas in the world and work them with the R&D department, in order to create better and cheaper products, in a faster and more efficient way.
It is of crucial importance, the analysis, interpretation and proper consideration of this case study for this project, since this innovation model Connect & Develop, first developed in the framework of P&G, should be as one of the first guidelines to the entire process of development of new products, in that innovation should be constituted as a key element.
According to the authors, this model works, and through it, parallel to improvements in other aspects of the innovation related to product cost, design and marketing success of the cup innovation more than doubled, while the cost of innovation descended. The productivity of R&D at P&G grew about 60%.
In order to provide a better understanding of the model, which focuses on the lookout for good ideas and bring them to improve and capitalize on internal capabilities of a company, it must realize what to do, where to act, with whom, and how something that came born of an idea.
Firstly, there is a strong collaboration with organizations and individuals around the world, systematically searching for proven technologies, packages, and products that we
can improve (...) (Huston & Sakkab, 2006:3). At this stage, has proven crucial to the
development of work know exactly what we're looking - if we are to meet the primary needs of consumers, if we want to extend the product range with its adjacencies, or whether on the contrary, we intend to enhance the range technologies to better cope with competition.
The Connect & Develop strategy is constituted by the activities of global network platforms, and once identified the products and ideas for those networks around the world, we must filter them internally, using the template that helps organize certain facts about
27
the product: What is it? How does it meet our business needs? Are its patents available? (...) (Huston & Sakkab, 2006:6). Likewise, it is necessary to foster a culture change while
developing internal systems to create connections, opening the company to external ideas as well as promoting the exchange of ideas internally.
The authors and creators of this model connect and develop, believed in 2006 that this model would become the dominant innovation model in the twenty-first century, and that, to succeed, must be immediately addressed by the CEO of the organization.
Companies need to realize that the innovation landscape has changed and that your current model became untenable. (Huston & Sakkab, 2006).
28
5. CONCEPTUAL FRAMEWORK OF REFERENCE
Following, the theories and practices studied in the literature review that influenced the method used for data analysis, development and implementation of this project:
Stage-Gate® - Doing projects right and doing the right projects: “Many companies now utilize a Stage-Gate® new product process to drive their new-product projects to market quickly and successfully” (Cooper, 2000: 3);
Portfolio Management;
Innovation Success – Managing Product Life Cycle and Product Data Record;
Connect & Develop.
Based on theoretical information and practices collected on these subjects in general, we proceeded to the following:
Analysis of the development process of new products in the Commercial Department of Perishable Goods;
Analysis of the average time to launch new products to the market (Idea to Launch);
Analysis of the number of processes in two support units involved in the process (Quality Control and Product Development);
Optimization of the development process:
o Development of a new flowchart of the process;
o Development of a universal database for all units involved in the process; o Development of a sheet for developing products.
29
6. METHODS AND TECHNIQUES OF DATA COLLECTION
This dissertation follows a methodology with an interpretive paradigm, qualitative, and the method is descriptive and comprehensive, with a strong analytic nature.
All information and data collected for this project was obtained through an internet search in the California Management Review3, in the Harvard Business Review4, in the Product Development Institute5, in the Knowledge Online Library6, in the Wiley Online Library7 and through a five month internship conducted in the Product Development Department integrated in the Commercial Department of Perishable Goods of a large retail company in Portugal. With the aim of optimizing the process of developing its own brand products, it was necessary to study and analyze in detail the whole process and all units within it. It was also necessary to perform analysis trough the internal company database, in order to better understand the efficiency or inefficiency of the process:
Analysis of the average time for product development in the first quarter of 2012 (from idea to launch);
Review the number of projects in the first semester of 2012 of two support units integrated in the process (Quality Control and Product Development).
By analyzing all these sources it was possible to obtain relevant and consistent information for the proposed optimization process, presented in this dissertation.
3
Available at: http://cmr.berkeley.edu/
4 Available at: http://hbr.org/
5 Available at: http://www.prod-dev.com/ 6 Available at: http://www.b-on.pt/ 7
30
7. INFORMATION ANALYSIS AND CONCLUSIONS
This chapter will present the results of the methodology applied in data analysis.
7.1. Own Brand Product Development Process Analysis
The process of development own brand products responds directly to the Perishable and Food Commercial Departments of this great retail company.
It is a process that involves several entities during its course. It is long and complex, therefore it is necessary to clarify it and the entities involved in it, as well as their responsibilities.
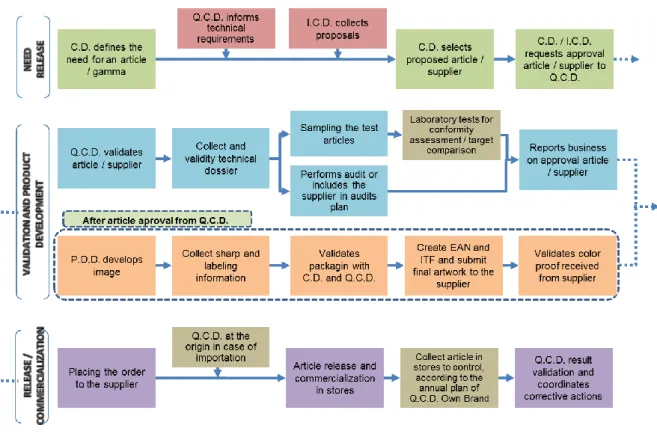
Figure 5 – Development Process Flowchart of Own Brand Products
Source: Food Retail Company in Portugal.
Figure 4 demonstrates the process flowchart, which is divided into three phases, each one with several steps that will be analyzed below. Recall that the process that will be analyzed only dates back to the Commercial Department of Perishables Goods.
31
7.1.1. Need Release
This is the first step of the process of development and launching own brands products.
The process is initiated by the Commercial Department of one of the six Business Units (Butcher, Fish, Delicatessen, Bakery and Confectionery, Fruits and Vegetables, Take-Away). The Commercial Manager is the responsible for this first step, happening when it is determined the need to develop / launch a new product / range to market. This need can be identified in three ways:
Annual (Planning);
Spontaneous;
Punctual.
The main reasons to exist spontaneous and punctual needs are:
Fight a new product or range of products from the competition;
Arise an idea of launching a new product or range of products;
Presentation of a new product or range of products by one Supplier;
Identification of a better quality product that what is currently being commercialized.
After the need is determined, the Commercial Manager defines the planning for the development / launching of the new product or range.
7.1.1.1. Planning
When identified the need of developing / launching and sourcing own brand products, the Commercial Manager and the Procurement Manager develop a macro planning of procurement actions to develop.
Then the Commercial Manager asks the Quality Control Department, in this case the Quality Technician, about the technical requirements, according to the Quality Management System (QMS) that provides consistent products that meet the
customer requirements (ISO9001 – International Organization for
32 In order to this process to proceed, the Procurement Manager, which is inserted in the International Commerce Department, needs to be provided of certain information, from the Commercial Manager. This information is:
Generic technical characteristics;
Targets;
Brand positioning;
Forecast of actual purchase and objective;
Maximum quantities per package;
Desired date for product / range launch.
7.1.1.2. Sourcing
After the inputs are received, both from the Commercial Manager or the Quality Technician, the Procurement Manager prepares a micro planning of the sourcing process for the product or range of products.
At this stage the Procurement Manager checks for potential suppliers in its database, as well as possible sources to contact or possible fairs that can be visited, to satisfy the request of the Business Unit.
Identified potential suppliers, the Procurement Manager contact them to proceed the sending of necessary documents to be filled by the Supplier. These documents contain important information concerning the Supplier and the product, certified evidence of certifications held and / or technical information of the products offered.
The Supplier must submit the proposal of the Procurement Manager with all the information requested so that it can be analyzed and compared with other proposals.
There are also requested product samples to be presented to the Commercial Manager for analysis.
7.1.1.3. Proposals Analysis
Based on the information received from a certain number of Suppliers the Procurement Manager analyses which one present the most competitive terms.
33 After this, it is collected and presented a list of proposed Suppliers to the Commercial Manager. Then, the Commercial Manager evaluates the proposals, comparing them with others who might have in his portfolio. Upon consideration thereof, the Procurement Manager informs about which product(s) / supplier(s) are to be selected.
7.1.2. Validation and Product Development
This second stage of the process is divided into two major stages for the development / launching of the new product / range.
The first step is a responsibility of the Quality Control Department: the information collected about the Supplier and about the product is analyzed, and the product is subjected to sensory and laboratory analysis.
The following step belongs to the Product Development Department, where it will be developed the packaging of the product.
7.1.2.1. Quality Control – Audits and Product Development
According to all information received from the Commercial Manager and the Supplier, the Procurement Manager informs the Quality Technician of the product(s) / supplier(s) selected, sending all documentation available.
The Quality Technician must then analyze and validate all documentation regarding the Supplier and the product, to later proceed the sending of the product sample to the laboratory where they will perform the physical-chemical, microbiological and sensory8 analysis.
Afterward the obtaining of laboratory results, the Quality Technician decides about the acceptance or rejection of the product sample and reports its feedback to the Commercial Manager and all the Departments involved in the process (Commercial Department, International Commerce Department, Quality Control Department and Product Development Department).
8 Although the Commercial Manager has already set a target for the product but this might be changed by the results of the sensory analysis.
34 In case of product rejection – disapproval –, the Quality Technician will review the situation with both Commercial and Procurement Managers, and later with the Supplier, in order to evaluate the possibility of reformulation of the product, if the Commercial Manager is interested.
If the product is approved, and after receiving the decision of the Commercial Manager, the Procurement Manager informs the Supplier that the product has been approved and that the Quality Technician will contact him, in order to request and developed the necessary technical information to appear in the label. The Brand Manager will also contact the Supplier, to ask for three product samples, the technical drawing (biting packaging), the number of possible colors to print and the type of printing used by the Supplier, in order to proceed with the developing of the packaging.
7.1.2.2. Brand / Product Development
The Quality Technician is responsible for delivering the technical information about the product – that will appear on the product label –, and the Supplier to send the technical drawing to the Brand Manager, in order to start the process of developing the product packaging.
The Brand Manager shall draw up a briefing for image development, which must be validated by the Commercial Manager. After the approval, the Brand Manager sends the briefing to an external agency or an internal Designer to develop the graphic packaging. When the image development of the product is ready, the Commercial Manager receives the proposed image and analyzes it.
When the Brand Manager considers that the proposal needs improvements, he requests the external agency or the internal Designer to present a new proposal that complies with the intended for the brand. If the proposal is in accordance with the desired by the Brand Manager, and ensure the positioning and image defined for the brand and set by the Graphics Charter, the Brand Manager shares it with the Commercial Manager.
35 In case the Commercial Manager does not approve the request proposal and suggest image changes, the Brand Manager will need to request those changes to the external agency or to the internal Designer until it is approved.
When approved, the Brand Manager sends the label with the image and text applied to the Quality Technician approval. This may or may not be approved immediately. It is therefore possible to have a mail exchange between, in order to make the necessary changes.
After validation of the label by the Quality Technician, the Brand Manager sends to the Supplier the final document (portable document format – pdf) of the label to be approved.
The Supplier may request changes related to the information contained, and the Quality Technician will then verify whether or not to perform. If the changes are related to the image, the Brand Manager will verify if it is required or not. If the proposal changes are accepted, the Quality Technician and/or the Brand Manager will proceed to the changes and send them again to the Supplier. Otherwise the Supplier sends the final document to the Brand Manager that will create the EAN9 and the ITF10 of the product, and asks the external agency or the internal Designer to save the artwork to be sent later to the Supplier.
After sending the artwork, the Supplier shall submit two copies of color proof of the packaging / product to the Brand Manager for review and approval.
When approved the color proof, which is signed and dated by the Brand Manager, the process of image development is completed.
7.1.3. Release / Commercialization
After finishing the process of product development, the Stocks Manager is responsible for carrying out the ordering of products to the Supplier and its entry in the stores.
9 EAN – European Article Number – International System for identification of the product (code bar). 10
36
7.1.3.1. Monitoring of Suppliers / Products
Despite the development process ends at the time that is presented the final draft of the product and the packaging, the company assumes the responsibility of controlling the Supplier over time, as well as the products.
7.1.3.1.1. Inspection at the origin
For products with origin in foreign countries outside the European Union, there is an inspection at the origin.
The Commercial Division is responsible for identifying if the inspection of quality at the origin is applied to the purchase order or not. However, the Quality Control Department can recommend a reassessment of the decision when appropriate.
When the inspection of quality at the origin takes place, the Quality Control Department is responsible for authorizing the emission of the inspection certificate, evidencing this way the acceptance / compliance of the goods.
7.1.3.2. Promotion Action of the Own Brand
It is the responsibility of the Product Development Department the planning and implementation of actions of Own Brand promotion, always defined in conjunction with the Commercial Department and, whenever possible and appropriate, with the Marketing Department.
7.2. Analysis to the Overall Average Time for Product Development in the 1st Quarter of 2012
After a detailed study of the process of product development, and aiming its optimization, we began by preparing an analysis to the average time to develop own brand products. Taking into account the three different phases of the process, which were previously presented and shown in figure 4, we started by looking for all own brand products that had been launched in the first quarter of 2012.
37 Through this list of products, we began to rewind in the process and tried to understand the entry dates of each phase of development. It was here where we faced with one of the biggest obstacles in this process: the monitoring of the development process of a product. Each Department (Commercial, International Commerce, Quality Control and Product Development) had its own database, i.e., none of them were equal and frequently the information was absent or incorrect.
After a long time consuming search in databases of the company, and tracking processes, we were able to understand the precise dates in order to develop the analysis. Graphic 1 shows the average time for product development.
Graphic 1 – Overall Average Time for Product Development in the 1st Quarter of 2012 (in days)
Reaching this data, and after the process analysis, we noticed that it was necessary to analyze in more detail the stage "Product Development & Validation". As discussed earlier in the process, this second stage is divided into three different steps:
88 135 47 191 0 50 100 150 200 250
OVERALL AVAREGE TIME -1st QUARTER 2012
38
Product Validation, where the products are submitted to some tests;
Commercial Decision, where the Commercial Department analysis the results from the tests and decides if the product goes to the market or not;
Product Development, where the development of the packaging starts.
By so, we realized that a detailed analysis would be necessary in order to evaluate precisely the process and define the best strategy to adopt for a better optimization. Graphic 2 illustrates a more detailed analysis.
Graphic 2 – Overall Average Time for Product Development in the 1st Quarter of 2012
This way, we can analyze that:
1st – Need Release takes, in average, 81 days to be concluded;
2nd – Product Validation and Development takes, in average, 135 days to be concluded, where:
o 52 days, in average, for Product Validation; o 8 days, in average, for Commercial Decision; o 84 days, in average, for Product Development;
3rd – Release / Commercialization takes, in average, 47 days.
81 52 8 84 47 191 0 50 100 150 200 250 OVERALL AVAREGE TIME - 1st QUARTER 2012
39 Following this analysis and a board meeting, we came to consensus that the company is spending too much time in the “Need Release” and in the “Product Development” phases, and the efforts should go through reduce this excess time in order to launch products more quickly to market.
7.3. Analysis of the number of processes in the 1st Semester of 2012
In order to better understand why the company spends so much time during the two phases mentioned before, it was decided an analysis of the departments present in the process.
The following analysis is intended to understand the efficiency of each department on the number of processes responsible for, i.e., notice if the available resources are sufficient for the number of processes.
Due to the use of different databases in each department, we started by studying the Product Development Department, the Quality Control Department and finally the International Commerce Department. However, it was not possible to realize this last one due to the fact that the information contained in the two first departments were not consistent with this last one, inasmuch as the information was inconsistent or probably lost.
By so, following it is presented an analysis to the Quality Control Department, following by the Product Development Department.
Graphic 3 – 2011 Total Processes in Quality Control Department
0% 84% 16% In Development Aproved: Reproved
40
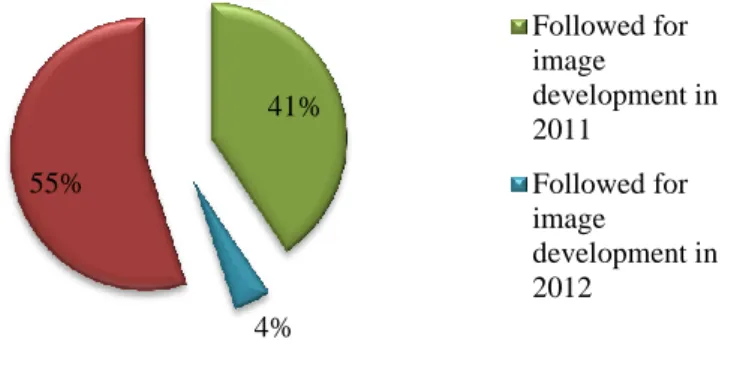
Graphic 4 – 2011 Approved Processes in Quality Control Department
As it can be seen in Graphic 3, in 2011 the number of approved processes, in the Quality Control Department, was 84% and the reproved ones, 16%. Whereas the 84% approved, only 41% followed for image development in 2011, 4% followed for image development in 2012 and 55% didn’t followed for image development.
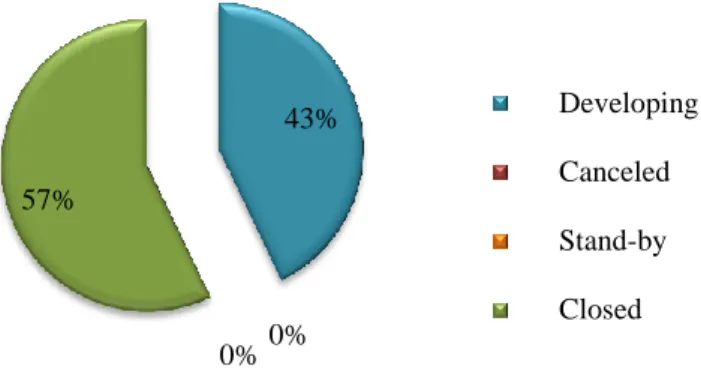
Graphic 5– 1st Semester of 2012 – Total Process in Quality Control Department
Graphic 6 – 1st Semester of 2012 – Approved Process in Quality Control Department 41% 4% 55% Followed for image development in 2011 Followed for image development in 2012 31% 65% 4% Developing: Aproved: Reproved 20% 80%
Followed for image development Not followed yet for image development