BJRS
08-01 (2020) 01-18ISSN: 2319-0612 Accepted: 2020-02-13
Adaptations of a Mobile Lab for Analysis of Th-232
in Soil Samples Using Well-Type NaI (Tl)
Scintillation Gamma Spectrometry
Oliveira
aL. S. R., Izidório
bA. C. A. C., Vilela
aP. R. T. V., Amorim
aA. S.,
Balthar
aM. C. V., Santos
aA., Vital
aH. C., Paixão
a,bS. B.,Conceição
cD. A. e
Brigida
cZ. A. A. G. S.
aIDQBRN/CTEx, bCOPPE/UFRJ, cUCB aAvenida das Américas 28705, Guaratiba - RJ
ABSTRACT
In situ determination of Th-232 is included among the actions of the operational teams of the Brazilian Army Institute of Chemical, Biological, Radiological and Nuclear Defense (IDQBRN) for identification of radiological and nuclear agents in a Mobile Laboratory. The use of the facility will allow the discrimination of the environmental condition and NORM [1], besides reducing the chain of custody of the samples. However, due to operational difficulties of using HPGe detectors in such situations, the Mobile Lab is being adapted so that it can be utilized to perform Th-232 analysis in soil samples with the scintillation gamma spectrometry technique [2], including well-type NaI (Tl) scintillation detectors with characterization response, resolution and efficiency in the 3000 keV energy range.
Keywords: gamma spectrometry, well-type NaI (Tl) scintillation, Th-232 measurement.
1. INTRODUCTION
The use of Gamma Spectrometry Technique has been of fundamental importance for the performance of the operational teams of the Institute of Chemical, Biological, Radiological
and Nuclear Defense (IDQBRN) of the Brazilian Army in efforts to identify and quantify radionuclides such as Th-232, naturally present in soil and sediments. The use of the technique allows very low levels of contaminants to be discriminated and measured, enabling comparative analyzes with world statistics presented by the United Nations Scientific Committee on the Effects of Atomic Radiation (UNSCEAR) [1] and compatibility with guidelines offered by the International Agency for Atomic Energy (IAEA) as a series of Technical Documents (TECDOCs) addressing Naturally Occurring Nuclear Materials (NORM) [2].
The use of scintillation-type detectors [3] in mobile laboratories enables in situ analyses of samples to be efficiently performed, thus meeting the demand for chain of custody care, while providing the logistical resources required for the transportation of the collected material. A mobile laboratory equipped for identification of radiological and nuclear agents can therefore be considered as an essential tool in the definition of response actions of operational teams.
Particularly in the case of using the mobile laboratory to identify radiological and nuclear agents, hereinafter referred to as “LabMovelRN” of IDQBRN, the use of high purity Germanium (HPGe) detectors presented operational difficulties regarding the need for cooling and limited autonomy inherent in this type of detector. In search for viable alternatives, adaptation to the measurement geometry was implemented, making it possible to analyze the presence of Th-232 in soil samples using a 3”x3” well-type NaI (Tl) scintillation detector, with characterization of energy response, resolution and efficiency up to 3,000 keV (environmental).
Gamma spectrometry systems based on these types of NaI (Tl) scintillation detectors are known to have an excellent detection efficiency, which allows analysis of samples with lower masses in a shorter period of time. They also have as advantageous features: robustness, good autonomy, operational at room temperature and simplicity of power to be supplied to its associated nuclear instrumentation (eg. personal computer USB port). Its main limitation lies in its low resolution, which may significantly impact the identification of radioisotopes with several neighboring characteristic photopeaks closely packed in energy and also in situations when the levels of background or scattered radiation are relatively high. Thus the efficiency in the use of such counting systems is directly related to its ability to identify, as precisely as
possible, the Gaussian shape of the photopeaks so as to determine their net areas of interest and the corresponding number of gamma rays detected.
The main objective of this work is therefore to describe a methodology developed for determination of Th-232 with enhanced resolution by using a well-type NaI (Tl) scintillation gamma spectrometry system based on analyses of its daughter nuclides Ac-228, Tl-208, Bi-212 and Pb-Bi-212. It is also intended to provide procedures that could lead to reduced radiation exposure and risk of tasks performed in the field with the use of similar systems.
2. METHODOLOGY
Some difficulties are often reported when attempts are made to analyze soil and sediment samples by using gamma spectrometry systems based on well-type NaI (Tl) scintillation detectors (in spite of their relatively large operational robustness and high counting efficiency). During in situ experiments they are mostly related to lack of definition in the Gaussian-shaped photopeaks and also in their net area, both issues resulting from the low resolution of these detectors.
The identification of Th-232 by using the gamma-scintillation technique with nuclear detectors of this type is made by measuring the energies of its daughter radionuclides [4] Ac-228, T1-208, Bi-212 and Pb-212, where scintillation resolution allows the conformation of the photopeak.
In the present study, a cocktail-type pattern was adopted for the Am-241, Cs-137 and Co-60 radionuclides, also including a 3”x3” well-type NaI (Tl) scintillation gamma spectrometry system. Based on a Gaussian linearization for representation of the photopeak as function of energy the width at half height (FWHM) and net area of the photopeak where determined by linear interpolation. Since LabMovelRN has not been designed to allow the analysis of highly active sources of radiation, compact counting geometries are being used as they require lower sample masses and adequate (also called operational) counting times.
2.1. Resources
The following list provides information on the major resources used in this work: • 3"x3” well type NaI (Tl) scintillation detector
• Cocktail-type radioactive standard containing Am-241(LNMRI - C/037/A16 - 16.047 kBq.g-1 ±1.9%), Cs-137 (LNMRI - C/037/A16 - 12.581 kBq.g-1 ±2.7%) and Co-60
(LNMRI - C/037/A16 - 16.693 kBq.g-1 ±2.1%)
• Sand sample from Guarapari Black Sand Beach with 17 g and Th-232 concentrations of 7,236 ± 513 Bq.kg-1 [5]
• Nuclear Radiological Mobile Laboratory with fixed measurement geometry using cadmium and zinc-coated lead shielding
• OSPREY nuclear instrumentation system for scintillation detectors • Microcomputer for use of analysis software
• GENIE2000 gamma spectrometry analysis software for energy curve fitting
• LABFIT mathematical analysis software for adjustment of resolution and efficiency curves
• Spreadsheet software for evaluating the relative errors between experimental data and
fitted curves
2.2. Procedures
The counting system used is shown in Figure 1. It consists of a 3"x3" well-type NaI (Tl) detector connected to the OSPREY System to be positioned in the LabMovelRN lead castle by means of an elevator for adequate positioning of the scintillation crystal inside the shield cask.
High voltage power and data transfer is done via USB cables and the instrumentation is identified using standard ETHERNET network cables.
Figure 1: Experimental counting system.
The characterization of the response of a 3"x3" well-type NaI (Tl) scintilation gamma spectrometry system for analysis of soil and sediment samples for the purpose of quantitatively measuring levels of Th-232 requires that guidelines be defined and followed. Such guidelines should include instructions regarding the appropriate settings to be made to ensure that the scintillation detector operates at its optimum operating voltage and that the resolution and efficiency curves of the counting system be known up to 3,000 keV. Such procedures are described in the next section.
2.2.1. Determination of the operating voltage of the scintillation detector
The optimum operating voltage of the scintillator detector is konwn to yield the best resolution response at the reference energy of interest. In this work it was 661.66 keV that corresponds to the photopeak of the radionuclide Cs-137.
2.2.2. Geometry of the counting system
The geometry of the counting system was based on the dimensions of the shield cask of the spectrometry system provided in the Mobile Laboratory that has been adapted for use with this type of scintillation detector. In addition, since the detector is of the well type, the standard radioactive calibration source as well as the soil sample fit suitably inside the scintillation cavity, remaining stored in it during the analyses as shown in the figure 2.
Figure 2: Counting geometry, calibration source and sample.
2.2.3. Energy calibration curve
For a gamma spectrometry system to identify the radionuclides of interest, the energy calibration curve of the system in the corresponding range must be determined. Equation 1, obtained by running the GENIE2000 software, defines the fitted curves for the Am-241,
Cs-137 and Co-60 cocktail-type radioactive standard calibration sources used. Table 1 lists energies and emission yields of the radioactive sources used for calibration.
B Ch A keV
E( )= . + (1)
Table 1: Calibration sources and corresponding energies and emission yields. Energy Calibration
Radionuclide Energy (keV) [9] Yield (%) Emission
Am-241 59.5409 35.9
Cs-137 661.657 85.10
Co-60 1,173.228 99.85 2,505.720 **
Since the system is intended for analyses of naturally occurring radionuclides, its energy calibration must cover the entire energy range from 0 up to 3,000 keV, due to the need to count the radioisotope Tl-208 at 2,614.51 keV. Therefore, in this step of adjusting the response of the gamma spectrometry system, the energy of the Co-60 sum peak (exhibiting coincident gamma energies) was used.
2.2.4. Resolution calibration curve
In order for a spectrometry system to be able to identify radionuclides by their gamma emission, it is necessary to know the resolution response that the system presents for the
energy range of interest by means of a calibration curve. Thus the value of FWHM must be determined for the photopeak of interest using equation 2.
E FWHM R =
(2)
In which:
R = Resolution; FWHM = width at half height of the photopeak at energy E; E = Photopeak energy.
2.2.5. Efficiency calibration curve
In order for a gamma spectrometry system to quantify a sample, its efficiency calibration curve must be known. It can be calculated from equation 3, once the net area of the photopeak has been determined and if the source activity is known. Due to low typical resolutionsof NaI (Tl) scintillation detectors, there can be overlapping of areas pertaining to adjacent photopeaks, as it can be the case of the radionuclide Co-60. When such events occur, the net area of a photopeak can then determined by adding half of the area defined in the region of interest (ROI) (unperturbed by the presence of the adjacent photopeak), to its mirrored counterpart, according to equation 4.
k i T A S . . . = ε (3) In which:
ε = detection efficiency for energy E; S = Net photic area given by the GENIE2000 program when there is no area influence of an adjacent energy photic; A = Activity in Bq of the
radioactive source used; T = counting time (s); i = percentage of gamma energy emission; k = decay factor.
Figure 3 shows a representative schematic of the procedure used to determine the net area of the photopeak affected by nearby energies.
Figure 3: Net Area of the Photopeak. Source: Canberra N n B n B G S . 2 2 1 + − = (4) In which:
S = Net area of the photopeak when overlapping occurs; G = The gross photopeak is given by the GENIE2000 program, but obtained by considering only half of the area without the influence of another photopic and summing the mirrored area. The mirrored area used in this
work refers to half the area of the energy photopeak of interest that is not influenced by nearby photopeaks. In order to be obtained, the channel with the highest count in the photopeak region should be used as a reference; N = Number of MCA channels of the region of interest (ROI) that defines the photopeak given by the GENIE2000 software; n = is half of N; B1 = Sum of n-channel counts at the limit of the photopeak region, considering only half of the area without the influence of another photopeak; B2 = Sum of n-channel counts at the boundary of the mirror area photopeak region equal to B1.
Using the energy efficiency values in table 1 and using the fitting function described in equation 5, the efficiency curve is defined using the LABFIT software.
C E B A + = ε (5) In which:
ε = detection efficiency; E = gamma energy; A, B and C = polynomial coefficients.
2.2.6. Counting of soil samples
The soil sample used had a mass of 17 g and it fitted closely inside the scintillation well. It had been collected from Areia Preta Beach in Guarapari County, Espírito Santo State and included Th-232 concentrations of 7,236 ± 513 Bq.kg-1, which yielded a counting response
compatible with NORM measurements, since the world average soil concentration of Th-232 is less than 64 Bq.kg-1 [1].
The identification of Th-232 in this sample by using the scintillation gamma spectrometry technique is made by measuring the energies of its daughter radionuclides Ac-228, T1-208,
Bi-212 and Pb-212, whose resolution of the scintillation detector allows the conformation of the photopeaks.
3. RESULTS AND DISCUSSIONS
3.1. Determination of the operation voltage of the scintillator
The 870 V high voltage setting for the 3”x3” well-type NaI (Tl) scintillation detector provided a resolution of 10.9% for the Cs-137, and the best resolution obtained for that energy wit the counting system in that geometry.
3.2. Energy calibration curve
The energy calibration curve, given by equation 1, with fitted coefficients A = 3.090 and B = 2.87, is depicted in figure 4.
Figure 4: Energy calibration curve.
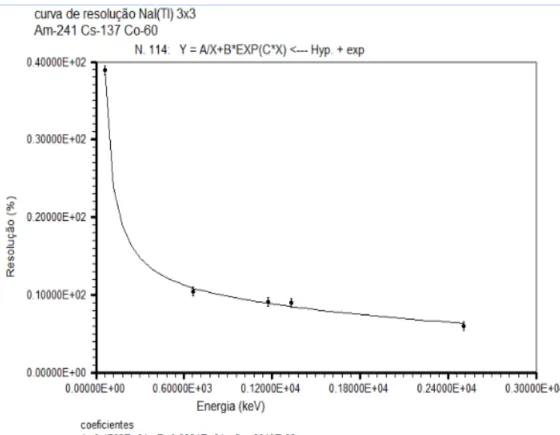
3.3. Resolution calibration curve
The resolution calibration curve, given by equation 4, with fitted coefficients A = 1.763x10³, B = 9.384x10³ and C=-2.049x10⁻⁴, is depicted in figure 5. Table 2 lists the relative
discrepancies among resolution data calculated by using equation 2 and the corresponding ones at the same energies obtained from the fitting.
0 500 1000 1500 2000 2500 3000 0 200 400 600 800 1000 Ene rg y ( keV ) Channel Energy Calibration
Figure 5: Resolution calibration curve.
Table 2: Relative discrepancy of the fitted resolution curve. Radionuclide Energy (keV) Resolution Labfit Resolution Discrepancy Percent
Am-241 59.5409 38.9 38.9 0.0 Cs-137 661.657 10.4 10.9 4.8 Co-60 1,173.228 9.1 8.9 2.2 1,332.492 9.0 8.5 5.6 2,505.720 6.0 6.3 5.0
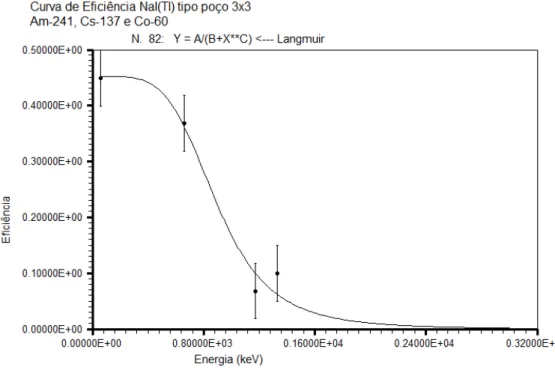
3.4. Energy calbibration curve
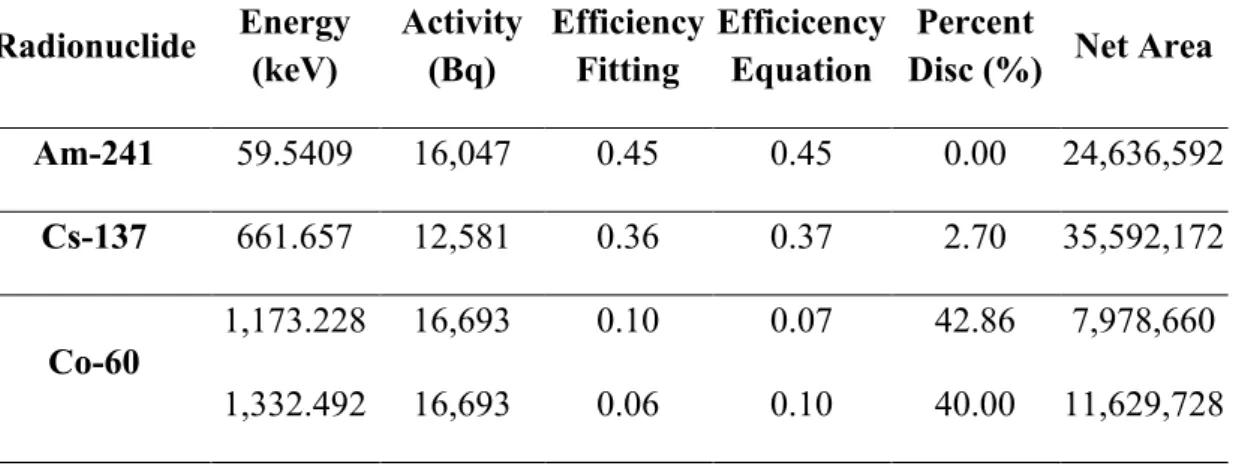
The efficiency calibration curve, given by equation 5, with fitted coefficients A= 2.094x10¹³, B = 4.629x10¹³ and C = 4.631x100, is depicted in figure 6. Table 3 lists the
relative discrepancies (%) among resolution data calculated by using equation 5 and the corresponding ones at the same energies obtained from the fitting.
Table 3: Standard sources and calibratiom energies used.
Radionuclide Energy (keV) Activity (Bq) Efficiency Fitting Efficicency Equation Disc (%) Net Area Percent
Am-241 59.5409 16,047 0.45 0.45 0.00 24,636,592
Cs-137 661.657 12,581 0.36 0.37 2.70 35,592,172
Co-60 1,173.228 16,693 0.10 0.07 42.86 7,978,660
1,332.492 16,693 0.06 0.10 40.00 11,629,728 3.5. Counting of soil samples
Figure 7 shows the spectrum for a 17 g sand sample from Areia Preta de Guarapari Beach and Table 4 shows the radionuclides daughters of Th-232 and their associated energies. The counting time used was 7,200 s.
Tabela 4: Radionuclides daughters of Th-232 and associated energies. Radionuclide Energies (keV) Yield (%) Measured Energies (keV) Relative Discrepancy (%) Pb-212 238.63 43.60 231.20 3.1 Ac-228 338.32 11.27 326.50 3.5 463.00 4.40 449.10 3.0 911.20 25.80 876.80 3.8 968.97 15.80 Tl-208 510.77 22.60 563.50 3.4 583.19 85.00 2,614.51 99.75 2,467.60 5.6 Bi-212 1,078.62 0.56 1,037.50 3.8
The 911.20 keV and 968.97 keV energies of Ac-228 and the 510.11 keV and 583.19 keV energies of Tl-208 are depicted in the spectrum of Figure 7 as the sum of the areas of their associated photopeaks.
The data obtained from the fitted energy and resolution calibration curves for energies up to 3,000 keV and by using the sum peak of Co-60, were found to be sufficiently accurate for identification of the following radionuclides: Pb-212, Ac-228, Tl-208 and Bi-212, daughters
of Th-232, thus meeting the operational need of IDQBRN teams who need to use long half-life standard calibration sources.
4. CONCLUSION
Measurements performed on the IDQBRN LabMovelRN demonstrated the reliability of the energy response and resolution of a 3”x3” well-type NaI (Tl) scintillation gamma spectrometry system using a cocktail-type radioactive standard sources of Am-241, Cs-137 and Co-60 with long half-lives. The measurements were performed for identification of Th-232 in a 17 g sample based on the energies of the radionuclides Pb-212, Ac-228, Tl-208 and Bi-212 which are compatible with the procedures used by the IDQBRN operational teams in field actions.
It can be concluded from the analyses of the radionuclides Ac-228 and Tl-208, shown in Figure 7, as well as from the relatively high discrepancy in the counting efficiency at the 1,173.228 keV gamma energy of Co-60, as shown in Table 3, that the method proposed in topic 2.2.5 for estimating the net area of overlapped photopeaks still lacks accuracy in the quantification of activity of samples, indicating the need for further improvement.
Careful analyses of the results has led to the conclusion that the following issues must be properly addressed: (a) future attempts must be focused on reproducing the shapes of the neighboring peaks so that improved estimates of the overlapped areas can be made; (b) the sum peak must also be addressed with greater accuracy by adding the two gamma energies emitted in coincidence [6]; (c) deconvolutions of the spectrum generated with the MCNP code will also be performed for the purpose of simulating with higher accuracy (and thus compensating for) the influence of partial energy depositions on the spectrum continuum [8].
Based on the results from this work, it was decided that further efforts must be done in order to perfect the calculation of net areas of overlapped photopeaks so that absolute quantitative analyses of radionuclides of soil samples and sediments may be performed in the LabMovelRN with the desired accuracy in order to meet the demands of the operational team
action time, as well as to reduce the sample chain of custody as well as the exposure for both OEI and the public.
REFERENCES
[1]. UNSCEAR, United Nations Scientific Committee on the Effects of Atomic Radiation, 2000. Sources, Effects and Risks of IonizingRadiation, United Nations, New York [2]. IAEA-TECDOC-1472, International Atomic Energy Agency, 2005. Naturally Ocurring
Radioactive Materials (NORM IV), Poland
[3]. MONTANHEIRO, M. N. S.; V. F.; NASCIMENTO Filho e PINTO F. A. – Introdução à espectrometria gama. Boletim Didático no 021, 1977, 37 p., CENA, Piracicaba, SP
[4]. TAUHATA, L.; SALATI, I. P. A.; DI PRINZIO, M. A. R. R. - Radioproteção e dosimetria: Fundamentos 10a revision Nov./2014 - Rio de Janeiro - IRD/CNEN. 345p. ISBN: 978-85-67870-02-1
[5]. AQUINO, R. R., 2010, Avaliação da radioatividade natural em areias das praias da Grande Vitória, Espírito Santo - Master`s thesis, IPEN/USP, SP
[6]. ARAÚJO, M. T. F., 2015, Padronização Absoluta do 121Te por Espectrometria Gama Utilizando o Método Pico-Soma. Master`s thesis – Rio de Janeiro: IRD
[7]. MARINHO, G. V., 2011, Cadeia de custódia de prova pericial – Master`s thesis, FGV, RJ,
[8]. OLIVEIRA, L. S. R. , 2011, Avaliação da Resposta de Detectores Cintiladores de NaI(Tl) em Medições de Kerma no Ar em Feixes de Raios X Diagnóstico. Master`s thesis - Rio de Janeiro: IRD
[9]. Nucléide – Lara Bibliothèque d'émissions gamma et alpha, Last update: 2017-03-03, http://laraweb.free.fr/.