www.ccarevista.ufc.br ISSN 1806-6690
Apparent soil electrical conductivity in two different soil types
1Condutividade elétrica aparente do solo em dois tipos de solo
Wilker Nunes Medeiros2*, Domingos Sárvio Magalhães Valente2, Daniel Marçal de Queiroz2, Francisco de Assis
de Carvalho Pinto2 and Igor Rodrigues de Assis2
ABSTRACT - Mapping the apparent soil electrical conductivity (ECa) has become important for the characterization of the soil variability in precision agriculture systems. Could the ECa be used to locate the soil sampling points for mapping the chemical and physical soil attributes? The objective of this work was to examine the relations between ECa and soil attributes in two fields presenting different soil textures. In each field, 50 sampling points were chosen using a path that presented a high variability of ECa obtained from a preliminary ECa map. At each sampling point, the ECa was measured in soil depths of 20, 0-40 and 0-60 cm. In addition, at each point, soil samples were collected for the determination of physical and chemical attributes in the laboratory. The ECa data obtained for different soil depths was very similar. A large number of significant correlations between ECa and the soil attributes were found. In the sandy clay loam texture field there was no correlation between ECa and organic matter or between ECa and soil clay and sand content. However, a significant positive correlation was shown for the remaining phosphorus. In the sandy loam texture field the ECa had a significant positive correlation with clay content and a significant negative correlation with sand content. The results suggest that the mapping of apparent soil electrical conductivity does not replace traditional soil sampling, however, it can be used as information to delimit regions in a field that have similar soil attributes.
Key words:Precision agriculture. Management zones. Soil sampling.
RESUMO - O mapeamento da condutividade elétrica aparente do solo (CEa) tornou-se importante para caracterizar a variabilidade do solo em sistemas de agricultura de precisão. A CEa pode ser usada para definir os pontos de amostragem para mapeamento de atributos químicos e físicos do solo? O objetivo deste trabalho foi avaliar as relações entre CEa e atributos do solo em duas áreas com texturas de solo diferentes. Em cada área, 50 pontos de amostragem foram escolhidos considerando uma linha de caminhamento que apresentou alta variabilidade de CEa, obtida através de um mapeamento preliminar do atributo. Em cada ponto de amostragem a CEa foi mensurada nas profundidades de 0-20, 0-40 e 0-60 cm do solo, recolhendo-se também amostras de solo para determinação dos atributos físicos e químicos em laboratório. Os dados de CEa mensurados em diferentes profundidades do solo foram muito similares. Observou-se um grande número de correlações significativas entre CEa e os atributos do solo. Na área de solo arenoso, não houve correlação entre CEa e matéria orgânica ou entre CEa e teor de argila e de areia. Entretanto, uma correlação positiva significativa foi observada para o fósforo remanescente. Na área de solo argiloso, a CEa teve correlação positiva significativa com o teor de argila e correlação negativa significativa com o teor de areia. Os resultados sugerem que o mapeamento da CEa não substitui a amostragem tradicional do solo, porém, pode ser utilizada como informação para delimitar regiões que apresentam atributos de solo semelhantes em uma área.
Palavras-chave:Agricultura de precisão. Zonas de manejo. Amostragem do solo.
DOI: 10.5935/1806-6690.20180005 *Autor para correspondência
Recebido para publicação em 26/02/2015; aprovado em 26/04/2017
1Parte da Dissertação do primeiro autor apresentada no Programa de Pós-Graduação em Engenharia Agrícola/DEA/UFV
2Departamento de Engenharia Agrícola, Universidade Federal de Viçosa/UFV, Avenida Peter Henry Rolfs, s/n - Campus Universitário, Viçosa-MG,
INTRODUCTION
Globally, Brazil is an important grain producer. This position was achieved with the aid of research and development programs including plant breeding, mechanization, and incorporating new methods and techniques of cultivation. It is important to highlight the intensification of no-till planting systems, and more recently, the use of precision agriculture systems.
The use of precision agriculture has become an important tool for producing food to meet the demands of the global population, to improve economic return and to preserve the environment. It is described as a set of tools applied to agriculture that enables site specific management of agriculture areas. The application of precision agriculture is generally conducted by considering the spatial and temporal variability of crop fields to increase production.
Mapping of the apparent soil electrical
conductivity (ECa) has been adopted in precision
agriculture systems to characterize the variability of chemical and physical soil attributes. Research has shown that apparent soil electrical conductivity is highly correlated with different chemical and physical soil properties and also with crop yields (ALCÂNTARA;
REIS; QUEIROZ, 2012; FAROOQUE et al., 2012;
GHOLIZADEH et al., 2012; MOLIN; FAULIN,
2013; MORARI; CASTRIGNANÒ; PAGLIARIN,
2009; SUDDUTHet al., 2005; TERRÓN et al., 2011;
VALENTEet al., 2012). Because of these correlations,
areas with similar soil characteristics are identified more quickly and at a lower cost and treated in a site-specific way.
However, apparent soil electrical conductivity is influenced by a large number of soil attributes, which complicates the interpretation of the generated maps of this soil attribute. For instance, it may be influenced by static or dynamic soil characteristics such as salinity, texture, mineralogy, moisture content, density, temperature and organic matter content (EKWUE; BARTHOLOMEW,
2010; FRIEDMAN, 2005; JOHNSON et al., 2003;
MORAL; TERRÓN; SILVA, 2010). Corwin and Lesch (2003) report that attributes with a greater influence on apparent soil electrical conductivity should be identified
in each analyzed field. The ECa can be used to locate
the soil sampling points for mapping the chemical and physical soil attributes? Thus, considering the potential application and demand for studying the relationship between the apparent soil electrical conductivity and soil attributes, the objective of this work was to analyze the relations between apparent soil electrical conductivity and soil attributes that are used for managing precision agriculture systems.
MATERIAL AND METHODS
Characterization of the fields used for studying the apparent soil electrical conductivity
This study was performed in two agricultural fields located in the municipalities of Viçosa (Field 1) and Ponte Nova (Field 2), with different physical attributes of soil. According to the Köppen system, the climate of Viçosa and Ponte Nova is characterized as Cwb. This is a mesothermic climate with mild, rainy summers and dry winters. The soil of study area is kandic oxisol, in soft to wavy relief. The predominant vegetation is characterized as a submontane seasonal semideciduous Forest. The geology of the area is characterized by the predominance of banded and migmatite orthognaisse, with the presence of hornblende-biotite and amphibole-biotite.
The Field 1, with an area of 10,703.72 m2, presents
a sandy clay loam texture and was not being cultivated
for four years. The Field 2, with an area of 14,078.68 m2,
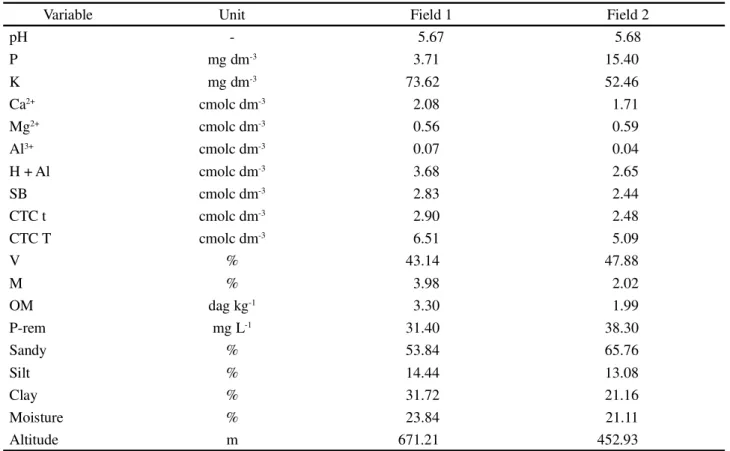
presents a sandy loam texture and was being cultivated with sugarcane around for four years. Table 1 shows the soil chemical and physical characteristics of the study area.
In a preliminary analysis, the apparent soil electrical conductivity was mapped in Field 1 and Field 2. During this analysis, 203 and 163 apparent soil electrical
conductivity (ECa) measurements were made in Field 1
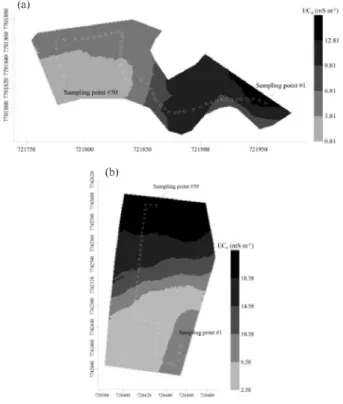
and Field 2, respectively. The measurements were obtained using a portable Landviser® brand model LandMapper® ERM-02, which uses the principle of electrical resistivity through a four-electrode contact probe. The electrodes were configured based on the Wenner matrix, as described by Corwin and Hendrickx (2002) and Corwin and Lesch (2003), to measure the apparent soil electrical conductivity in the 0-0.20 m soil profile. For both fields, the apparent soil electrical conductivity maps, using the kriging methodology, were generated (Figure 1).
From the apparent soil electrical conductivity map of each field, a path through the field was defined for analysis. In both fields, the path was obtained by marking 50 sampling points such that they represented a high variability of the apparent soil electrical conductivity (Figure 1). Each sampling point represented an area of 2×2 m where apparent soil electrical conductivity measurements were conducted on 20 different days. The
ECa determinations were performed over 20 days between
October 19th and December 19th, 2012 in the raining
season. This procedure permitted the collection of the ECa
under different soil moisture conditions.
Table 1 - Soil chemical and physical characteristics of Field 1 and Field 2
pH (1:2,5); P – phosphorus; K – potassium; Ca – calcium; Mg – magnesium; Al – aluminium; H + Al – potential acidity; SB – base sum; CTC t – effective cation exchange capacity; CTC T – total cátion exchange capacity; V – base saturation; m – aluminium saturation; OM – organic matter; P-rem – remaining phosphorus. P – K: Mehlich 1 extractor; Ca - Mg - Al – KCl 1 mol/L extractor; H+Al – calcium acetate extractor 0,5 mol/L pH 7,0; Moisture: average of 25 samples in 20 days
Variable Unit Field 1 Field 2
pH - 5.67 5.68
P mg dm-3 3.71 15.40
K mg dm-3 73.62 52.46
Ca2+ cmolc dm-3 2.08 1.71
Mg2+ cmolc dm-3 0.56 0.59
Al3+ cmolc dm-3 0.07 0.04
H + Al cmolc dm-3 3.68 2.65
SB cmolc dm-3 2.83 2.44
CTC t cmolc dm-3 2.90 2.48
CTC T cmolc dm-3 6.51 5.09
V % 43.14 47.88
M % 3.98 2.02
OM dag kg-1 3.30 1.99
P-rem mg L-1 31.40 38.30
Sandy % 53.84 65.76
Silt % 14.44 13.08
Clay % 31.72 21.16
Moisture % 23.84 21.11
Altitude m 671.21 452.93
The post-processed differential correction was conducted using the database of the Brazilian Institute of Geography and Statistics (IBGE). The datum used was SIRGAS 2000 and the data correction was performed using the GNSS Solutions ™ software supplied by the GPS device maker.
Determination of apparent soil electrical conductivity
Three different four-electrode configurations based on the Wenner matrix (CORWIN; HENDRICKX, 2002; CORWIN; LESCH, 2003) were used. Electrode spacing for the first probe was 0.20 m (designated as
ECa20); the second probe electrode spacing was 0.40 m
(designated as ECa40); and the third electrode spacing
was 0.60 m (designated as ECa60). The probe electrode
spacing determined the soil depth of ECa measurement,
thus the three probes measured ECa from surface to 0.2,
0.4 and 0.6m, respectively. For each daily measurement,
the ECa was measured with the three probes in less than
40 minutes to cover all the 50 sampling points, which was done to avoid the effects of temperature and soil moisture variation during the measurements.
Physical and chemical soil attributes determination
For each of the sampling points (Figure 1), a soil sample composed of four single samples representing the 0-0.20 m layer was obtained. This layer was chosen because it is the most common layer used in precision agriculture management. The samples were collected with a Dutch auger at a distance of up to 2.0 m from the georeferenced sampling point, and after homogenization, a soil sample of approximately 300 g was collected.
The soil moisture content, %, was determined by a thermo-gravimetric Embrapa method (DONAGEMA
et al., 2011). From the 50 sampling points, the samples
with an even number were chosen for soil moisture determination. Then, the samples were conditioned to avoid the loss of water and sent to the laboratory where they were weighed and dried at 105 °C for twenty-four hours to determine the mass of the dry soil.
Soil particle size analysis was performed using the
Embrapa pipette method (DONAGEMAet al., 2011) to
Figure 1 - The apparent soil electrical conductivity maps determined for the 0-0.20 m soil layer with the sampling points marked in white for (a) Field 1 and (b) Field 2
soil. A chemical characterization of the soil was completed by determining the active acidity (pH), potential acidity
(H + Al), calcium (Ca2+), magnesium (Mg2+), potassium
(K+), aluminum (Al+3), phosphorus (P), remaining
phosphorus (P-rem), organic matter (OM), sum of bases (SB), effective cation exchange capacity (CEC t), cation exchange capacity of soil at pH 7 (CEC T), aluminum saturation (m) and base saturation (V) using Embrapa
method (DONAGEMAet al., 2011).
Analysis of the relationship between apparent soil electrical conductivity and soil physical and chemical attributes
First, an exploratory data analysis was performed. In this analysis, the outliers were removed using the method presented by Hoaglin, Mosteller and Tukey
(1992) and Libardiet al. (1996). The final decision as to
whether a data point needed to be removed was based on the comparison of each outlier candidate and the values of the apparent soil electrical conductivity in the neighboring data points. If the outlier candidate value presented a great discontinuity related to the neighbor points, then this data point was removed. After removing the outliers, the
following statistical parameters were obtained: the mean value, minimum and maximum values, standard deviation and coefficient of variation. The z-test was performed to compare the attributes of the two fields. The Pearson correlation between the apparent soil electrical conductivity and each soil attribute determined by laboratory analysis was obtained.
RESULTS AND DISCUSSION
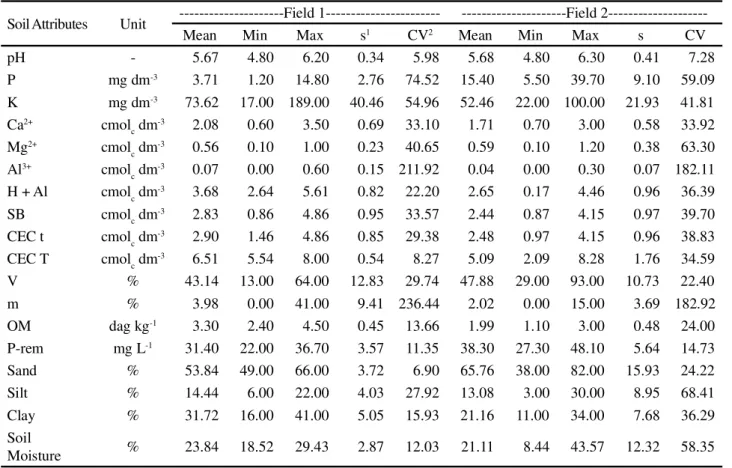
The results of the descriptive statistical analysis for both fields are presented in Table 2.
Using the z-test, it was found that the mean soil attributes of Field 1 were significantly different from
those of Field 2 (p ≤ 0.05), except for the soil attributes
pH, Mg2+ and silt. Both fields were characterized by pH
values favorable to plant development, and the values of the coefficient of variation for this attribute were lower than 12% (Table 2), which according to the classification proposed by Warrick and Nielsen (1980), is low. According to these authors, this parameter has an average variation of 12% < CV < 60% and a high variation if CV > 60%. Field 1 presented a high coefficient of variation in the
concentration of P, Al3+ andm, and a low variation of CEC
T, P-rem and sand content (Table 2). The other measured soil attributes from Field 1 had CV values classified as medium (Table 2). Field 2 presented high values of
CV for Mg, Al3+,m and silt content; while only the soil
attribute of pH presented a low CV value (Table 2). In general, Field 2 showed a greater variability of the 19 soil attributes measured, with 13 showing higher CV values when compared to Field 1. The physical soil attributes tended to have more variation in Field 2 than on Field 1. The main reason for these results was that the Field 2 was being cultivated with sugarcane for four years.
The soil moisture content was measured in 25 of 50 sampling points along the pathway line during 20 different days. The soil moisture average for the 20 days of measurement ranged from 19.81 to 26.07% for Field 1 and from 15.89 to 24.74% for Field 2. This variation occurred because the data was collected during the raining season. The ranges of variation for soil moisture of each point of measurement are shown in Figure 2.
related to the soil texture variation observed in the field and confirmed by the texture analysis. Sampling points 30 to 50 had higher percentages of sand (above 70%) and lower clay than the other sampling points. According to
Libardi (2005), the properties of the clay define the soil water holding capacity, and the variation in soil moisture of a field is then related to the spatial variability of clay content.
Table 2 - Summary statistic results for soil attributes of Field 1 and 2
1s – standard deviation;2CV – coefficient of variation; pH – hydrogen ion activity (1:2.5); P – phosphorous; K – potassium; Ca – Calcium; Mg
– Magnesium; Al – Aluminum; H + Al – Potential acidity; SB – Sum of bases; CEC t – Effective cation exchange capacity; CEC T – Cation exchange capacity at pH 7; V – Base saturation; m – Aluminum saturation; OM – Organic matter Walkley-Black method (organic C × 1.724); P-rem – Remaining phosphorous, P – K: Mehlich-1 Extractor; Ca - Mg - Al: KCl 1 mol/L extractor; H + Al: Calcium acetate 0.5 mol/L pH 7.0 extractor; Soil moisture, mean value of the 25 sampling points in the 20 days of measurement
Soil Attributes Unit ---Field 1--- ---Field
2---Mean Min Max s1 CV2 Mean Min Max s CV
pH - 5.67 4.80 6.20 0.34 5.98 5.68 4.80 6.30 0.41 7.28
P mg dm-3 3.71 1.20 14.80 2.76 74.52 15.40 5.50 39.70 9.10 59.09
K mg dm-3 73.62 17.00 189.00 40.46 54.96 52.46 22.00 100.00 21.93 41.81
Ca2+ cmol
c dm-3 2.08 0.60 3.50 0.69 33.10 1.71 0.70 3.00 0.58 33.92
Mg2+ cmol
c dm-3 0.56 0.10 1.00 0.23 40.65 0.59 0.10 1.20 0.38 63.30
Al3+ cmol
c dm-3 0.07 0.00 0.60 0.15 211.92 0.04 0.00 0.30 0.07 182.11
H + Al cmolc dm-3 3.68 2.64 5.61 0.82 22.20 2.65 0.17 4.46 0.96 36.39
SB cmolc dm-3 2.83 0.86 4.86 0.95 33.57 2.44 0.87 4.15 0.97 39.70
CEC t cmolc dm-3 2.90 1.46 4.86 0.85 29.38 2.48 0.97 4.15 0.96 38.83
CEC T cmolc dm-3 6.51 5.54 8.00 0.54 8.27 5.09 2.09 8.28 1.76 34.59
V % 43.14 13.00 64.00 12.83 29.74 47.88 29.00 93.00 10.73 22.40
m % 3.98 0.00 41.00 9.41 236.44 2.02 0.00 15.00 3.69 182.92
OM dag kg-1 3.30 2.40 4.50 0.45 13.66 1.99 1.10 3.00 0.48 24.00
P-rem mg L-1 31.40 22.00 36.70 3.57 11.35 38.30 27.30 48.10 5.64 14.73
Sand % 53.84 49.00 66.00 3.72 6.90 65.76 38.00 82.00 15.93 24.22
Silt % 14.44 6.00 22.00 4.03 27.92 13.08 3.00 30.00 8.95 68.41
Clay % 31.72 16.00 41.00 5.05 15.93 21.16 11.00 34.00 7.68 36.29
Soil
Moisture % 23.84 18.52 29.43 2.87 12.03 21.11 8.44 43.57 12.32 58.35
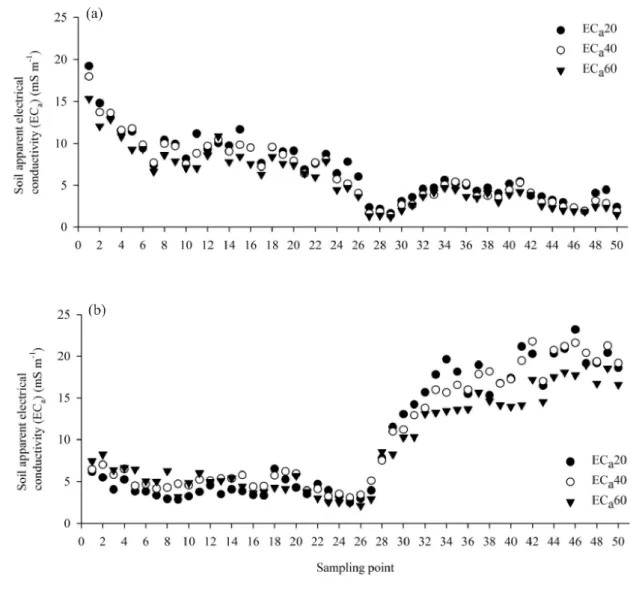
The mean values of ECa for each soil layer in the 50 sampling points in the two Fields are presented in Figure 3.
The average values of ECa determined in different
layers of soil (ECa20, ECa40 and ECa60) showed similar
behavior within each field. Field 1 presented values of
ECa between 0.5 and 20 mS m-1 and Field 2 between 1.0
and 24 mS m-1. These values are similar to those found
by other researchers in non-saline soils (AIMRUNet al.,
2007; ALCÂNTARA; REIS; QUEIROZ, 2012; FAULIN;
MOLIN, 2006; VALENTEet al., 2012). As the ECa value
is directly influenced by the amount of dissolved salts in the soil solution, it is expected that the values found here are lower compared to those of saline soils and those found in temperate climate regions. The source material involved in soil formation, and the climatic conditions that soils have been exposed to, reflect the type, quantity
and quality of clay, and consequently, the cation exchange capacity, the amount of ions available to the soil solution
and ultimately the values of ECa.
When the values of soil moisture to mean values
of ECa in each field are compared (Figures 2 and 3), it
was observed that the average ECa was higher in those
points with higher moisture content. This relationship was more expressive for Field 2. To statistically determine this relationship, linear correlation analyses were performed
between soil moisture and the ECa values obtained at
different soil depths for both fields and each day of measurement (Table 3).
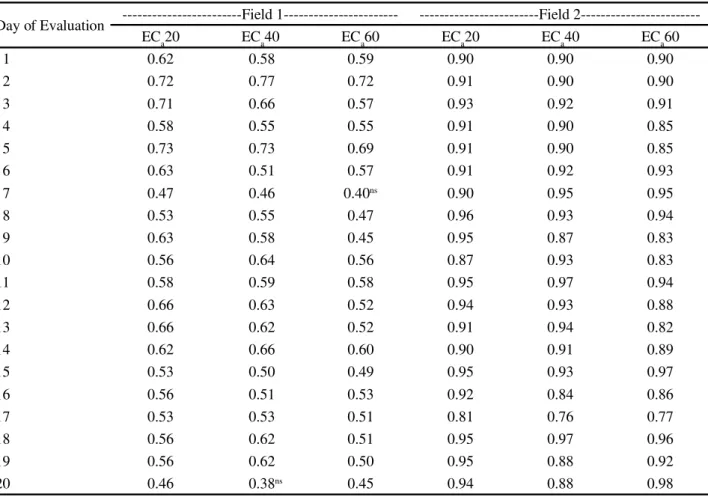
For Field 1, the correlations between ECa and soil
moisture were not significant for ECa60 only on the seventh
day of evaluation and for ECa40 only on the twentieth
day of evaluation (Table 3). For the other correlations,
as well as all sampling points in Field 2, correlation values were statically significant (Table 3), indicating a close relationship between the two soil attributes and that
soil moisture positively affects the values of ECa. The
relationship between ECa and soil moisture has been studied
by several researchers (BREVIK; FENTON; LAZARI,
2006; EKWUE; BARTHOLOMEW, 2010; ISLAM et
al., 2012; RHOADES, 1996; SERRANO; SHAHIDIAN;
SILVA, 2013). In this work, the relationship between ECa
and soil moisture was stronger in Field 2, which is indicated by the higher correlation coefficient values (Table 3). This behavior is justified by a greater soil moisture variability of soil in the field. When a higher soil moisture occurs, there is a greater ability to conduct electrical current through the pore water, which contains dissolved electrolytes. The amount of water does not indicate the presence of loads in the ground, but it plays an important role in the formation of the solution that conducts electric current (CORWIN; LESCH, 2005).
The correlation analysis between the ECa for
different soil depth and the measured soil attributes
showed similar values for all of the data acquisition days. Therefore, only the results of the correlation between the
mean values of ECa of each sampling point and the soil
attribute values are presented (Table 4).
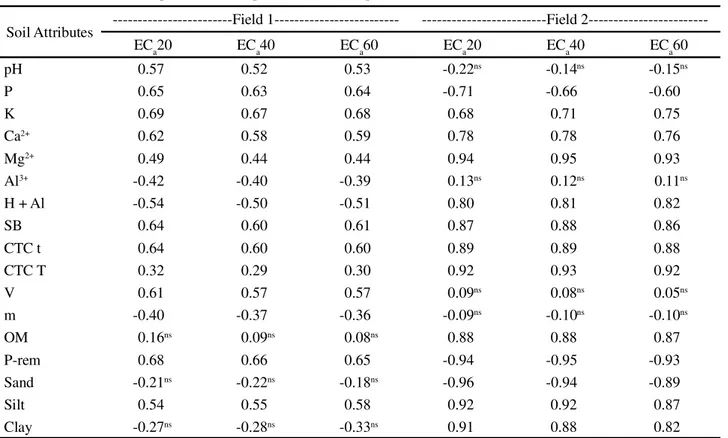
In general, there were a large number of
significant correlations (p≤0.05) between ECa and
soil attributes, with great similarity between the data obtained for different soil depths (Table 4). In Field
1, there was no correlation between ECa and organic
matter and with the physical attributes of sand and clay
contents. The ECa did not correlate with clay content;
however, it presented a significant positive correlation with the remaining phosphorous, which was similar to
what was found by Valente et al. (2012). In this case,
other interactions among soil attributes were more relevant in the change of soil charge, which caused a
positive correlation between ECa and the remaining
phosphorus. The largest coefficient was r = 0.69,
between the ECa20 and K content, and this value was
also observed for apparent soil electrical conductivity
of ECa40 and ECa60 (Table 4).
Table 3 - Pearson’s coefficient of correlation between soil electrical conductivity values and soil moisture evaluated at three soil depths (0-0.20 m ECa20, 0-0.40 m ECa40 and 0-0.60 m ECa60) for Field 1 and Field 2
ns – Non-significant (p>0.05). All of the other values were significant at p≤0.05
Day of Evaluation ---Field 1--- ---Field
2---ECa20 ECa40 ECa60 ECa20 ECa40 ECa60
1 0.62 0.58 0.59 0.90 0.90 0.90
2 0.72 0.77 0.72 0.91 0.90 0.90
3 0.71 0.66 0.57 0.93 0.92 0.91
4 0.58 0.55 0.55 0.91 0.90 0.85
5 0.73 0.73 0.69 0.91 0.90 0.85
6 0.63 0.51 0.57 0.91 0.92 0.93
7 0.47 0.46 0.40ns 0.90 0.95 0.95
8 0.53 0.55 0.47 0.96 0.93 0.94
9 0.63 0.58 0.45 0.95 0.87 0.83
10 0.56 0.64 0.56 0.87 0.93 0.83
11 0.58 0.59 0.58 0.95 0.97 0.94
12 0.66 0.63 0.52 0.94 0.93 0.88
13 0.66 0.62 0.52 0.91 0.94 0.82
14 0.62 0.66 0.60 0.90 0.91 0.89
15 0.53 0.50 0.49 0.95 0.93 0.97
16 0.56 0.51 0.53 0.92 0.84 0.86
17 0.53 0.53 0.51 0.81 0.76 0.77
18 0.56 0.62 0.51 0.95 0.97 0.96
19 0.56 0.62 0.50 0.95 0.88 0.92
In Field 2, only the correlations between ECa
and pH, Al, V andm soil attributes were not statistically
significant. Analyzing the soil texture for Field 2
(different from Field 1), the ECa had a significant positive
correlation with clay (r = 0.91 for ECa20) and a negative
correlation with sand (r = -0.96 for ECa20), as shown
in Table 4. This behavior agrees with those found by
Gholizadehet al. (2012) and Souzaet al. (2004), where
the correlations were significant and positive between
ECa and clay content, respectively, and were significant
and negative between ECa and sand content, respectively,
with r = -0.437 (p<0.01). This occurs because soils with higher clay content present a greater soil water capacity, and consequently, higher electrical conductivity.
Other authors have also found a significant correlation between the apparent soil electrical
conductivity and soil physical attributes (ISLAM et al.,
2012; LESCH; CORWIN; ROBINSON, 2005; MOLIN;
CASTRO, 2008; RODRÍGUEZ-PÉREZ et al., 2011),
as was observed in the present work in Field 2 (Table
4). However, in other studies (AIMRUN et al., 2007;
MORARI; CASTRIGNANÒ; PAGLIARIN, 2009;
SERRANO et al., 2010; VALENTE et al., 2012), there
was no correlation or the correlation was low between ECa
and soil particle size, which occurred in Field 1 of this study (Table 4). The dynamics and the interaction among the soil attributes are decisive in the range of variation of the apparent soil electrical conductivity, which can cause
positive and negative correlations between ECa and the
other soil attributes. In certain situations, the clay content variability amount is capable of causing high variation in the apparent soil electrical conductivity, which hides
the effect of other soil attributes on ECa. However, when
the variability of the clay content is not high enough to cause variation in the apparent soil electrical conductivity, other soil attributes and the interaction between them are
the cause of ECa variability. In this case, the variation
of the clay type or the soil chemical attribute variations modify the soil charges, and consequently, the electrical conductivity.
Soil Attributes ---Field 1--- ---Field
2---ECa20 ECa40 ECa60 ECa20 ECa40 ECa60
pH 0.57 0.52 0.53 -0.22ns -0.14ns -0.15ns
P 0.65 0.63 0.64 -0.71 -0.66 -0.60
K 0.69 0.67 0.68 0.68 0.71 0.75
Ca2+ 0.62 0.58 0.59 0.78 0.78 0.76
Mg2+ 0.49 0.44 0.44 0.94 0.95 0.93
Al3+ -0.42 -0.40 -0.39 0.13ns 0.12ns 0.11ns
H + Al -0.54 -0.50 -0.51 0.80 0.81 0.82
SB 0.64 0.60 0.61 0.87 0.88 0.86
CTC t 0.64 0.60 0.60 0.89 0.89 0.88
CTC T 0.32 0.29 0.30 0.92 0.93 0.92
V 0.61 0.57 0.57 0.09ns 0.08ns 0.05ns
m -0.40 -0.37 -0.36 -0.09ns -0.10ns -0.10ns
OM 0.16ns 0.09ns 0.08ns 0.88 0.88 0.87
P-rem 0.68 0.66 0.65 -0.94 -0.95 -0.93
Sand -0.21ns -0.22ns -0.18ns -0.96 -0.94 -0.89
Silt 0.54 0.55 0.58 0.92 0.92 0.87
Clay -0.27ns -0.28ns -0.33ns 0.91 0.88 0.82
Table 4 - Pearson’s coefficient of correlation between the mean values of soil apparent electrical conductivity measured at three different depths (0-0.20 m ECa20, 0-0.40 m ECa40 and 0-0.60 m ECa60) and the soil attributes for Field 1 and Field 2
ns – Non-significant (p > 0.05). All of the other values were significant at p ≤ 0.05. pH – hydrogen ion activity (1:2.5); P – phosphorous; K –
CONCLUSION
The results suggest that it is not feasible to use the apparent soil electrical conductivity to make generalized estimates of soil attributes. However, the apparent soil electrical conductivity can be applied as a tool for mapping the spatial variability of soil attributes. In other words,
the ECa can be used to separate different types of soils
presented in a field. Mapping the electrical conductivity, while not a replacement for soil sampling, can be used to define management zones. Management zones could then be used to direct a soil sampling and the application of lime and fertilizers at variable rates.
ACKNOWLEDGMENTS
The authors would like to thank FAPEMIG (The Minas Gerais State Foundation for Research) and CNPq (The Brazilian National Counsel for Research and Development) for their financial support to perform this work.
REFERENCES
AIMRUN, W.et al. Spatial variability of bulk soil electrical conductivity in a Malaysian paddy field: key to soil management.Paddy Water Environment, v. 5, n. 2, p. 113-121, 2007.
ALCÂNTARA, G. R.; REIS, E. F.; QUEIROZ, D. M. Produtividade de culturas correlacionada com condutividade elétrica aparente de um solo sob plantio direto. Revista Agrotecnologia, v. 3, n. 2, p. 62-72, 2012.
BREVIK, E. C.; FENTON, T. E.; LAZARI, A. Soil electrical conductivity as a function of soil water content and implications for soil mapping. Precision Agriculture, v. 7, n. 6, p. 393-404, 2006.
CORWIN, D. L.; HENDRICKX, J. M. H. Electrical resistivity: Wenner array.In: SILVA, J. S.Methods of soil analysis: Part 4. Physical methods. Madison, USA: Soil Science Society of America, 2002. p. 1282-1287. (SSSA Book Series, n. 5). CORWIN, D. L.; LESCH, S. M. Apparent soil electrical conductivity measurements in agriculture. Computers and Electronics in Agriculture, v. 46, n. 1/3, p. 11-43, 2005.
CORWIN, D. L.; LESCH, S. M. Application of soil electrical conductivity to precision agriculture: theory, principles, and guidelines.Agronomy Journal, v. 95, n. 3, p. 455-471, 2003. DONAGEMA, G. K.et al.Manual de métodos de análise de solo. 2. ed. Rio de Janeiro: Embrapa, 2011. 212 p.
EKWUE, E. I.; BARTHOLOMEW, J. Electrical conductivity of some soils in Trinidad as affected by density, water and peat content.Biosystems Engineering, v. 108, n. 2, p. 95-103, 2010.
FAROOQUE, A. A. et al. Delineating management zones for site specific fertilization in wild blueberry filds. Applied Engineering in Agriculture, v. 28, n. 1, p. 57-70, 2012.
FAULIN, G. D. C.; MOLIN, J. P. Amplitude dos valores da umidade e sua influência na mensuração da condutividade elétrica do solo. In: CONGRESSO BRASILEIRO DE AGRICULTURA DE PRECISÃO, 2., 2006, São Pedro, SP. Anais... São Pedro, SP: ESALQ: USP, 2006. p. 1-9.
FRIEDMAN S. P. Soil properties influencing apparent electrical conductivity: a review.Computers and Electronics in Agriculture, v. 46, n. 1/3, p. 45-70, 2005.
GHOLIZADEH, A. et al. Relationship between apparent electrical conductivity and soil physical properties in a Malaysian paddy field.Agronomy and Soil Science, v. 58, n. 2, p. 155-168, 2012.
HOAGLIN, D. C.; MOSTELLER, F; TUKEY, J. W. Análise exploratória de dados: técnicas robustas:um guia. Lisboa: Edições Salamandra, 1992. 446 p.
ISLAM, M. M.et al.Comparing apparent electrical conductivity measurements on a paddy field under flooded and drained conditions.Precision Agriculture, v. 13, n. 3, p. 384-392, 2012. JOHNSON C. K. et al.Site-specific management zones based upon soil electrical conductivity in a semiarid cropping system. Agronomy Journal, v. 95, n. 2, p. 303-315, 2003.
LESCH, S. M.; CORWIN, D. L.; ROBINSON, D. A. Apparent soil electrical conductivity mapping as an agricultural management tool in arid zone soils.Computer and Electronics in Agriculture, v. 46, n. 1/3, p. 351-378, 2005.
LIBARDI, P. L. Dinâmica da água no solo. São Paulo: Ed. USP, 2005. v. 61, 335 p.
LIBARDI, P. L.et al.Variabilidade da umidade gravimétrica de um solo hidromórfico.Revista Brasileira de Ciência do Solo, v. 20, n. 1, p. 1-12, 1996.
MOLIN, J. P.; CASTRO, C. N. Establishing management zones using soil electrical conductivity and other soil properties by the fuzzy clustering technique. Scientia Agricola, v. 65, n. 6, p. 567-573, 2008.
MOLIN, J. P.; FAULIN, G. D. C. Spatial and temporal variability of soil electrical conductivity related to soil moisture.Scientia Agricola, v. 70, n. 1, p. 1-5, 2013. MORAL, F. J.; TERRÓN, J. M.; SILVA, J. R. M. D. Delineation of management zones using mobile measurements of soil apparent electrical conductivity and multivariate geostatistical techniques.Soil and Tillage Research, v. 106, n. 2, p. 335-343, 2010.
MORARI, F.; CASTRIGNANÒ, A.; PAGLIARIN, C. Application of multivariate geostatistics in delineating management zones within a gravelly vineyard using geo-electrical sensors. Computers and Electronics in Agriculture, v. 68, n. 1, p. 97-107, 2009.
Chemical methods. Madison, USA: Soil Science Society of America , 1996. p. 417-435. (SSSA Book Series, n. 5). RODRÍGUEZ-PÉREZ, J. R.et al.Using apparent soil electrical conductivity (ECa) to characterize vineyard soils of high clay content.Precision Agriculture, v. 12, n. 6, p. 775-794, 2011. SERRANO, J. M.et al. Medição e mapeamento da condutividade eléctrica aparente do solo em pastagens.Revista de Ciências Agrárias, v. 33, n. 2, p. 5-14, 2010.
SERRANO, J. M.; SHAHIDIAN, S.; SILVA, J. R. M. Apparent electrical conductivity in dry versus wet soil conditions in a shallow soil. Precision Agriculture, v. 14, n. 1, p. 99-114, 2013.
SOUZA, Z. M. et al. Variabilidade espacial da textura de um latossolo vermelho amarelo eutroférrico sob cultivo de
cana-de-açúcar. Engenharia Agrícola, v. 24, n. 2, p. 309-319, 2004.
SUDDUTH, K. A.et al. Relating apparent electrical conductivity to soil properties across the north-central USA.Computers and Electronics in Agriculture, v. 46, n. 1/3, p. 263-283, 2005.
TERRÓN, J. M.et al.Soil apparent electrical conductivity and geographically weighted regression for mapping soil.Precision Agriculture, v. 12, n. 5, p. 750-761, 2011.
VALENTE, D. S. M.et al.The relationship between apparent soil electrical conductivity and soil properties.Revista Ciência Agronômica, v. 43, n. 4, p. 683-690, 2012.
WARRICK, A. W.; NIELSEN, D. R. Spatial variability of soil physical properties in the field.In: HILLEL, D.Applications of soil physics. New York: Academic Press, 1980. p. 319-344.