JSCS–4091 Original scientific paper
Studies of viscous antagonism, excess molar volumes, viscosity
deviation and isentropic compressibility of ternary mixtures
containing N,N-dimethylformamide, benzene
and some ethers at 298.15 K
RIJU CHANDA, ASHIS BANERJEE and MAHENDRA NATH ROY* Department of Chemistry, North Bengal University, Darjeeling-734013, India
(Received 6 August 2009, revised 27 August 2010)
Abstract: The densities (ρ) and viscosities (η) for ternary liquid mixtures of N,N-dimethylformamide + benzene + an ether were measured as a function of composition at 298.15 K. From experimental measurements, the excess molar volumes (VE), viscosity deviation (Δη), antagonic interaction index (IA) and
Gibbs free energy of activation for viscous flow (ΔGE) were evaluated. The speeds of sound were also measured and excess isentropic compressibilities (KsE) were calculated at the experimental temperature. The results are
dis-cussed and interpreted in terms of molecular package and specific interaction predominated by hydrogen bonding.
Keywords: viscous antagonism; viscosity deviations; excess molar volumes; isentropic; compressibility; molecular interactions.
INTRODUCTION
The grouping of solvents into classes is often based on the nature of inter-molecular forces because the manner in which solvent molecules are associated with each other has a marked effect on the resulting properties. Rheology is the branch of science1 that studies material deformation and flow, and is increasingly applied to analyze the viscous behaviors of many pharmaceutical products,2 and to establish their stability and even bio-availability, since it has been firmly established that viscosity influences the absorption rate of a drug in the body. The increasing use of the solvents: N,N-dimethylformamide (DMF), benzene,
1,3-di-oxolane, 1,4-dioxane, tetrahydrofuran, 1,2-dimethoxyethane, di-isopropyl ether, diethyl ether, 2-methoxyethanol and 2-ethoxyethanol and their mixtures in many industrial processes, such as battery, pharmaceutical and cosmetics, has greatly stimulated the need for extensive information on their various properties. Hence,
the present study gives extensive information on the various properties when these ethers are taken with DMF and benzene as mixed solvent systems.1–7 The determination of density, viscosity and speed of sound are valuable tools to learn about the liquid state8,9 because of the close connection between liquid structure and macroscopic properties.
The viscosity and density of these ternary liquid mixtures were used to understand the molecular interactions between the components of the mixture to develop new theoretical models and also for engineering applications.10,11 In systematic investigations, the viscosities, densities and speeds of sound of diffe-rent solvents and their mixtures were reported in previous papers.12–18
The present work contributes and extends the study of density (ρ), viscosity deviations (Δη), viscous antagonism, excess molar volumes (VE) and isentropic
compressibility (KsE) to mixtures of DMF and benzene with some ethers, where DMF is represented as A, benzene as B and the ethers as C.
EXPERIMENTAL
DMF (C3H7NO) was obtained from Merck and LR, and further purified by standard
methods.19 Benzene (S. D. Fine Chemicals, purity > 99 %) was further purified by means of a
simple distillation technique with the first and last 20 % of the distillate being discarded20–22
and finally the density and viscosity value were compared with the literature.23 The final
pu-rities of the obtained solvents were >99.5 %.
The experimental ethers, namely 1,3-dioxolane (1,3-DO), 1,4-dioxane (1,4-DO), tetra-hydrofuran (THF), 1,2-dimethoxyethane(1,2-DME), di-isopropyl ether (DIE), diethyl ether (DEE), 2-methoxy ethanol (2-ME) and 2-ethoxyethanol (2-EE) were obtained from Merck and LR. These were further purified by standard methods.24–27 The purities of the liquids was
ascertained by GLC and also by comparing the experimental values of densities, viscosities and sound velocities with those reported in the literature,24,27–35 as listed in Table I. The
pu-rities of the finally obtained solvents were >99 %.
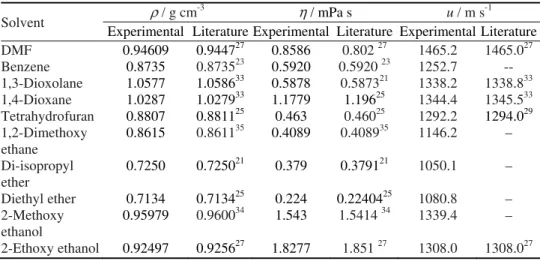
TABLE I. Physical properties of the pure solvents at 298.15 K
Solvent ρ / g cm
-3 η / mPa s u / m s-1
Experimental Literature Experimental Literature Experimental Literature
DMF 0.94609 0.944727 0.8586 0.802 27 1465.2 1465.027
Benzene 0.8735 0.873523 0.5920 0.5920 23 1252.7 --
1,3-Dioxolane 1.0577 1.058633 0.5878 0.587321 1338.2 1338.833
1,4-Dioxane 1.0287 1.027933 1.1779 1.19625 1344.4 1345.533
Tetrahydrofuran 0.8807 0.881125 0.463 0.46025 1292.2 1294.029
1,2-Dimethoxy ethane
0.8615 0.861135 0.4089 0.408935 1146.2 –
Di-isopropyl ether
0.7250 0.725021 0.379 0.379121 1050.1 –
Diethyl ether 0.7134 0.713425 0.224 0.2240425 1080.8 –
2-Methoxy
ethanol 0.95979 0.9600
34
1.543 1.5414 34 1339.4 –
Densities (ρ) were measured with an Ostwald–Sprengel type pycnometer having a bulb volume of 25 cm3 and an internal diameter of the capillary of about 0.1 cm. The pycnometer
was calibrated at the experimental temperature with triply distilled water and DMF. The mea-surements were realized in a thermostated water bath controlled to ±0.01 K.2 The weighings
were performed on a Mettler electronic balance (AG-285) with a precision of ±0.01 mg. The viscosities (η) were measured by means of a suspended Ubbelohde type viscometer7, which
was calibrated at the desired temperature with triply distilled water and purified methanol using density and viscosity values from the literature. The ultrasonic speeds (u) were deter-mined using a single-crystal variable path ultrasonic interferometer (Mittal Enterprises, New Delhi) working at 5 MHz,32,36 which was calibrated with water, methanol and benzene. The
temperature stability was maintained within ±0.01 K by circulating thermostatic water around the cell with a circulating pump. The solutions were prepared by mixing known volumes of pure liquids in air-tight stoppered bottles at 298.15 K. The precisions of the speed of sound, density and viscosity measurements were ±0.2 m s-1, ±3×10⁻⁴ g cm-3 and ±2×10⁻⁴ mPa s, res-pectively. The estimated uncertainty for the excess molar volume (VE), viscosity deviation (Δη), antagonic interaction index (IA) and excess isentropic compressibilities (KsE) were
±0.5×10⁻⁴ m3 mol-1, ±0.0004 mPa s, ±0.002 and ±0.2 Pa-1, respectively.
RESULTS AND DISCUSSION
The measured density (ρ), viscosity (η) and the speeds of sound (u) data for
mixtures of (DMF) (A), benzene (B), and the ethers (C), i.e., 1,3-dioxolane, 1,4-
-dioxane, tetrahydrofuran, 1,2-dimethoxyethane, di-isopropyl ether, diethyl ether, 2-methoxy ethanol and 2-ethoxyethanol were used to calculate the excess molar volume (VE), viscosity deviation (Δη) and excess isentropic compressibility (KsE).
Viscous antagonism is the term used in respect to the interaction between the components of a system that cause the total viscosity of the latter to be less than the sum of the viscosities of the individual components in the system. The me-thod compares the viscosity of the system determined experimentally, ηexp, with that expected in the absence of interaction, ηcalcd. Viscous antagonism is exists when, ηexp < ηcalcd. This procedure is used when Newtonian fluids are in-volved.37
Quantitatively, as per the absolute reaction rates theory,38 the deviations of viscosities from the ideal mixture values for a three-component system can be calculated as:
3 1 = Δ = − i i
i
x
η η η (1)
where η is the viscosity of the mixture, xi and ηi are the mole fraction and
viscosity of the pure components, respectively. The Δηvalues for all the studied
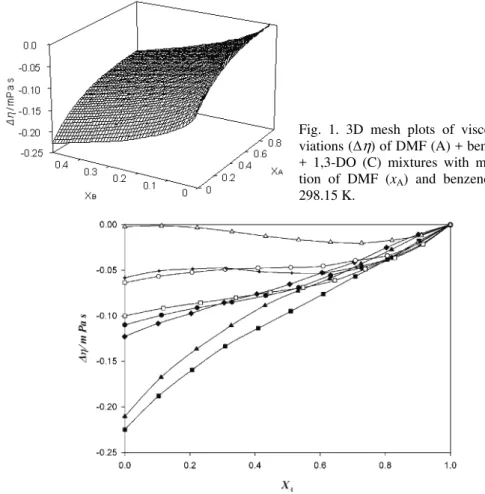
observed that Δη increases as the mole fraction of DMF increases. The mixtures have a tendency of maximization, indicating a strong specific interaction between the unlike molecules. From the values of Δη, given in Table II, it can be con-cluded that the affinity of the molecules of the ethers towards benzene molecules in the presence of DMF is enhanced in the following order:
A + B + 2-EE > 2-ME > DEE > DIE > 1,2-DME > THF >1,4-DO > 1,3-DO Here, dispersion and dipolar interactions between the DMF, benzene and 1,3-DO, 1,4-DO, THF, 1,2-DME, DIE, DEE, 2-ME and 2-EE molecules are ope-rative, resulting in negative Δη but with the increasing xA, the dipolar
inter-actions dominate giving rise to less negative values of Δη.31
Fig. 1. 3D mesh plots of viscosity de-viations (Δη) of DMF (A) + benzene (B) + 1,3-DO (C) mixtures with mole frac-tion of DMF (xA) and benzene (xB) at 298.15 K.
Fig. 2. Viscosity deviations (Δη) of: ■) DMF (A) + benzene (B) + 1,3-DO (C); ▲) DMF (A) + benzene (B) + 1,4-DO (C); ♦) DMF (A) + benzene (B) + THF (C); ●) DMF (A) + benzene (B) + 1,2-DME (C); □) DMF (A) + benzene (B) + DIE (C); ○) DMF (A) + benzene (B) + DEE (C); +) DMF (A) + benzene (B)+ 2-ME (C); ∆) DMF (A)+ benzene (B) + 2-EE (C)
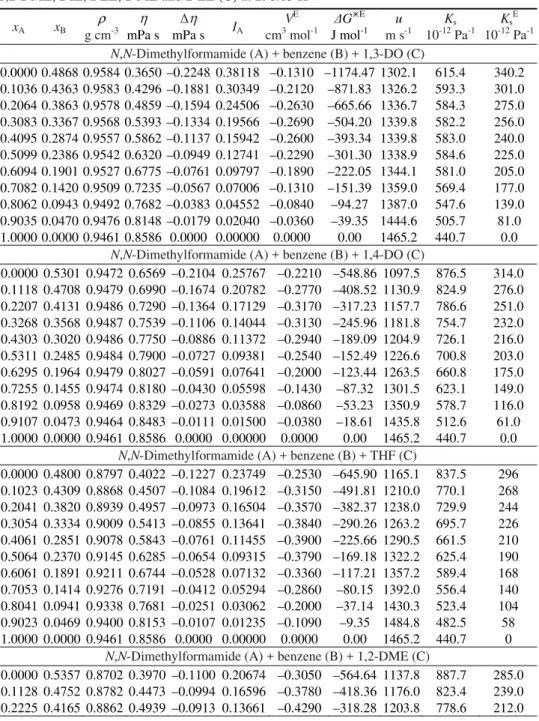
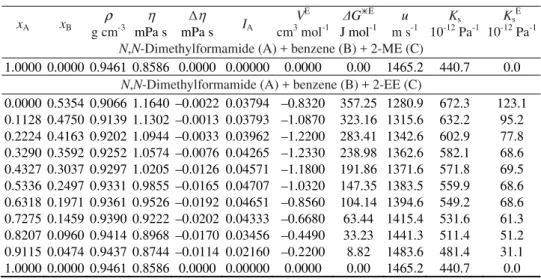
TABLE II. Experimental density (ρ), viscosity (η), viscosity deviations (Δη), antagonic in-teraction index (IA), excess molar volumes (VE), Gibbs energy of activation (ΔGE) of viscous flow, experimental sound velocities (u), isentropic compressibility (Ks) and excess isentropic compressibility (KsE) of N,N-dimethylformamide (A) + benzene (B) + 1,3-DO, 1,4-DO, THF, 1,2-DME, DIE, DEE, 2-ME and 2-EE (C) at 298.15 K
xA xB g cmρ -3 mPa s η mPa s Δη IA V E
cm3 mol-1 ΔG
E
J mol-1 m su -1 10-12K Pas -1 Ks E
10-12 Pa-1 N,N-Dimethylformamide (A) + benzene (B) + 1,3-DO (C)
0.0000 0.4868 0.9584 0.3650 –0.2248 0.38118 –0.1310 –1174.47 1302.1 615.4 340.2 0.1036 0.4363 0.9583 0.4296 –0.1881 0.30349 –0.2120 –871.83 1326.2 593.3 301.0 0.2064 0.3863 0.9578 0.4859 –0.1594 0.24506 –0.2630 –665.66 1336.7 584.3 275.0 0.3083 0.3367 0.9568 0.5393 –0.1334 0.19566 –0.2690 –504.20 1339.8 582.2 256.0 0.4095 0.2874 0.9557 0.5862 –0.1137 0.15942 –0.2600 –393.34 1339.8 583.0 240.0 0.5099 0.2386 0.9542 0.6320 –0.0949 0.12741 –0.2290 –301.30 1338.9 584.6 225.0 0.6094 0.1901 0.9527 0.6775 –0.0761 0.09797 –0.1890 –222.05 1344.1 581.0 205.0 0.7082 0.1420 0.9509 0.7235 –0.0567 0.07006 –0.1310 –151.39 1359.0 569.4 177.0 0.8062 0.0943 0.9492 0.7682 –0.0383 0.04552 –0.0840 –94.27 1387.0 547.6 139.0 0.9035 0.0470 0.9476 0.8148 –0.0179 0.02040 –0.0360 –39.35 1444.6 505.7 81.0 1.0000 0.0000 0.9461 0.8586 0.0000 0.00000 0.0000 0.00 1465.2 440.7 0.0
N,N-Dimethylformamide (A) + benzene (B) + 1,4-DO (C)
0.0000 0.5301 0.9472 0.6569 –0.2104 0.25767 –0.2210 –548.86 1097.5 876.5 314.0 0.1118 0.4708 0.9479 0.6990 –0.1674 0.20782 –0.2770 –408.52 1130.9 824.9 276.0 0.2207 0.4131 0.9486 0.7290 –0.1364 0.17129 –0.3170 –317.23 1157.7 786.6 251.0 0.3268 0.3568 0.9487 0.7539 –0.1106 0.14044 –0.3130 –245.96 1181.8 754.7 232.0 0.4303 0.3020 0.9486 0.7750 –0.0886 0.11372 –0.2940 –189.09 1204.9 726.1 216.0 0.5311 0.2485 0.9484 0.7900 –0.0727 0.09381 –0.2540 –152.49 1226.6 700.8 203.0 0.6295 0.1964 0.9479 0.8027 –0.0591 0.07641 –0.2000 –123.44 1263.5 660.8 175.0 0.7255 0.1455 0.9474 0.8180 –0.0430 0.05598 –0.1430 –87.32 1301.5 623.1 149.0 0.8192 0.0958 0.9469 0.8329 –0.0273 0.03588 –0.0860 –53.23 1350.9 578.7 116.0 0.9107 0.0473 0.9464 0.8483 –0.0111 0.01500 –0.0380 –18.61 1435.8 512.6 61.0 1.0000 0.0000 0.9461 0.8586 0.0000 0.00000 0.0000 0.00 1465.2 440.7 0.0
N,N-Dimethylformamide (A) + benzene (B) + THF (C)
0.0000 0.4800 0.8797 0.4022 –0.1227 0.23749 –0.2530 –645.90 1165.1 837.5 296 0.1023 0.4309 0.8868 0.4507 –0.1084 0.19612 –0.3150 –491.81 1210.0 770.1 268 0.2041 0.3820 0.8939 0.4957 –0.0973 0.16504 –0.3570 –382.37 1238.0 729.9 244 0.3054 0.3334 0.9009 0.5413 –0.0855 0.13641 –0.3840 –290.26 1263.2 695.7 226 0.4061 0.2851 0.9078 0.5843 –0.0761 0.11455 –0.3900 –225.66 1290.5 661.5 210 0.5064 0.2370 0.9145 0.6285 –0.0654 0.09315 –0.3790 –169.18 1322.2 625.4 190 0.6061 0.1891 0.9211 0.6744 –0.0528 0.07132 –0.3360 –117.21 1357.2 589.4 168 0.7053 0.1414 0.9276 0.7191 –0.0412 0.05294 –0.2860 –80.15 1392.0 556.4 140 0.8041 0.0941 0.9338 0.7681 –0.0251 0.03062 –0.2000 –37.14 1430.3 523.4 104 0.9023 0.0469 0.9400 0.8153 –0.0107 0.01235 –0.1090 –9.35 1484.8 482.5 58 1.0000 0.0000 0.9461 0.8586 0.0000 0.00000 0.0000 0.00 1465.2 440.7 0
N,N-Dimethylformamide (A) + benzene (B) + 1,2-DME (C)
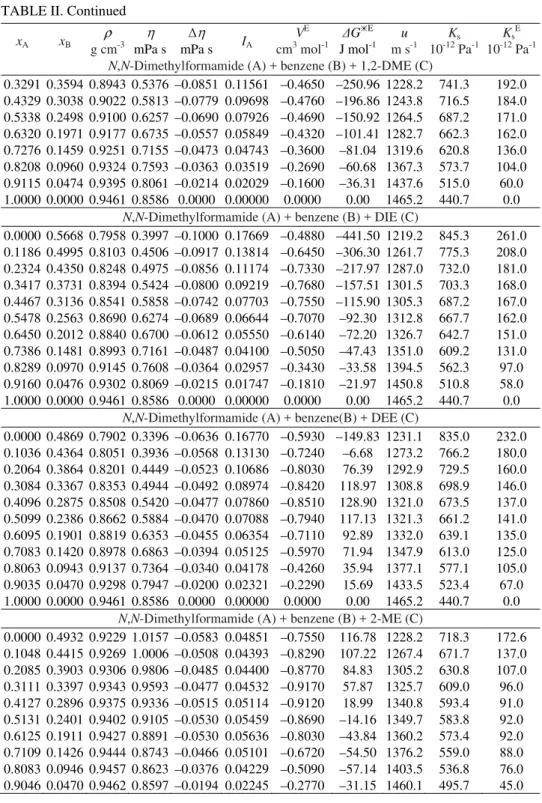
TABLE II. Continued
xA xB g cmρ -3 mPa s η mPa s Δη IA V E
cm3 mol-1 ΔG
E
J mol-1 m su -1 10-12K Pas -1 Ks E
10-12 Pa-1 N,N-Dimethylformamide (A) + benzene (B) + 1,2-DME (C)
0.3291 0.3594 0.8943 0.5376 –0.0851 0.11561 –0.4650 –250.96 1228.2 741.3 192.0 0.4329 0.3038 0.9022 0.5813 –0.0779 0.09698 –0.4760 –196.86 1243.8 716.5 184.0 0.5338 0.2498 0.9100 0.6257 –0.0690 0.07926 –0.4690 –150.92 1264.5 687.2 171.0 0.6320 0.1971 0.9177 0.6735 –0.0557 0.05849 –0.4320 –101.41 1282.7 662.3 162.0 0.7276 0.1459 0.9251 0.7155 –0.0473 0.04743 –0.3600 –81.04 1319.6 620.8 136.0 0.8208 0.0960 0.9324 0.7593 –0.0363 0.03519 –0.2690 –60.68 1367.3 573.7 104.0 0.9115 0.0474 0.9395 0.8061 –0.0214 0.02029 –0.1600 –36.31 1437.6 515.0 60.0 1.0000 0.0000 0.9461 0.8586 0.0000 0.00000 0.0000 0.00 1465.2 440.7 0.0
N,N-Dimethylformamide (A) + benzene (B) + DIE (C)
0.0000 0.5668 0.7958 0.3997 –0.1000 0.17669 –0.4880 –441.50 1219.2 845.3 261.0 0.1186 0.4995 0.8103 0.4506 –0.0917 0.13814 –0.6450 –306.30 1261.7 775.3 208.0 0.2324 0.4350 0.8248 0.4975 –0.0856 0.11174 –0.7330 –217.97 1287.0 732.0 181.0 0.3417 0.3731 0.8394 0.5424 –0.0800 0.09219 –0.7680 –157.51 1301.5 703.3 168.0 0.4467 0.3136 0.8541 0.5858 –0.0742 0.07703 –0.7550 –115.90 1305.3 687.2 167.0 0.5478 0.2563 0.8690 0.6274 –0.0689 0.06644 –0.7070 –92.30 1312.8 667.7 162.0 0.6450 0.2012 0.8840 0.6700 –0.0612 0.05550 –0.6140 –72.20 1326.7 642.7 151.0 0.7386 0.1481 0.8993 0.7161 –0.0487 0.04100 –0.5050 –47.43 1351.0 609.2 131.0 0.8289 0.0970 0.9145 0.7608 –0.0364 0.02957 –0.3430 –33.58 1394.5 562.3 97.0 0.9160 0.0476 0.9302 0.8069 –0.0215 0.01747 –0.1810 –21.97 1450.8 510.8 58.0 1.0000 0.0000 0.9461 0.8586 0.0000 0.00000 0.0000 0.00 1465.2 440.7 0.0
N,N-Dimethylformamide (A) + benzene(B) + DEE (C)
0.0000 0.4869 0.7902 0.3396 –0.0636 0.16770 –0.5930 –149.83 1231.1 835.0 232.0 0.1036 0.4364 0.8051 0.3936 –0.0568 0.13130 –0.7240 –6.68 1273.2 766.2 180.0 0.2064 0.3864 0.8201 0.4449 –0.0523 0.10686 –0.8030 76.39 1292.9 729.5 160.0 0.3084 0.3367 0.8353 0.4944 –0.0492 0.08974 –0.8420 118.97 1308.8 698.9 146.0 0.4096 0.2875 0.8508 0.5420 –0.0477 0.07860 –0.8510 128.90 1321.0 673.5 137.0 0.5099 0.2386 0.8662 0.5884 –0.0470 0.07088 –0.7940 117.13 1321.3 661.2 141.0 0.6095 0.1901 0.8819 0.6353 –0.0455 0.06354 –0.7110 92.89 1332.0 639.1 135.0 0.7083 0.1420 0.8978 0.6863 –0.0394 0.05125 –0.5970 71.94 1347.9 613.0 125.0 0.8063 0.0943 0.9137 0.7364 –0.0340 0.04178 –0.4260 35.94 1377.1 577.1 105.0 0.9035 0.0470 0.9298 0.7947 –0.0200 0.02321 –0.2290 15.69 1433.5 523.4 67.0 1.0000 0.0000 0.9461 0.8586 0.0000 0.00000 0.0000 0.00 1465.2 440.7 0.0
N,N-Dimethylformamide (A) + benzene (B) + 2-ME (C)
TABLE II. Continued
xA xB g cmρ -3 mPa s η mPa s Δη IA V E
cm3 mol-1 ΔG
E
J mol-1 m su -1 10-12K Pas -1 Ks E
10-12 Pa-1 N,N-Dimethylformamide (A) + benzene (B) + 2-ME (C)
1.0000 0.0000 0.9461 0.8586 0.0000 0.00000 0.0000 0.00 1465.2 440.7 0.0 N,N-Dimethylformamide (A) + benzene (B) + 2-EE (C)
0.0000 0.5354 0.9066 1.1640 –0.0022 0.03794 –0.8320 357.25 1280.9 672.3 123.1 0.1128 0.4750 0.9139 1.1302 –0.0013 0.03793 –1.0870 323.16 1315.6 632.2 95.2 0.2224 0.4163 0.9202 1.0944 –0.0033 0.03962 –1.2200 283.41 1342.6 602.9 77.8 0.3290 0.3592 0.9252 1.0574 –0.0076 0.04265 –1.2330 238.98 1362.6 582.1 68.6 0.4327 0.3037 0.9297 1.0205 –0.0126 0.04571 –1.1800 191.86 1371.6 571.8 69.5 0.5336 0.2497 0.9331 0.9855 –0.0165 0.04707 –1.0320 147.35 1383.5 559.9 68.6 0.6318 0.1971 0.9361 0.9526 –0.0192 0.04651 –0.8560 104.14 1394.6 549.2 68.6 0.7275 0.1459 0.9390 0.9222 –0.0202 0.04333 –0.6680 63.44 1415.4 531.6 61.3 0.8207 0.0960 0.9414 0.8968 –0.0170 0.03456 –0.4490 33.23 1441.3 511.4 51.2 0.9115 0.0474 0.9437 0.8744 –0.0114 0.02160 –0.2200 8.82 1483.6 481.4 31.1 1.0000 0.0000 0.9461 0.8586 0.0000 0.00000 0.0000 0.00 1465.2 440.7 0.0 In order to secure more comparable viscous antagonic results, the so called antagonic interaction index (IA), introduced by Howell,37 was taken into account:
A ( cal exp) / cal
I = η −η η (2)
The antagonic interaction index (IA) values at 298.15 K for the ternary mix-tures (A) + (B)+ 1,3-DO, 1,4-DO, THF, 1,2-DME, DIE, DEE, 2-ME and 2-EE (C) are plotted against xA in Fig. 3. It was found that each mixture had a
maxi-Fig. 3. Antagonic Index (IA) of: ■) DMF (A) + benzene (B) + 1,3-DO (C); ▲) DMF (A) + benzene (B) + 1,4-DO (C); ♦) DMF (A) + benzene (B) + THF (C); ●) DMF (A) + benzene (B) + 1,2-DME (C); □) DMF (A) + benzene (B) + DIE (C); ○) DMF (A) + benzene (B) + DEE (C); +) DMF (A) + benzene (B) + 2-ME (C); ∆) DMF (A) + benzene (B)+ 2-EE (C)
mum at xA = 0.0, which then decreased with increasing xA. A perusal of Table II shows that the experimentally determined viscosities, ηexp for all mixtures for various mole fractions at the experimental temperature are lower than those of their calculated values, ηcalcd, which demonstrates viscous antagonism in the eight mixtures studied herein. The explanation of this behavior is based on the known phenomenon of molecular dissociation, as a consequence of the weak-ening of the non-covalent bonding formed between the molecules, causing a de-crease in the size of the molecular package, which logically implies an inde-crease in IA.1,12 The maxima observed indicate strong specific interaction between the unlike molecules, which is predominated by non-covalent interaction. Thus, the molecular package increases gradually with the addition of DMF to the mixtures, which implies a decrease in IA.
The excess molar volumes, VE were calculated from the density data
ac-cording to the following equation:39
(
)
3 E
1 i i 1/ 1/ i
i
V x M ρ ρ
=
= − (3)
where Mi, and ρi are the molar mass and density of the pure components,
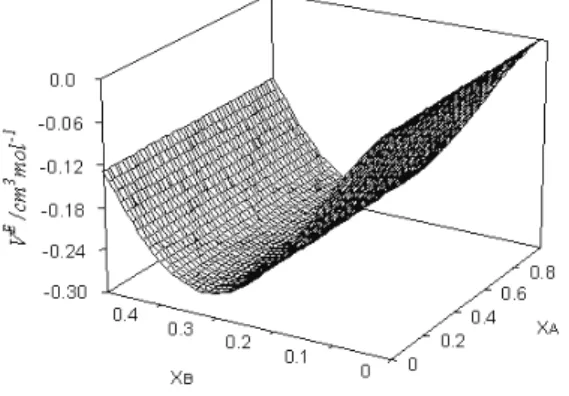
res-pectively, and ρ is the density of the mixture. For the ternary systems, in general, the VE values were found to be negative over the whole composition range under
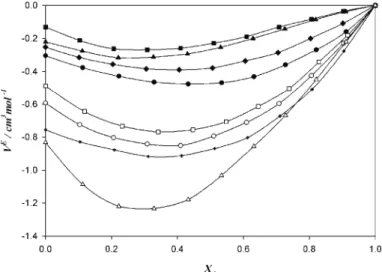
study at 298.15 K, which is depicted as a representative plot in Fig. 4 as a func-tion of the mole fracfunc-tion of both DMF (xA) and benzene (xB). The VE values for
the eight ternary mixtures under examination are presented in Fig. 5. The values at first decreases to minima and then increase with increasing xA. The eight ter-nary mixtures show minima at the same point, i.e., at xA = 0.3. The trend is:
(A)+(B)+1,3-DO > 1,4-DO > THF >1,2-DME > DIE > DEE > 2-ME > 2-EE
Fig. 4. 3D mesh plots of excess molar volumes (VE) of: DMF (A) + benzene (B) + 1,3-DO (C) mixtures with mole frac-tion of DMF (xA) and benzene (xB) at 298.15 K.
The negative values of VE indicate the presence of strong molecular
lengths and bond distances in the molecules themselves do not change. The optimum packing condition is directly related to differences in molecular sizes and intermolecular attractions, in particular when hydrogen bonding occurs be-tween unlike molecules creating association complexes, as well as being effected by the breaking of interactions between like molecules.32 Several effects contri-bute to the value of VE, such as: dipolar interaction, interstitial accommodation
and possible hydrogen bonded interactions between unlike molecules.40 The ac-tual volume change would, therefore, depend on the relative strength of these three effects. Similar results have been reported earlier.41,42
Fig. 5. Excess molar volumes (VE) of: ■) DMF (A) + benzene (B) + 1,3-DO (C); ▲) DMF (A) + benzene (B) + 1,4-DO (C); ♦) DMF (A) + benzene (B) + THF (C); ●) DMF (A) + benzene (B) + 1,2-DME (C); □) DMF (A) + benzene (B) + DIE (C); ○) DMF (A) + benzene
(B) + DEE (C); (+), DMF (A) + benzene (B) + 2-ME (C); ∆) DMF (A) + benzene (B) + 2-EE (C) mixtures with mole fraction of DMF (xA) at 298.15 K.
Based on the theory of absolute reaction rates,38 the excess Gibbs energy,
∆GE, of viscous flow for a ternary system was calculated from:
∆GE
(
)
3 i(
)
1
ln / ln i i/ i
i
RT ηM ρ RT x η M ρ =
= − (4)
where M and Mi are the molar mass of the mixture and of the pure components i.
According to the literature, positive ∆GE values indicate specific interactions,
while negative values indicate the dominance of dispersion forces.43,44 From the
∆GEvalues recorded in Table II, it can be seen that for all the ternary mixtures,
Table II contains the sound velocity (u), the isentropic compressibility (Ks) and excess isentropic compressibility (KsE) data for the observed mixtures, which
were calculated using the following equations: 45
(
2)
1 s u expK = ρ − (5)
3 E
s s s,
1 i i
i
x
K K K
=
= − (6)
where, Ks,igives the isentropic compressibility for the pure components of the
mixture.
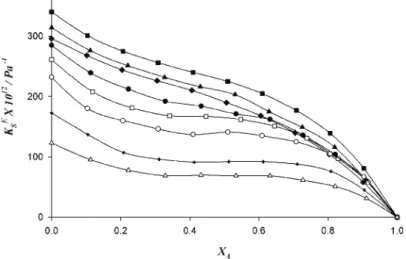
Figure 6 predicts the curves for the ternary mixtures of KsE. The values are positive in all the cases and decreases as the mole fraction of DMF increases. There is a parallel in the qualitative behavior of the KsE and VE curves. The KsE values follow the sequence:
(A)+(B)+1,3-DO > 1,4-DO > THF >1,2-DME > DIE > DEE > 2-ME > 2-EE
Fig. 6. Excess isentropic compressibility (KsE) of: ■) DMF (A) + benzene (B) + 1,3-DO (C); ▲) DMF (A) + benzene (B) + 1,4-DO (C); ♦) DMF (A) + benzene (B) + THF (C); ●) DMF (A) + benzene (B) + 1,2-DME (C); □) DMF (A) + benzene (B) + DIE (C); ○) DMF (A) + benzene (B) + DEE (C); (+), DMF (A) + benzene (B) + 2-ME (C); ∆) DMF (A) + benzene (B)
+ 2-EE (C) mixtures with mole fraction of DMF (XA) at 298.15 K.
benzene or ethers are broken in the mixing process; the breaking leads to positive
KsE values for the mixture containing cyclic ethers as compared to the open chain
ethers. Similar results were reported earlier by some authors.24,32 CONCLUSIONS
After a thorough study of the behavior of ethers in N,N-dimethylformamide
+ benzene mixtures, a clear idea about the type and amount of molecular inter-actions between them was obtained and an idea about antagonism was given. The similarity in the working formula of the antagonic interaction index and viscosity deviation would probably indicate that the two properties are similar but a close comparison between these two parameters gave a clear distinction.
Acknowledgments. The authors are thankful to the Departmental Special Assistance Scheme under the University Grants Commission, New Delhi (No. 540/6/DRS/2007, SAP-1) and Department of Chemistry, North Bengal University for the instrumental and financial as-sistance.
Њ , ,
N,N- , 298,15 K
RIJU CHANDA, ASHIS BANERJEE MAHENDRA NATH ROY
Department of Chemistry, North Bengal University,Darjeeling-734013, India
(ρ) (η) N,N-
+ + , 298,15 K.
(VE),
(Δη), (IA) (ΔGE).
-ђ, ,
(KsE).
.
( 6. 2009, 27. 2010)
REFERENCES 1. J. V. Herraez, R. Belda, J. Solution Chem.33 (2004) 117
2. R. Belda, J. V. Herraez, O. Diez, Phys. Chem. Liquids. 42 (2004) 467
3. S. L. Oswal, H. S. Desai, Fluid Phase Equilib. 161 (1999) 191
4. S. L. Oswal, H. S. Desai, Fluid Phase Equilib. 186 (2001) 81
5. P. Dimitrios, P. Constantinos, J. Chem. Eng. Data40 (1995) 202
6. G. Czechowski, B. Zywucki, J. Jadzyn, J. Chem. Eng. Data 33 (1998) 55
7. R. Belda, J. V. Herraez, O. Diez, Phys. Chem. Liquids43 (2005) 91
8. M. N. Roy, D. K. Hazra. North Bengal Univ. Rev. 8 (1997) 54
10. C. Lafuente, B. Ginar, A. Villares, I. Gascon, P. Cea, Int. J. Thermophys. 25 (2004) 1735
11. P. S. Nikam, L. N. Shirsat, M. Hasan, J. Ind. Chem. Soc. 77 (2000) 244
12. M. N. Roy, A. Choudhury, A. Sinha, J. Teach. Res. Chem.11 (2004) 12
13. D. K. Hazra, M. N. Roy, B. Das, Ind. J. Chem. Technol. 1 (1994) 93
14. M. N. Roy, A. Jha, R. Dey, J. Chem. Eng. Data46 (2001)1327
15. M. N. Roy, A. Sinha, B. Sinha, J. Sol. Chem. 34 (2005) 1319
16. M. N. Roy, S. R. Choudhury, A. Jha, J. Ind. Chem. Soc.79 (2002) 623
17. M. N. Roy, A. Jha, A. Choudhury, J. Chem. Eng. Data49 (2004) 291
18. M. N. Roy, B. B. Gurung, A. Choudhury, J. Ind. Chem. Soc.81 (2004)1
19. D. D. Perrin, W. L. F. Armarego. Purification of Laboratory Chemicals, 3rd ed., Pergamon, Oxford, 1988
20. A. Vogel, Practical Organic Chemistry, 4th ed., Longman, London, 1978
21. J. A. Riddick, W. B. Bunger, T. K. Sokano, Organic Solvents:Physical Properties and Methods of Purifications, Vol. 2, 4th ed., Wiley-Interscience, New York, 1986
22. S. J. Kharat, P. S. Nikam, J. Chem. Eng. Data 48 (2003) 1202
23. H. Casas, L. Segade, C. Franjo, E. Jiménez, J. Chem. Eng. Data43 (1998) 756
24. T. M. Aminabhavi, B. Gopalkrishna, J. Chem. Eng. Data40 (1995) 856
25. A. K. Covington, T. Dickinson, Physical Chemistry of Organic Solvent Systems, Plenum, New York, 1973
26. M. N. Roy, A. Sinha, B. Sinha, J. Solution Chem.34 (2005) 1319
27. I. Johnson, M. Kalidoss, R. Srinivasamoorthy,J. Chem. Eng. Data 47(2002)1388
28. TRC Tables, Selected Values of Properties of Chemical Compounds, Thermodynamic Research Center, A & M University, College Station, TX, 1974
29. T. M. Aminabhavi, V. B. Patil, J. Chem. Eng. Data43(1998) 497
30. D. R. Lide, CSIR Handbook of Chemistry and Physics, 7th ed., 1990–1991 31. M. N. Roy, B. Sinha, J. Mol. Liq. 133 (2007) 89
32. M. N. Roy, M. Das, Phys. Chem. Liq. 44 (2006) 663
33. I. Gascón, S. Martín, P. Cea, M. C. López, F. M. Royo, J. Sol. Chem.31 (2002) 905
34. D. K. Hazra, B. Das, J. Phys. Chem. 99 (1995) 269
35. J. Barthel, R. Neueder, H. Roch, J. Chem. Eng. Data 45 (2000) 1007
36. M. N. Roy, A. Jha, A. Choudhury, J. Chem. Eng. Data49 (2004) 291
37. N. K. Howell, in Proceedings of the 7th International Conference, Wales, 1993
38. S. Glasstone, K. J. Laidler, H. Eyring, The Theory of Rate Process, McGraw-Hill, New York, 1941, p. 514
39. B. Djordjević, I. Radović, M. Kijevčanin, A. Tasić, S. Šerbanović, J. Serb. Chem. Soc. 74
(2009) 477
40. P. S. Nikam, S. J. Kharat, J. Chem. Eng. Data50 (2005) 455
41. P. Brocos, E. Calvo, A. Pineiro, R. Bravo, A. Amigo, J. Chem. Eng. Data44 (1999) 1341
42. A. Amigo, R. Bravo, M. Pintos, J. Chem. Eng. Data 38 (1993) 141
43. T. M. Reed, T. E. Taylor, J. Phys. Chem. 63 (1959) 58
44. R. Meyer, M. Meyer, J. Metzer, A. Peneloux, Chem. Phys. 62 (1971) 406