Artigo
*e-mail: [email protected]
SYNTHESIS AND CHARACTERIZATION OF Fe(III)-PIPERAZINE-DERIVED COMPLEXES ENCAPSULATED IN ZEOLITE Y
Márcio E. Berezuk*
Universidade Tecnológica Federal do Paraná, Rua Marcílio Dias, 635, 86812-460 Apucarana - PR, Brasil Andrea Paesano Jr.
Departamento de Física, Universidade Estadual de Maringá, Av. Colombo, 5790, 87020-900 Maringá - PR, Brasil Nakédia M. F. Carvalho
Departament of Chemistry, Massachusetts Institute of Technology, 77 Massachusetts Avenue 02139, Cambridge, United States Adolfo Horn Jr.
Laboratório de Ciências Químicas, Universidade Estadual do Norte Fluminense, Av. Alberto Lamego, 2000, 28013-602 Campos dos Goytacazes - RJ, Brasil
Pedro A. Arroyo eLúcio Cardozo-Filho
Departamento de Engenharia Química, Universidade Estadual de Maringá, Av. Colombo, 5790, 87020-900 Maringá - PR, Brasil
Recebido em 6/4/11; aceito em 22/11/11; publicado na web em 31/1/12
Zeolite-encapsulated complexes have been widely applied in hydrocarbon oxidation catalysis. The “ship-in-a-bottle” encapsulation of iron(III) complexes containing piperazine and piperazine-derivative ligands in zeolite-Y is described. The lexible ligand methodology was employed and the eficiency and reproducibility of the procedure was investigated. The catalysts were characterized employing several techniques and the results indicate the presence of coordinated and uncoordinated iron(III) ions inside and outside the zeolitic cage.
Keywords: piperazine; ship-in-a-bottle encapsulation; zeolite Y.
INTRODUCTION
In nature hydrocarbon oxidation is selectively and eficiently promoted by metalloenzymes like cytochrome P-450 and methane monooxygenase (MMO).1,2 These systems possess iron in their active sites, which is responsible for activating the dioxygen and subsequently oxidizing the substrate. The industrial application of these enzymes is not straightforward due to their high isolation and puriication cost, as well as the operational problems typical of enzymatic catalysis, such as separation products, catalyst recovery, enzymatic stability in the reaction medium and, in this particular case, coenzyme recycling.3,4 To overcome these problems, the design and synthesis of catalysts that mimic the function of such biological systems have gained considerable attention in the past few years.5-8
Iron complexes based on the observation of such systems have been used as catalysts for the oxidation of a large variety of hydrocar-bons. MMO oxidizes not only the methane molecule but also many other hydrocarbons, which extends the scope of applications to the catalysis of several relevant chemical processes.9-13
Immobilization of complexes in solid supports has been shown to be a promising alternative means to provide heterogeneous ca-talysts for industry.9,14-17 In this regard, zeolites can provide a good support due to their particular characteristics, including mechanical resistance, porosity, appropriate shape, high adsorption power and selectivity, which favor an increase in the catalytic power of the supported complex.15,16,18
The encapsulation method named ship-in-a-bottle consists of the synthesis of the complex inside the zeolite cavity through the reaction of a lexible ligand with the metal-exchanged zeolite. The resulting complex is large enough to remain within the zeolite cavity, and thus the catalytic reaction is carried out inside the zeolite ‘supercage’.14,19
In this study, we synthesized and characterized six Fe(III) piperazine-derived complexes encapsulated in zeolite-Y by the ship-in-a-bottle method. The main physical-chemical features of the complexes and their differences were determined. The reproducibility of the encapsulation method was also veriied and the eficiency of the method compared with a simple mechanical mixture (FeY + ligands). EXPERIMENTAL
Materials
All reagents and solvents were acquired from Sigma-Aldrich, Acros, Vetec, Merck or Fluka and were used without previous tre-atment.
Ligand synthesis
The new ligands were synthesized through the Michael reaction of piperazine and methyl acrylate or acrylamide to form 1,4-bis--(methylpropanoate)piperazine (BMPZ); 1,4-bis(propanamide) piperazine (BPAPZ), respectively.20-22 The ligand lithium 1,4-bis--(propanoate)piperazine (LiBPPZ) was obtained through the alkaline hydrolysis of the ligand BMPZ with LiOH. Commercial piperazine (PZ) was also used. The ligands were characterized by infrared spectroscopy (FTIR), 1H and 13C NMR.
Synthesis of the ligand 1,4-bis-(methylpropanoate)piperazine (BMPZ)
concentration in a rotary evaporator.22 A solid was obtained in 96% yield (7.75 g).
1H NMR (in D
2O), d (ppm): 2.18-2.44 (m, 8H, HPz); 2.58 (t, 4H, -CH2CO2CH3); 2.95 (t, 4H, -Pz-CH2-); 3.39 (s, 6H, -CO2CH3).
13C NMR (in D2O), d (ppm): 31 (-Pz-CH2-); 49 (CPz); 52 (-CO2CH3); 53 (-CH2CO2CH3); 173 (-CO2CH3). IR (KBr, cm
-1): 3027, 3014, 2965, 2873, 2940, 2830, 1739, 1461, 1434, 1380, 1361, 1266, 1194, 1049. Synthesis of the ligand lithium 1,4-bis-(propanoate)piperazine (LiBPPZ)
A methanolic solution (50 mL) containing 12.1 mmol of BMPZ (3.12 g) and 36.3 mmol of LiOH (0.87 g) was stirred at room temperature for 13 days. The solvent was evaporated in a rotary evaporator and the solid residue was treated with methylene chloride. The insoluble residue of LiOH was iltered twice and methylene chloride was evaporated again in a rotary evaporator to obtain the desired product that was dried in an oven at mild tempera-ture (40 °C) for 2 h. The product was obtained as a white solid in 92% yield (3.67 g).
1H NMR (in D
2O), d (ppm): 2.38 (t, 4H, -CH2CO2-); 2.5 (s, 8H, HPz); 2.65 (t, 4H, -Pz-CH2-). IR (KBr, cm
-1): 2966, 2943, 2835, 1581, 1414, 1431, 1282, 1151, 1127.
Synthesis of the ligand 1,4-bis(propanamide)piperazine (BPAPZ) The reaction was carried out at room temperature with 30 mmol of piperazine (2.58 g) and 90 mmol of acrylamide (6.40 g) in 450 mL of methylene chloride. Anhydrous ferric chloride (3 mmol, 0.081 g) was used as catalyst. The reaction was stirred for 48 h and then quenched by iltration through a silica gel column followed by concentration in a rotary evaporator.22 Methanol was added to the solid to solubilize the residual reagents. The product was iltered and dried. Yield: 3.76 g, 42%.
1H NMR (in D
2O), d (ppm): 2.5 (t, 4H, -CH2CONH2); 2.6 (s, 8H, HPz); 2.7 (t, 4H, -Pz-CH2-).
13C NMR (in D
2O), d (ppm): 32 (-Pz-CH2-); 52 ( CPz); 54 (-CH2CONH2); 177 (-CO2NH2). IR (KBr, cm
-1): 3383, 3207, 3089, 2941, 2825, 1686, 1644, 1617, 1462, 1425, 1162.
Synthesis of the zeolite-encapsulated complex [FeL]-Y
The encapsulation of the complexes was carried out follow-ing published procedures.19 The irst step was the synthesis of the FeY through the ion exchange of the zeolite Y. Initially, 7.0 g of FeCl3·6H2O were added to a suspension of 25.0 g of NaY in 200 mL of deionized water. The suspension was stirred for 48 h and then
iltered. The solid was collected, washed in deionized water and dried at 573 K for 2 h.
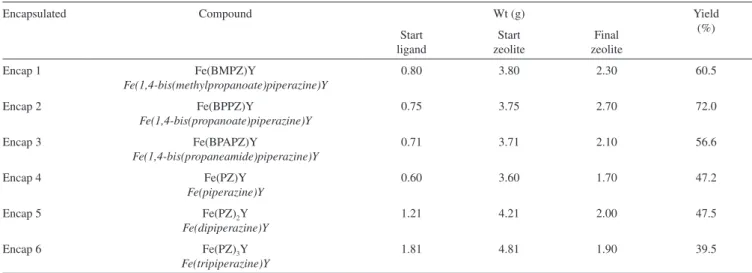
The second step was the encapsulation of the complex in the zeolite Y supercage by the ship-in-a-bottle method. The respective ligands BMPZ, LiBPPZ, BPAPZ and PZ (3.1x10⁻³ moles for Encap1, Encap 2, Encap 3 and Encap 4; 6.2 x 10⁻³ moles of PZ for Encap 5 and 9.3 x 10⁻³ moles of PZ for Encap 6) were added to a suspension of 3 g of FeY (wet weight) in deionized water. The suspension was stirred for 24 h and then iltered. The solid was collected and washed with deionized water and then washed with water in a Soxhlet apparatus for 2 days. The product was dried at 323 K for 3 h. Table 1 shows the quantity and yield (dry weight) obtained for all the encapsulated complexes synthesized.
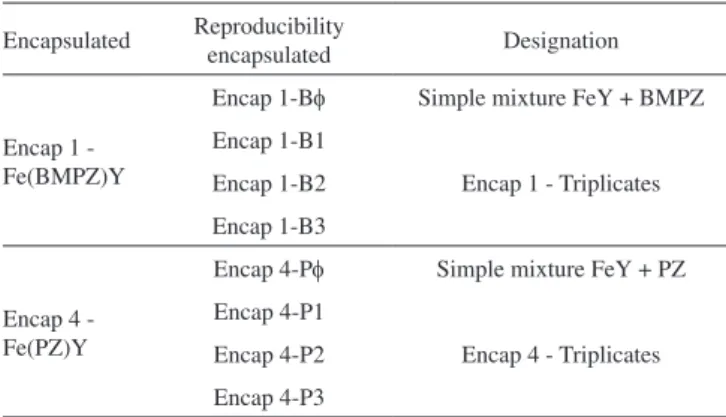
Encap 1 [Fe(BMPZ)Y] and Encap 4 [Fe(PZ)Y] complexes were chosen to verify the reproducibility of the encapsulation method and thus verify possible differences in the inal catalyst properties. The ship-in-a-bottle method used to form the encapsulated complexes 1 and 4 was compared with a mechanical mixture of FeY zeolite and the ligands BMPZ and PZ. These mechanical mixtures (FeY + Ligands) were carried out in a small ceramic pan and the mass mixture propor-tions were: 3.0 g of zeolite FeY, 0.8 g of the BMPZ ligand or 0.6 g of the PZ ligand. The samples were analyzed by several techniques. Table 2 shows the nomenclature used for the encapsulated complexes in the reproducibility tests.
Instrumentation
Infrared spectra were collected on an FTIR Nicolet Magna-IR 760 spectrophotometer, with the sample dispersed in CsI or KBr disks or as a ilm on a NaCl window. 1H and 13C NMR spectra were obtained with a Bruker DRX-200 spectrometer in D2O and the chemical shifts referenced to TMS peaks. Powder X-ray diffraction (XRD) patterns were recorded on a Rigaku-Minilex diffractometer using graphite single crystal iltered Cu Kα1 radiation and θ-2θ geometry. The metal content was determined using a Rigaku RiX 3100 X-ray luorescence spectrometer, with an Rh tube and potency of 4 kW. The thermogra-vimetry/differential thermal analyses (TGA/DTA) were performed using a Rigaku TAS 100 thermal analysis system with thermogravi-metric accessory TG-8110, under nitrogen and oxygen atmospheres (53 and 8 mL min-1, respectively) with a heating rate of 10 K min-1. Nitrogen adsorption/ desorption isotherms and supericial area were obtained with a Quantachrome Autosorb Automated Gas Sorption. Diffuse relectance spectra in the UV visible region (DRS-UV) were recorded on a UV-Vis NIR Cary 5G spectrometer. Mössbauer Table 1. Quantities obtained for the encapsulated complexes
Encapsulated Compound Wt (g) Yield
(%) Start
ligand
Start zeolite
Final zeolite
Encap 1 Fe(BMPZ)Y
Fe(1,4-bis(methylpropanoate)piperazine)Y
0.80 3.80 2.30 60.5
Encap 2 Fe(BPPZ)Y
Fe(1,4-bis(propanoate)piperazine)Y
0.75 3.75 2.70 72.0
Encap 3 Fe(BPAPZ)Y
Fe(1,4-bis(propaneamide)piperazine)Y
0.71 3.71 2.10 56.6
Encap 4 Fe(PZ)Y
Fe(piperazine)Y
0.60 3.60 1.70 47.2
Encap 5 Fe(PZ)2Y
Fe(dipiperazine)Y
1.21 4.21 2.00 47.5
Encap 6 Fe(PZ)3Y
Fe(tripiperazine)Y
spectroscopy was performed with a Halder Elektronik GmbH - MA 351 tranducer, using a radioactive source of 57Co/Rh with 14.4 keV.
Reproducibility tests for the encapsulated complexes 1 and 4 were carried out in the X-ray luorescence spectrometer analysis, X-ray di-ffraction (XRD), determination of the nitrogen adsorption/desorption isotherms and supericial area, Mössbauer spectroscopy and diffuse relectance spectroscopy in the UV visible region (DRS-UV). RESULTS AND DISCUSSION
From the FTIR spectra of the encapsulated complexes it was possible to assign the characteristic bands of the zeolite framework (νSi-O) as well as those of the ligands BMPZ, BPPZ, BPAPZ, PZ (nC-H CYCLO, nC-H, nC-N) (Table 3 and Figure 1). The results may indicate that the complexes were formed inside the zeolite pores.15,23 The ligand bands at around 3023 and 1461 cm-1 can be assigned to C-H axial and angular distortion for the carbonic cycle. The bands at around 2820 and 2777 cm-1 can be assigned to C-H axial distortions for the CH
2 groups, and that at around 1441 cm-1 can be assigned to C-N axial distortion. The ligand bands are more intense in compounds 1, 3 and 4 than in compounds 2, 5 and 6, indicating that a greater amount of the complexes was formed in the former case (Figure 1).15
The metal content of the zeolite-encapsulated complexes was determined by X-ray luorescence analysis, and the results are shown in Table 4.
The encapsulated complex 4 (Fe(PZ)Y) showed the greatest amount of complex formation in the zeolite pores (7.09% wt), while the encapsulated complex 6 (Fe(PZ)3Y) showed the lowest (less than 1% wt). The other encapsulated complexes had intermediate content values: 3.70, 3.36, 2.50 and 2.45% wt, for complexes 3, 2, 5 and 1, respectively.22
The reproducibility of the encapsulation methodology (ship-in-a-bottle) was evaluated for the complexes Encap 1 (B1 to B3) and Encap 4 (P1 to P3) and compared with the simple mixture of ligand-zeolite
(Bϕ, Pϕ) (Table 4). It was possible to observe that the ship–in-a-bottle methodology showed high reproducibility. Conversely, the induction of mechanical contact between the FeY zeolite and the pure ligands was not suficient to form the encapsulated complexes.
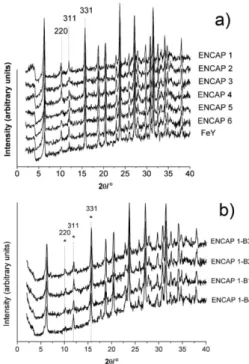
Powder X-ray diffraction (XRD) patterns of the zeolite-encapsulat-ed complexes 1-6 are shown in Figure 2a, and they did not reveal any signiicant difference in comparison with those of NaY and FeY. Dif-fractograms show that the encapsulated zeolite has the FAU topological structure with high crystallinity. This indicates that the ship-in-a-bottle synthetic procedure does not change signiicantly the zeolite structure. Nevertheless, slight modiications occur, as conirmed by the alteration of the relative intensity of the peaks for 2 2 0 and 3 1 1 relections (2 of around 10 and 12°, respectively).24,25 These modiications conirm the formation of a transition metal complex inside the zeolite pores. In the NaY zeolite diffractograms, the relative intensity of the above-mentioned peaks is I220 > I311 and after the coordination of the metal Table 2. Nomenclature for the encapsulated complexes applied in the
ship--in-a-bottle reproducibility tests Encapsulated Reproducibility
encapsulated Designation
Encap 1 - Fe(BMPZ)Y
Encap 1-Bf Simple mixture FeY + BMPZ Encap 1-B1
Encap 1 - Triplicates Encap 1-B2
Encap 1-B3
Encap 4 - Fe(PZ)Y
Encap 4-Pf Simple mixture FeY + PZ Encap 4-P1
Encap 4 - Triplicates Encap 4-P2
Encap 4-P3
Table 3. Wavelengths of the main bands on FTIR spectra for the encapsulated complexes
Complexes nC-H CYCLO (cm
-1) n
C-H (cm
-1) n
C-N (cm
-1) ν
Si-O (cm
-1)
1 Fe(BMPZ)Y 3023, 1461 2820, 2777 1441 1027
2 Fe(BPPZ)Y 1464 - 1401 1024
3 Fe(BPAPZ)Y 3023, 1461 2820, 2776 1441 1020 4 Fe(PZ)Y 3023, 1461 - 1441 1028
5 Fe(PZ)2Y 1467 - 1403 1023
6 Fe(PZ)3Y 1464 - 1402 1025
Figure 1. FTIR spectra of the zeolite-encapsulated complexes and FeY
Table 4. Results for X-ray luorescence analysis of the zeolite-encapsulated complexes
Encapsulated complexes
Weight (%) Formed complexes (%)* Na2O Fe2O3 Al2O3 SiO2 Cl
NaY 15.04 0.06 20.57 64.32 - -FeY 4.73 12.43 18.78 63.43 0.64 -Encap 1 4.18 12.73 18.60 64.39 0.11 2.45 Encap 2 4.22 12.86 18.59 64.23 0.10 3.36 Encap 3 4.09 12.89 18.77 64.15 0.10 3.70 Encap 4 3.96 13.31 19.48 63.10 0.15 7.09 Encap 5 4.43 12.74 18.96 63.75 0.13 2.50 Encap 6 4.57 12.54 18.84 63.88 0.16 0.90 Encap 1-Bf 3.87 12.34 20.21 62.93 0.65 0.32 Encap 1-B1 3.22 12.6 20.98 63.03 0.17 2.38 Encap 1-B2 3.15 12.65 21.28 62.75 0.17 2.77 Encap 1-B3 3.11 12.64 20.91 63.13 0.21 2.69 Encap 4-Pf 4.07 12.25 20.31 62.94 0.43 -Encap 4-P1 3.54 13.22 20.14 62.91 0.19 6.96 Encap 4-P2 3.54 13.15 20.27 62.87 0.17 6.46 Encap 4-P3 3.56 13.17 20.38 62.71 0.18 6.61 * determined with 100 x (Fe2O3 of encapsulated – Fe2O3 from FeY)/Fe2O3
ion to the ligands, this relation was changed to I220 < I311. This behavior was observed for all of the complexes, except for the encapsulated 2 and 3. Thus, the analysis of the diffractograms of the encapsulated complexes 1, 4, 5 and 6 indicates the formation of a transition metal complex in the supercage of the zeolite Y.24 On the other hand the X-ray analysis indicated that compounds 2 and 3 may be anchored on the zeolite surface. In addition, the infrared spectra show clearly the shift of the bands of the ligands, indicating the formation of the complexes, at least at the zeolite external surface.
Figure 2b shows the XRD diffractograms for the triplicate samples of the encapsulated complexes Encap 1 (B1-B2-B3) and the com-parison with the mechanical mixture of FeY and the ligand BMPZ Encap 1 (Bϕ). For the triplicate samples, the diffractograms were very similar to the original complexe 1, which conirms the reprodu-cibility of the adopted synthetic procedure as well as the formation of the complexes inside the zeolite caves.24,25 The diffractograms of the mechanical mixtures of FeY and the ligand BMPZ (Encap 1-Bf) show small differences in the amplitudes of the 2 2 0 and 3 1 1 delections, however, these diffractograms have more similarity with the FeY zeolite than with the encapsulated complexes, showing that the mechanical mixture of the ligand and FeY do not change the zeolite structure or indicate the formation of encapsulated complexe.26 TGA and DTA thermograms analysis were made for NaY, FeY and the encapsulated complexes 1-6 (Figure 1S, supplementary ma-terial). Observing the NaY and FeY thermograms, the irst weight loss region corresponds to the physically adsorbed water molecules in the supericial zeolite pores.27,28 The water weight loss appears at temperatures between 300 K and 373 K.29 Figure 3 shows TGA and DTA thermograms for encapsulated complex 1.
The thermogravimetric analysis of the encapsulated complexes 1, 2, 3 indicated similar behaviors. Water weight loss was observed at temperatures up to 373 K and degradation of the ligands was ob-served in the range of 573-873 K, with a degradation peak at around 673 K.30 Similar behavior has been reported in the literature.25,31 For example, pyridinic iron (II) complexes encapsulated in zeolite Y
showed intrazeolitic desorption of water molecules at 423 K with gradual complex decomposition over a wide range of temperatures (573-973 K).
The complexes 4 and 5 presented a similar behavior but the degradation peaks were observed at a slightly higher temperature, between 673 and 773 K.31 The encapsulated 6 curve was very similar to the zeolite FeY curve, in agreement with the X-ray luorescence analysis (Table 4), which showed a low degree of complex formation inside the zeolite cages.
Figure 4 show the adsorption/desorption N2 isotherms (77 K) for the zeolites and encapsulated complexes. The encapsulated complexes 1 and 4, with the respective mechanical mixtures are presented in Figure 2S, supplementary material. All of the compounds showed a similar behavior. The curve of a typical microporous material is characterized by a slightly sloped or plateau form, and also by a low degree of hysteresis.32,33 This is in agreement with the XRD analysis, which indicated no signiicant changes in the crystallinity patterns of the zeolite structures.34,35
The data shown in Table 5 conirm a considerable decrease in the surface area and pore volume of the FeY zeolite in relation to NaY, and consequently of the encapsulated complexes 1, 4, 5, 6 in relation to the FeY zeolite, indicating the exchange of the sodium ions for iron ions and the formation of the complex inside the zeolite cages, respectively.30,34-37 Encapsulated complexes 2 and 3 presen-ted a different behavior. The pore volume value did not decrease, suggesting the formation of the complex outside the zeolite pores. This result is in agreement with the XRD analysis.
Similar behavior was observed for the encapsulated complexes (B1-B2-B3; P1-P2-P3) and the respective mixtures of FeY and the ligands (Bf-Pf) (Table 5). The ligands, mechanically mixed with FeY zeolite, decreased the zeolite supericial area in relation to the FeY. This behavior indicates that the ligands are present on the
exter-Figure 2. XRD patterns: a) for the zeolite-encapsulated complexes 1-6, FeY
and NaY; b) for the encapsulated complexes 1 with the respective mechanical mixtures
Figure 3. TGA and DTA thermograms for the encapsulated complex 1
Figure 4. Adsorption/desorption N2 isotherms at 77 K for the encapsulated
Table 5. The analysis of surface area and pore volume for the encapsulated complexes
Zeolites Supericial area (m2/g) Micropore volume (cm3/g)
NaY 657.1 0.334
FeY 385.2 0.178
Encap 1 257.9 0.130
Encap 2 251.5 0.168
Encap 3 311.6 0.183
Encap 4 234.2 0.114
Encap 5 237.2 0.116
Encap 6 232.0 0.124
Encap 1 - Bf 262.1 0.124
Encap 1 - B1 259.8 0.152
Encap 1 - B2 249.2 0.146
Encap 1 - B3 250.9 0.147
Encap 4 - Pf 264.3 0.134
Encap 4 - P1 239.9 0.135
Encap 4 - P2 245.6 0.146
Encap 4 - P3 237.7 0.134
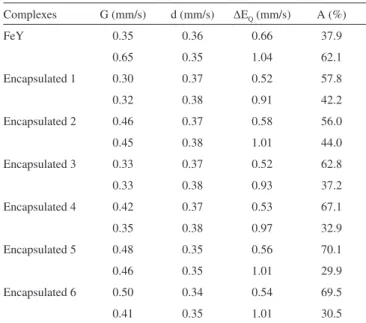
Table 6. Mössbauer data for encapsulated complexes and FeY Complexes G (mm/s) d (mm/s) ∆EQ (mm/s) A (%)
FeY 0.35 0.36 0.66 37.9
0.65 0.35 1.04 62.1
Encapsulated 1 0.30 0.37 0.52 57.8
0.32 0.38 0.91 42.2
Encapsulated 2 0.46 0.37 0.58 56.0
0.45 0.38 1.01 44.0
Encapsulated 3 0.33 0.37 0.52 62.8
0.33 0.38 0.93 37.2
Encapsulated 4 0.42 0.37 0.53 67.1
0.35 0.38 0.97 32.9
Encapsulated 5 0.48 0.35 0.56 70.1
0.46 0.35 1.01 29.9
Encapsulated 6 0.50 0.34 0.54 69.5
0.41 0.35 1.01 30.5
Figure 5. DRS-UV spectra: a) for the encapsulated complex 1; b) for the
ligand-zeolite FeY mixtures
nal zeolite surface. This feature could also be observed in the XRD analysis, in which the diffractograms of the ligand-zeolite mixtures and of the FeY zeolite are very similar (Figure 2a and 2b). On the other hand, encapsulated complexes presented a more pronounced decrease in the supericial area compared with the ligand-zeolite mixtures, indicating that complexation occurred inside the zeolite caves (as conirmed by the XRD analysis, Figure 2a). The encap-sulation procedure reproducibility could be conirmed due to the small differences observed in the BET analysis; indicating that the ship-in-a-bottle encapsulating method was eficient.31
All encapsulated complexes and the zeolites NaY and FeY were analyzed by DRS-UV aiming to investigate the chemical nature of the complexes formed. The results for the encapsulated complex 1 and the ligand-zeolite FeY (Encap 1-Bf e Encap 4-Pf) are shown in Figure 5a and 5b, and all spectra’s are presented in Figure 3S, supplementary material. For FeY, there are no bands under 300 nm, indicating the lack of Fe(III) atoms with tetrahedral coordina-tion.38,39 However, a band of high intensity close to 360 nm was observed for all encapsulated complexes, including FeY. This band is characteristic of Fe(III)atoms with octahedral coordination in the presence of small oligomeric clusters of FexOy.
40 At approximately 470 nm there is a shoulder, indicating the presence of octahedral Fe(III), with larger clusters of Fe2O3.
38,40
The spectra of the FeY zeolite and ligand-zeolite mixtures (Fi-gure 3S, supplementary material and Fi(Fi-gure 5b) are similar, showing the presence of octahedral Fe(III) ions, at 360 nm. These results show that the mechanical mixtures did not change the environment around the Fe(III) ion in the FeY zeolite.
It was not possible to identify the bands corresponding to d-d transitions, which are extremely small and dificult to identify. There were matches between 30000-17000 cm-1 and at around 600 nm.39 For the encapsulated complexes, as observed previously by Kumar and co-workers, the band between 300 and 400 nm as well as that near 500 nm can be attributed to oxo-Fe(III) ligand-metal charge transfer (LMCT), indicating the presence of small and larger FexOy clusters, respectively.
38
Finally, there are no signiicant differences between the spectra of the encapsulated complexes, suggesting that their electronic
structures are very similar. Encapsulated 5 and 6 presented bands of lower intensity when compared with the other complexes (in supplementary material).
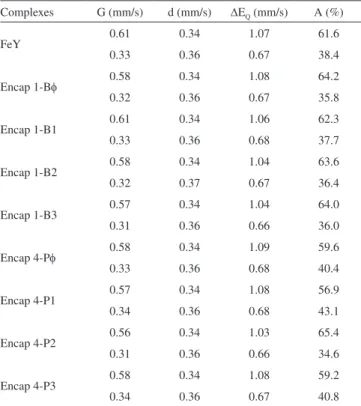
Tables 6 and 7 present the main results for the Mössbauer analy-sis for the encapsulated complexes 1-6, for the reproducibility test samples and also for the ligand-zeolite mixtures.
presence of two types of iron species. The isomer shifts (d) of the two species are very similar, conirming the presence of high spin Fe(III) species. The main differences are related to the quadrupole splitting (∆Eq) and line width (G). These data indicate that the iron center with d = 0.36 mm s-1 shows higher symmetry when compared to the iron nucleus with d = 0.35 mm s-1.
The Mössbauer data for the encapsulated complexes (Table 7) revealed the presence of high spin Fe(III) ions with octahedral geometry (d = 0.34-0.38 mm s-1), which is in agreement with the DRS-UV observations.41,42
Comparing the values of the line width (G) and quadrupolar splitting (∆EQ), there are signiicant differences between the values observed for the FeY and the complexes. The changes in these parameters indicate that the coordination environment around the Fe(III) center was modiied after the insertion of the ligand. However, it is still possible to observe the presence of two dif-ferent neighborhoods around the iron atoms in the encapsulated complexes.43 Considering these indings together with the results obtained from the DRS-UV analysis, it appears that these differ-ences might be caused by the presence of small oligomeric clusters of Fe2O3, besides the large clusters, formed during the ion exchange stage of zeolite NaY to FeY.
The presence of two doublets supports the hypothesis that two different Fe(III) species are present in the encapsulated complexes. One species arising from the ion exchange step, and the other from Fe(III) ions complexed with their respective ligand.44,45 Examples of the Mössbauer spectra (Figure 4S, supplementary material) are shown in the supplementary material available online.
The samples of the ligand-zeolite mechanical mixtures (Bf-Pf) and the encapsulated complexes for the reproducibility test (B1 to B3, P1 to P3) presented the same characteristics observed for the encapsulated 1-6 (Table 7). The ligand-zeolite samples showed small differences in the line width when compared to the other samples, however, this difference is not signiicant enough to characterize the formation of a new species.
CONCLUSIONS
The zeolite encapsulated Fe(III)-piperazine-derived complexes were synthesized employing the ship-in-a-bottle methodology and were characterized by different physical chemical techniques to verify the structural and chemical characteristics. The reproducibility of the encapsulation method was veriied for the complexes 1 and 4, and the results were compared with the samples obtained from the simple mechanical mixture of the ligands and the FeY zeolite.
The complexation of the ligands to the iron atoms inside the zeolitic cavities was conirmed by the results for all of the analysis techniques employed, which strongly indicates the eficiency of this methodology. The encapsulated complexes Fe(1,4-bis(propanoate) piperazine)Y (2) and Fe(1,4-bis(propaneamide)piperazine)Y (3) showed different behavior when compared with the species (1) and (4), since the data indicated that the complexes were formed outside the main zeolite cavity or outside the zeolite Y pores, ne-vertheless maintaining its crystalline structure. From the Mössbauer spectroscopy it was possible to verify the presence of Fe(III) atoms with octahedral coordination geometry and the presence of two doublets in the Mössbauer spectra indicates two neighborhoods around the iron nucleus, showing the complex formation inside the zeolite Y structure.
The reproducibility tests veriied the eficiency of the ship-in-a--bottle encapsulation method, as was observed by the characterization results. It was also veriied that the mechanical mixture of the ligands and zeolite FeY was not able to provide encapsulated complexes. Al-though the ligands were in contact with the metal during the mixture, there was no complexation of the ligands to the iron atoms. With the use of certain analytical techniques this behavior is more evident (XRD and N2 adsorption/desorption isotherm and BET), verifying good results for the reproducibility tests for the method.
ACKNOWLEDGEMENTS
We are grateful to CNPq (INCT-Catálise), CAPES, PROCAD, FAPERJ (PRONEX) and FUJB for the inance support. DEQ-UEM, UTFPR, IQ-UFRJ, UENF and NUCAT/COPPE for the instrumental analysis. Special thanks in memoriam to Prof. Dsc. Octávio Augusto Ceva Antunes for orientation regarding this investigation, and for his friendship and dedication.
REFERENCES
1. Schlichting, I.; Berendzen, J.; Chu, K.; Stock, A. M.; Maves, S. A.; Benson, D. E.; Sweet, R. M.; Ringe, D.; Petsko, G. A.; Sligar, S. G.;
Science2000, 287, 1615.
2. Feig, A. L.; Lippard, S. J.; Chem. Rev.1994, 94, 759. 3. Dupont, J.; Quim. Nova2000, 23, 825.
4. Figueiredo, J. L.; Ribeiro, F. R.; Catálise heterogénea, Fundação Calouste Gulbenkian: Lisboa, 1989.
5. Norman, R. E.; Yan, S.; Que Jr., L.; Backes, G.; Ling, J.; Sanders-Loehr, J.; Zhang, J. H.; O’Connor, C. J.; J. Am. Chem. Soc.1990, 112, 1554. 6. Barton, D. H. R.; Beck, A. H.; Taylor, D. K.; Tetrahedron1995, 51,
5245.
7. Kojima, T.; Leising, R. A.; Yan, S.; Que Jr., L.; J. Am. Chem. Soc.1993,
115, 11328.
8. Silva, G. C.; Parrilha, G. L.; Carvalho, N. M. F.; Drago, V.; Fernandes, C.; Horn Jr., A.; Antunes, O. A. C.; Catal. Today2008, 133-135, 648. 9. Olsen, M. H. N.; Salomão, G. C.; Drago, V.; Fernandes, C.; Horn Jr., A.;
Cardozo Filho, L.; Antunes, O. A. C.; J. Supercrit. Fluids2005, 34, 119. 10. Carvalho, N. M. F.; Horn Jr., A.; Antunes, O. A. C.; Appl. Catal., A2006,
305, 140. Table 7. Key results of Mössbauer spectroscopy for encapsulated complexes
in the reproducibility test, ligand-zeolite mixture and zeolite FeY Complexes G (mm/s) d (mm/s) ∆EQ (mm/s) A (%)
FeY 0.61 0.34 1.07 61.6
0.33 0.36 0.67 38.4
Encap 1-Bf 0.58 0.34 1.08 64.2
0.32 0.36 0.67 35.8
Encap 1-B1 0.61 0.34 1.06 62.3
0.33 0.36 0.68 37.7
Encap 1-B2 0.58 0.34 1.04 63.6
0.32 0.37 0.67 36.4
Encap 1-B3 0.57 0.34 1.04 64.0
0.31 0.36 0.66 36.0
Encap 4-Pf 0.58 0.34 1.09 59.6
0.33 0.36 0.68 40.4
Encap 4-P1 0.57 0.34 1.08 56.9
0.34 0.36 0.68 43.1
Encap 4-P2 0.56 0.34 1.03 65.4
0.31 0.36 0.66 34.6
Encap 4-P3 0.58 0.34 1.08 59.2
11. Esmelindro, M. C.; Oestreicher, E. G.; Márquez-Alvarez, H.; Dariva, C.; Egues, S. M. S.; Fernandes, C.; Bortoluzzi, A. J.; Drago, V.; Antunes, O. A. C.; J. Inorg. Biochem.2005, 99, 2054.
12. Leising, R. A.; Norman, R. E.; Que, Jr., L.; Inorg. Chem.1990, 29, 2553. 13. MacFaul, P. A.; Arends, I. W. C. E.; Ingold, K. U.; Wayner, D. D. M.; J.
Chem. Soc., Perkin Trans.1997, 2, 135.
14. Jacob, C. R.; Varkey, S. P.; Ratnasamy, P.; Appl. Catal., A1998, 168, 353.
15. Varkey, S. P.; Ratnasamy, C.; Ratnasamy, P.; J. Mol. Catal. A: Chem.
1998, 135, 295.
16. Carvalho, W. A.; Wallau, M.; Schuchardt, U.; J. Mol. Catal. A: Chem.
1999, 144, 91.
17. Nakagaki, S.; Xavier, C. R.; Wosniak, A. J.; Mangrich, A. S.; Wypych, F.; Cantão, M. P.; Denicoló, I.; Kubota, L. T.; Colloids Surf., A2000,
168, 261.
18. Luna, F. J.; Schuchardt, U.; Quim. Nova2001, 24, 885. 19. Hu, X.; Meyer, K.; Inorg. Chim. Acta2002, 337, 53.
20. Cabral, J.; Laszlo, P.; Mahé, L.; Montauier, M. T.; Randriamahefa, S. L.; Tetrahedron Lett.1989, 30, 3969.
21. Shaik, N.; Deshpande, V. H.; Bedekar, A. V.; Tetrahedron2001, 57, 9045.
22. Berezuk, M. E.; Rossi, C. C. R. S.; Carvalho, N. M. F.; Arroyo, P. A.; Dariva, C.; Horn Jr., A.; Cardozo-Filho, L.; Int. J. Chem. React. Eng.
2011, 9, 48.
23. Nakamoto, K.; Infrared and Raman Spectra of Inorganic and Coordina-tion Compounds, Part B, 5th ed., John Wiley and Sons: New York, 1997.
24. Li, R.; Fan, B.; Fan, W.; J. Mol. Catal. A: Chem.2003, 201, 137. 25. Quayle, W. H.; Lunsford, J. H.; Inorg. Chem.1982, 21, 97.
26. Li, G.; Chen, L.; Bao, J.; Li, T.; Mei, F.; Appl. Catal., A2008, 346, 134. 27. Barros, V. P.; Faria, A. L.; McLeod, T. C. O.; Moraes, L. A. B.; Assis,
M. D.; Int. Biodet. Biodegrad.2008, 61, 337.
28. Aravindhan, R.; Fathima, N. N.; Rao, J. R.; Nair, B. U.; J. Hazard. Mater. B2006, 138, 152.
29. Salavati-Niasari, M.; Inorg. Chem. Commun.2009, 12, 359.
30. Fathima, N. N.; Aravindhan, R.; Rao, J. R; Nair, B. U.; Chemosphere
2008, 70, 1146.
31. Ahmed, A. H.; Mostafa, A. G.; Mater. Sci. Eng., C 2009, 29, 877. 32. Xu, X.; Wang, J.; Long, Y.; Microporous Mesoporous Mater.2005, 83,
60.
33. Brunauer, S.; Emmett, P. H.; Teller, E.; J. Am. Chem. Soc.1938, 60, 309. 34. Gregg, S. J.; Sing, K. S. W.; Adsorption, surface area and porosity, 2nd
ed., Academic Press: New York, 1982.
35. Schuster, C.; Hölderich, W. F.; Catal. Today2000, 60, 193.
36. Correa, R. J.; Salomão, G. C.; Olsen, M. H. N.; Cardozo-Filho, L.; Drago, V.; Fernandes, C.; Antunes, O. A. C.; Appl. Catal., A2008, 336, 35.
37. Salavati-Niasari, M.; J. Mol. Catal. A: Chem.2007, 278, 22.
38. Kumar, M. S.; Schwidder, M.; Grunert W.; Bruckner, A.; J. Catal.2004,
227, 384.
39. Bordiga, S.; Buzzoni, R.; Geobaldo, F.; Lamberti, C.; Giamello, E.; Zecchina, A.; Tozzola, G.; Vlaic, G.; J. Catal.1996, 158, 486. 40. Wang, X.; Long, J.; Yan, G.; Zhang, G.; Fu, X.; Basset, J. M.; Lefebvre,
F.; Microporous Mesoporous Mater.2008, 108, 258.
41. Fernandez-Armas, S.; Mesa, J. L.; Pizarro, J. L.; Arriortua, M. I.; Rojo, T.; Mater. Res. Bull.2007, 42, 544.
42. Weiss, R.; Fisher, J.; Bulach, V.; Sachunemann, V.; Gerdan, M.; Traut-wein, A. X.; Shelnutt, J. A.; Gros, C. P.; Tabard, A.; Guilard, R.; Inorg. Chim. Acta2002, 337, 223.
43. Zima, V.; Lii, K. W.; J. Solid State Chem.1998, 139, 326.
44. Wei, H. H.; Wang, C. H.; Lu, J. W.; Takeda, M.; Inorg. Chim. Acta2007,
360, 2944.