SNP309 Polymorphism with Colorectal Cancer Risk
Xue Qin
1☯, Qiliu Peng
1☯, Weizhong Tang
2☯, Xianjun Lao
1☯, Zhiping Chen
3, Hao Lai
4, Yan Deng
1, Cuiju Mo
1,
Jingzhe Sui
1, Junrong Wu
1, Limin Zhai
1, Shi Yang
1, Shan Li
1*, Jinmin Zhao
5*1 Department of Clinical Laboratory, First Affiliated Hospital of Guangxi Medical University, Nanning, Guangxi, China, 2 Department of Anal and Colorectal Surgery, First Affiliated Hospital of Guangxi Medical University, Nanning, Guangxi, China, 3 Department of Occupational Health and Environmental Health, School of Public Health at Guangxi Medical University, Nanning, Guangxi, China, 4 Department of Gastrointestinal Surgery, Tumor Hospital of Guangxi Medical University, Nanning, Guangxi, China, 5 Department of Orthopedic Trauma Surgery, First Affiliated Hospital of Guangxi Medical University, Nanning, Guangxi, China
Abstract
Background: The mouse double minute 2 (MDM2) gene encodes a phosphoprotein that interacts with P53 and negatively regulates its activity. The SNP309 polymorphism (T-G) in the promoter of MDM2 gene has been reported to be associated with enhanced MDM2 expression and tumor development. Studies investigating the association between MDM2 SNP309 polymorphism and colorectal cancer (CRC) risk reported conflicting results. We performed a meta-analysis of all available studies to explore the association of this polymorphism with CRC risk.
Methods: All studies published up to July 2013 on the association between MDM2 SNP309 polymorphism and CRC risk were identified by searching electronic databases PubMed, EMBASE, and Chinese Biomedical Literature database (CBM) databases. The association between the MDM2 SNP309 polymorphism and CRC risk was assessed by odds ratios (ORs) together with their 95% confidence intervals (CIs).
Results: A total of 14 case-control studies including 4460 CRC cases and 4828 controls were identified. We did not find a significant association between the MDM2 SNP309 polymorphism and CRC risk in all genetic models in overall population. However, in subgroup analysis by ethnicity, significant associations were found in Asians (TG vs. TT: OR = 1.197, 95% CI = 1.055–1.358, P=0.005; GG+TG vs. TT: OR = 1.246, 95% CI = 1.106–1.404, P=0.000) and Africans. When stratified by HWE in controls, significantly increased risk was also found among the studies consistent with HWE (TG vs. TT: OR = 1.166, 95% CI = 1.037–1.311, P= 0.010). In subgroup analysis according to p53 mutation status, and gender, no any significant association was detected.
Conclusions: The present meta-analysis suggests that the MDM2 is a candidate gene for CRC susceptibility. The MDM2 SNP309 polymorphism may be a risk factor for CRC in Asians.
Citation: Qin X, Peng Q, Tang W, Lao X, Chen Z, et al. (2013) An Updated Meta-Analysis on the Association of MDM2 SNP309 Polymorphism with Colorectal Cancer Risk. PLoS ONE 8(9): e76031. doi:10.1371/journal.pone.0076031
Editor: Balraj Mittal, Sanjay Gandhi Medical Institute, India
Received July 18, 2013; Accepted August 21, 2013; Published September 30, 2013
Copyright: © 2013 Qin et al. This is an open-access article distributed under the terms of the Creative Commons Attribution License, which permits unrestricted use, distribution, and reproduction in any medium, provided the original author and source are credited.
Funding: This research was supported by National Natural Science Foundation of China (No. 81260302). The funders had no role in study design, data collection and analysis, decision to publish, or preparation of the manuscript.
Competing interests: The authors have declared that no competing interests exist. * E-mail: [email protected] (SL); [email protected] (JZ)
☯ These authors contributed equally to this work.
Introduction
Colorectal cancer (CRC) is one of the most common forms of cancer and is the third leading cause of cancer-related death worldwide [1]. In Europe and the USA, CRC represents one of the primary causes of cancer deaths [1,2]. In Asia, CRC is the fourth leading cause of mortality by cancer, and its incidence is increasing [3]. In recent years, the incidence of CRC is increasing in China, which accounts for about 6.5% of total cancers in urban areas and 4.6% in rural areas [4]. Previous
epidemiological studies have identified dietary factors, such as consumption of meat, especially red meat, and cigarette smoking as possible risk factors for the development of CRC [5,6]. However, most individuals with these known dietary risk factors never develop CRC while many CRC cases develop among individuals without those known risk factors. The exact mechanism of CRC carcinogenesis is still far from clear.
indicated that MDM2 can bind directly to P53 protein and inhibit its activity, thus resulting in its degradation via the ubiquitination pathway [8]. A single nucleotide polymorphism (SNP) in the promoter region of MDM2, SNP T309G (rs2279744), has been identified and was demonstrated to up-regulate the expression of MDM2 via a greater affinity for the SP1 transcription factor. Consequently, individuals carrying the GG genotype of the MDM2 SNP309 polymorphism were found to have higher MDM2 levels, which led to attenuation of the TP53 pathway and acceleration of tumor formation in humans [9]. It was reported that the increase in MDM2 results in direct inhibition of p53 transcriptional activity, enabling damaged cells to escape the cell-cycle checkpoint and become carcinogenic [10]. Hence, it is biologically reasonable to hypothesize a potential relationship between the MDM2 SNP309 polymorphism and CRC risk.
Over the last two decades, a number of molecular epidemiological studies have been conducted to investigate the association between the MDM2 SNP309 polymorphism and CRC risk, but the results remain inconsistent. In addition, previous two meta-analyses on this issue also generated conflicting results [11,12]. Small genetic association studies have various designs, different methodology, and insufficient power, and could inevitably increase the risk that chance could be responsible for their conclusions, while combining data from all eligible studies by meta-analysis has the advantage of reducing random error and obtaining precise estimates for some potential genetic associations. Therefore, in this study, we conducted a quantitative updated meta-analysis including all eligible data up to July 2013, increasing statistical power to derive a more precise estimation of the relationship.
Materials and Methods
Search strategy
This study was performed according to the proposal of Meta-analysis of Observational Studies in Epidemiology group (MOOSE) [13]. We conducted a comprehensive literature search in PubMed, Embase, and Chinese Biomedical Literature database (CBM) databases up to July 01, 2013 using the following search strategy: (“colorectal cancer”, “CRC”, “colon cancer” or “rectum cancer”) and (“Murine double minute 2”, or “MDM2”) and (“polymorphism”, “variation”, “mutation”, “genotype”, or “genetic polymorphism”). There was no restriction on time period, sample size, population, language, or type of report. All eligible studies were retrieved and their references were checked for other relevant studies. The literature retrieval was performed in duplication by two independent reviewers (Xue Qin and Qiliu Peng). When multiple publications reported on the same or overlapping data, we chose the most recent or largest population. When a study reported the results on different subpopulations, we treated it as separate studies in the meta-analysis.
Selection criteria
Studies included in the meta-analysis were required to meet the following criteria: (1) Case–control studies which evaluated the association between MDM2 SNP309 polymorphism and
CRC risk; (2) used an unrelated case–control design; (3) had an odds ratio (OR) with 95% confidence interval (CI) or other available data for estimating OR (95% CI); and (4) control population did not contain malignant tumor patients. Conference abstracts, case reports, editorials, review articles, and letters were excluded.
Data extraction
Two reviewers (Xue Qin and Qiliu Peng) independently reviewed and extracted data from all eligible studies. Data extracted from eligible studies included the first author, year of publication, country of origin, ethnicity, genotyping method, matching criteria, source of control, CRC diagnosis criteria, total numbers of cases and controls and genotype frequencies of cases and controls. Ethnic backgrounds were categorized as Caucasian, Asian, and African. When a study did not state the ethnic descendent or if it was not possible to separate participants according to such phenotype, the group reported was termed as “mixed ethnicity”. To ensure the accuracy of the extracted information, the two investigators checked the data extraction results and reached consensus on all of the data extracted. If different results were generated, they would check the data again and have a discussion to come to an agreement. A third reviewer (Li Shan) was invited to the discussion if disagreement still existed.
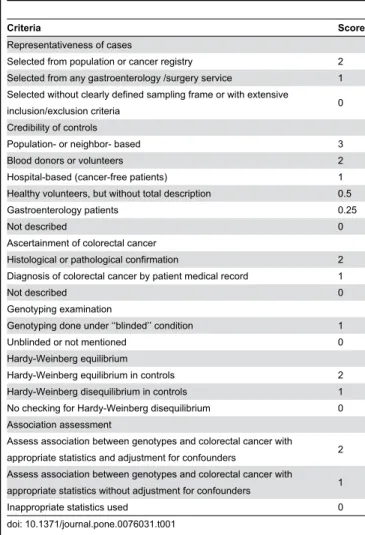
Methodological quality assessment
Methodological quality was independently assessed by two reviewers (Xue Qin and Qiliu Peng), according to a set of predefined criteria (Table 1) based on the scale of Thakkinstian et al. [14]. The revised criteria cover the credibility of controls, the representativeness of cases, assessment of CRC, genotyping examination, Hardy-Weinberg equilibrium in the control population, and association assessment. Disagreements were resolved by consensus. Scores ranged from 0 (lowest) to 12 (highest). Articles with scores less than 8 were considered ‘‘low -quality’’ studies, whereas those with scores equal to or higher than 8 were considered “high-quality’’ studies.
Statistical analysis
The strength of the association between MDM2 SNP309 polymorphism and CRC risk was measured by odds ratios (ORs) with 95% confidence intervals (CIs). The significance of the pooled OR was determined by Z test and a p value of less than 0.05 was considered significant. We assessed the association of MDM2 SNP309 polymorphism with CRC risk using additive models (GG vs. TT and TG vs. TT), recessive model (GG vs. TG+TT), and dominant model (GG+TG vs. TT).
The Q test and I2 statistics were used to assess the statistical
heterogeneity among studies [15,16]. If the result of the Q test was PQ < 0.1, indicating the presence of heterogeneity, a
random-effects model (the DerSimonian and Laird method) was used to estimate the summary ORs [17]; otherwise, when the result of the Q test was PQ ≥ 0.1, indicating the absence of
heterogeneity, the fixed-effects model (the Mantel–Haenszel method) was used [18]. To explore the sources of heterogeneity among studies, we performed logistic MDM2 SNP309 Polymorphism with Colorectal Cancer
metaregression and subgroup analyses. The following study characteristics were included as covariates in the metaregression analysis: genotyping methods (PCR-RFLP versus not PCR-RFLP), ethnicity (Caucasian population versus Asian population), source of controls (Hospital-based versus Population-based), Quality scores (High-quality versus Low-quality) and CRC diagnosis (pathologically or histologically confirmed versus other diagnosis criteria). Subgroup analyses were conducted by ethnicity, p53 mutation status, gender, and HWE in controls. Galbraith plots analysis was performed for further exploration of the heterogeneity.
Sensitivity analysis was performed by sequential omission of individual studies. Publication bias was evaluated using a funnel plot and Egger’s regression asymmetry test [19]. If publication bias existed, the Duval and Tweedie non-parametric “trim and fill” method was used to adjust for it [20]. The distribution of the genotypes in the control population was tested for HWE using a goodness-of-fit Chi-square test. All analyses were performed using Stata software, version 12.0 (Stata Corp., College Station, TX). All p values were two-sided. To ensure the reliability and the accuracy of the results, two authors entered the data into the statistical software programs independently with the same results.
Table 1. Scale for Quality Assessment.
Criteria Score
Representativeness of cases
Selected from population or cancer registry 2 Selected from any gastroenterology /surgery service 1 Selected without clearly defined sampling frame or with extensive
inclusion/exclusion criteria 0 Credibility of controls
Population- or neighbor- based 3 Blood donors or volunteers 2 Hospital-based (cancer-free patients) 1 Healthy volunteers, but without total description 0.5 Gastroenterology patients 0.25
Not described 0
Ascertainment of colorectal cancer
Histological or pathological confirmation 2 Diagnosis of colorectal cancer by patient medical record 1
Not described 0
Genotyping examination
Genotyping done under ‘‘blinded’’ condition 1 Unblinded or not mentioned 0 Hardy-Weinberg equilibrium
Hardy-Weinberg equilibrium in controls 2 Hardy-Weinberg disequilibrium in controls 1 No checking for Hardy-Weinberg disequilibrium 0 Association assessment
Assess association between genotypes and colorectal cancer with
appropriate statistics and adjustment for confounders 2 Assess association between genotypes and colorectal cancer with
appropriate statistics without adjustment for confounders 1 Inappropriate statistics used 0 doi: 10.1371/journal.pone.0076031.t001
Results
Characteristics of studies
Based on our search criteria, 242 individual records were found, but only 17 full-text publications were preliminarily identified for further detailed evaluation (Figure 1). According to the exclusion criteria, 5 publications were excluded including 2 publications containing overlapping data [21,22], 1 for not presenting sufficient data for calculating OR and 95% CI [23], and 2 were meta-analysis [11,12]. Manual search of references cited in the eligible studies identified 1 additional article [24]. As a result, a total of 13 relevant studies including 12 English articles [24,25,26,27,28,29,30,31,32,33,34,35], and 1 Chinese study [36] met the inclusion criteria for the meta-analysis. Among them, one of the eligible studies contained data on two different populations (Finnish and American) [26] and we treated it independently. Therefore, a total of 14 separate comparisons including a total of 4460 CRC cases and 4828 controls were finally included in our meta-analysis. The main characteristics of the studies were presented in Table 2. Of all the eligible studies, 7 were conducted in Caucasian populations, 6 were in Asians, and 1 was in Africans. Six studies were population–based and 8 were hospital–based studies. All studies used validated methods including PCR-RFLP, PCR-SSCP, TaqMan assay, FISH, MALDI-TOF, and On-Chip Electrophoresis to genotype the MDM2 SNP309 polymorphism. The CRC cases were histologically confirmed or pathologically confirmed in 9 of the eligible studies. The genotype distributions of the controls in 5 studies [26,28,32,34,36] were not consistent with HWE for MDM2 SNP309 polymorphism.
Meta-analysis
Test of heterogeneity
Significant heterogeneity was observed in the association analysis between the MDM2 SNP309 polymorphism and CRC risk in the overall populations in all comparisons (GG vs. TT: PQ
= 0.000; GT vs. TT: PQ = 0.000; GG+ GT vs. TT: PQ = 0.000;
GG vs. GT+ TT: PQ = 0.000; Table 3). To explore the sources
of heterogeneity, we performed metaregression and subgroup analyses. Metaregression analysis of data showed that the ethnicity was the major source which contributed to heterogeneity. The Genotyping methods, Source of control, Quality scores, and CRC diagnosis were not effect modifiers. Subsequently, we performed subgroup analyses stratified by ethnicity. However, heterogeneity still existed in most of the genetic comparison models among Asians (GG vs. TT: PQ =
0.000; GG+ GT vs. TT: PQ = 0.046; GG vs. GT+ TT: PQ =
0.000; Table 3). To further investigate the heterogeneity, we
performed Galbraith plots analysis to identify the outliers which might contribute to the heterogeneity. Our results showed that the studies Liu et al. [30] and Chaar et al. [34] were outliers in additive models GG vs. TT and GT vs. TT (Figure 3), recessive model GG vs. GT+ TT, and dominant model GG+ GT vs. TT in the overall populations. All I2 values decreased obviously and
PQ values were greater than 0.10 after excluding the two
studies Liu et al. [30] and Chaar et al. [34] in all genetic comparison models in the overall populations (GG vs. TT: PQ =
0.172; GT vs. TT: PQ = 0.297; GG+ GT vs. TT: PQ = 0.280; GG
vs. GT+ TT: PQ = 0.185), Asians (GG vs. TT: PQ = 0.132; GG+
GT vs. TT: PQ = 0.371; GG vs. GT+ TT: PQ = 0.119), and
studies consistent with HWE (GG vs. TT: PQ = 0.347; GG+ GT
vs. TT: PQ = 0.412; GG vs. GT+ TT: PQ = 0.202). The
significance of the summary ORs for MDM2 SNP309 polymorphism in different comparison models in the overall
Figure 1. Flowchart of selection of studies for inclusion in meta-analysis.
doi: 10.1371/journal.pone.0076031.g001
MDM2 SNP309 Polymorphism with Colorectal Cancer
population and subgroup analyses were not influenced by omitting the two studies.
Sensitivity analysis
Sensitivity analysis was performed to assess the influence of each individual study on the pooled OR by sequential removal of individual studies. The results suggested that no individual study significantly affected the pooled ORs (Figure 4). Sensitivity analysis by excluding HWE-violating studies did not perturb the overall results.
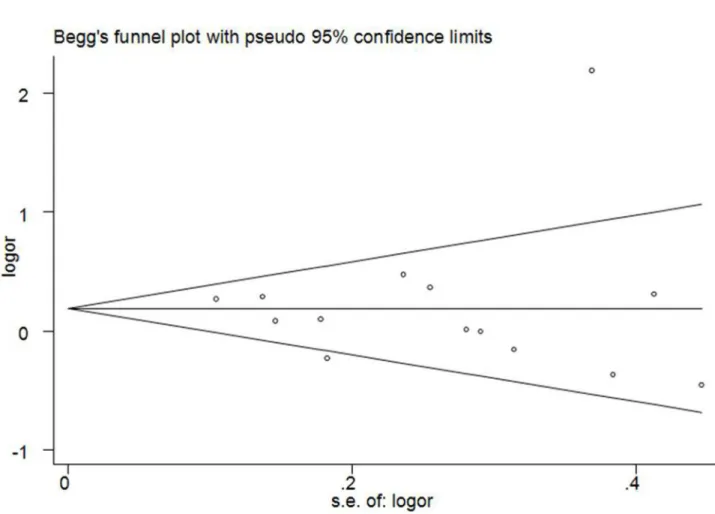
Publication bias
Begg’s funnel plot and Egger’s test were performed to access the publication bias of literatures in this meta-analysis. The shapes of Funnel plot did not reveal obvious evidence of asymmetry, and all the p values of Egger’s tests were more than 0.05, providing statistical evidence of the funnel plots’ symmetry (Figure 5). Thus, the results above suggested that publication bias was not evident in this meta-analysis.
Discussion
Previous studies investigating the association between the MDM2 SNP309 polymorphism with CRC risk have provided inconsistent results, and most of those studies involved no more than a few hundred CRC cases, which is too few to assess any genetic effects reliably. Meta-analysis has been recognized as an important tool to more precisely define the effect of selected genetic polymorphisms on the risk for disease and to identify potentially important sources of between-study heterogeneity. A meta-analysis of 8 studies by
Cao et al. [12] in 2011 showed that the MDM2 SNP309 polymorphism might be a risk factor for CRC, the variant genotype was associated with a significant increased CRC risk among the overall populations (GT vs. TT: OR=1.19, 95% CI=1.06–1.35) and Asians (GT vs. TT: OR=1.28, 95% CI=1.10–1.50). Another meta-analysis including 7 studies by Fang et al. [11], performed almost at the same time and quite similar in methods, drew opposite conclusion. The authors revealed that the MDM2 SNP309 polymorphism played a protective role in CRC susceptibility in Asians (GG vs. TT: OR = 0.51, 95% CI = 0.41–0.64; GG vs. TG: OR = 0.64, 95% CI = 0.53–0.78; GG+TG vs. TT: OR = 0.59, 95% CI = 0.49–0.71; GG vs. TG+TT: OR = 0.69, 95% CI = 0.57–0.82). The previous meta-analyses did not cover all eligible studies especially studies published in Chinese. Some studies were only indexed in the CBM database but not indexed in the databases selected in the meta-analyses by Cao et al. and Fang et al., which could lead to location bias and might bias the effect estimate of a meta-analysis. Furthermore, a number of new case–control studies have been published after these two meta-analyses. Hence, to provide the most comprehensive assessment of the associations between the MDM2 SNP309 polymorphism with CRC risk, we performed an updated meta-analysis of all available studies. The meta-analysis was carried out by critically reviewing 14 individual case–control studies on MDM2 SNP309 polymorphism and CRC risk. Subgroup analyses were mainly done by ethnicity, p53 mutation status, gender, and HWE in controls. Heterogeneity analysis and sensitivity analysis were also critically performed to ensure the epidemiological credibility of this meta-analysis. We found that the MDM2 SNP309 polymorphism was associated with an increased CRC risk among Asians (TG vs. TT: OR = 1.197,
Table 2. Characteristics of studies included in this meta-analysis.
First author (Year)Country Ethnicity
Sample size
(case/control) Genotyping methods Matching criteria
Source of
control CRC diagnosis Quality scores
HWE(P value)
Alhopuro 2005 Finland Caucasian 969/185 PCR-RFLP Region PB HC 8 0.282 Sotamaa1 2005 Finland Caucasian 121/209 PCR-RFLP Region, gender PB NA 8 0.351 Sotamaa2 2005 America Caucasian 30/138 PCR-RFLP Region, gender PB NA 8 0.004
Menin 2006 Italy Caucasian 153/92 PCR-SSCP Region PB HC 5 0.689 Talseth 2006 Australia Caucasian 116/98 TaqMan, Assay NA HB NA 5 0.085 Alazzouzi 2007 Spain Caucasian 152/184 PCR-SSCP Ethnicity HB NA 4 0.011
Liu 2008 China Asian 1000/1300 ARMS-PCR Age, gender HB PC 10 0.757
Jin 2008 China Asian 202/836 PCR-RFLP Smoking,
drinking,gender PB PC 9 0.000 Chen 2009 China Asian 123/138 PCR-SSCP NA HB NA 4 0.017
Sugano 2010 Japan Asian 211/59 FISH NA HB PC 5 0.604
Joshi 2011 Japan Asian 685/778 PCR-RFLP Age, gender PB HC 11 0.775 Zhang 2012 China Asian 444/569 MALDI-TOF Age, gender HB HC 8 0.928 Chaar 2012 Tunisia African 167/167 On-Chip Electrophoresis Region HB HC 6 0.000
Tuna 2013 Turkey Caucasian 87/75 PCR-RFLP Age, Region HB HC 5.5 0.986 HC, Histologically confirmed; PC, Pathologically confirmed; NA, Not available; PB, Population–based; HB, Hospital–based; HWE, Hardy–Weinberg equilibrium in control population; PCR–RFLP, Polymerase chain reaction-restriction fragment length polymorphism; PCR-SSCP, Polymerase chain reaction–single strand conformation polymorphism; ARMS-PCR, Amplification Refractory Mutation System-Polymerase Chain Reaction; MALDI-TOF, Matrix-assisted laser desorption/ionization time-of-flight; FISH, Fluorescence in situ hybridization
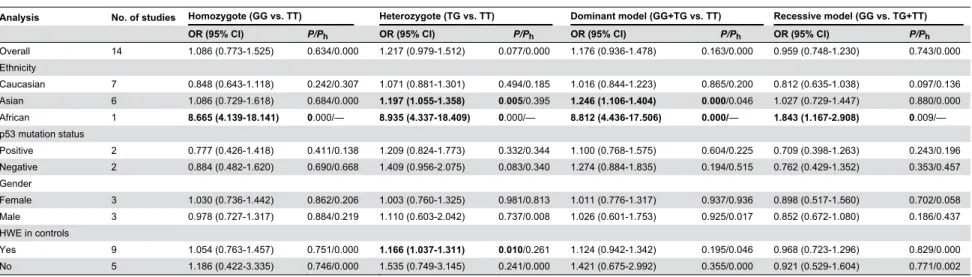
Table 3. Meta-analysis of MDM2 SNP309 polymorphism and CRC risk.
Analysis No. of studies Homozygote (GG vs. TT) Heterozygote (TG vs. TT) Dominant model (GG+TG vs. TT) Recessive model (GG vs. TG+TT)
OR (95% CI) P/Ph OR (95% CI) P/Ph OR (95% CI) P/Ph OR (95% CI) P/Ph
Overall 14 1.086 (0.773-1.525) 0.634/0.000 1.217 (0.979-1.512) 0.077/0.000 1.176 (0.936-1.478) 0.163/0.000 0.959 (0.748-1.230) 0.743/0.000 Ethnicity
Caucasian 7 0.848 (0.643-1.118) 0.242/0.307 1.071 (0.881-1.301) 0.494/0.185 1.016 (0.844-1.223) 0.865/0.200 0.812 (0.635-1.038) 0.097/0.136 Asian 6 1.086 (0.729-1.618) 0.684/0.000 1.197 (1.055-1.358) 0.005/0.395 1.246 (1.106-1.404) 0.000/0.046 1.027 (0.729-1.447) 0.880/0.000 African 1 8.665 (4.139-18.141) 0.000/— 8.935 (4.337-18.409) 0.000/— 8.812 (4.436-17.506) 0.000/— 1.843 (1.167-2.908) 0.009/— p53 mutation status
Positive 2 0.777 (0.426-1.418) 0.411/0.138 1.209 (0.824-1.773) 0.332/0.344 1.100 (0.768-1.575) 0.604/0.225 0.709 (0.398-1.263) 0.243/0.196 Negative 2 0.884 (0.482-1.620) 0.690/0.668 1.409 (0.956-2.075) 0.083/0.340 1.274 (0.884-1.835) 0.194/0.515 0.762 (0.429-1.352) 0.353/0.457 Gender
Female 3 1.030 (0.736-1.442) 0.862/0.206 1.003 (0.760-1.325) 0.981/0.813 1.011 (0.776-1.317) 0.937/0.936 0.898 (0.517-1.560) 0.702/0.058 Male 3 0.978 (0.727-1.317) 0.884/0.219 1.110 (0.603-2.042) 0.737/0.008 1.026 (0.601-1.753) 0.925/0.017 0.852 (0.672-1.080) 0.186/0.437 HWE in controls
Yes 9 1.054 (0.763-1.457) 0.751/0.000 1.166 (1.037-1.311) 0.010/0.261 1.124 (0.942-1.342) 0.195/0.046 0.968 (0.723-1.296) 0.829/0.000 No 5 1.186 (0.422-3.335) 0.746/0.000 1.535 (0.749-3.145) 0.241/0.000 1.421 (0.675-2.992) 0.355/0.000 0.921 (0.529-1.604) 0.771/0.002 Ph P values of Q-test for heterogeneity test. OR, odds ratio; CI, confidence intervals; HWE, Hardy–Weinberg equilibrium
doi: 10.1371/journal.pone.0076031.t003
MDM2 SNP309 Polymorphism with Colorectal Cancer
PLOS ONE | www.plosone.org
6
95% CI = 1.055–1.358, P=0.005; GG+TG vs. TT: OR = 1.246, 95% CI = 1.106–1.404, P=0.000), which was in accordance with the previously published meta-analysis by Cao et al. [12].
P53 is the most frequently mutated gene in human tumors [37]. In view of the robust effect of p53 mutation in carcinogenesis, the impact of MDM2 SNP309 polymorphism on the Li-Fraumeni syndrome has been characterized in several studies [38,39]. Furthermore, significant higher risk associated with GG genotype of MDM2 SNP309 polymorphism among the p53 mutation-positive subgroup have been found in lung cancer [40] and gastric cancer [41], showing that SNP309 G allele could accelerate tumor formation and cause the occurrence of multiple primary tumors in a lifetime for P53 mutation carriers [9,38]. Therefore, it is necessary to incorporate the mutation status of p53 when explore the effects of MDM2 SNP309 on tumors. Thus far, there were only two studies on the association between MDM2 SNP309 polymorphism and CRC risk according to p53 mutation status
in cases available for pooled analysis [27,28]. However, no significant discrepancy was found in the two p53 mutation status subgroups, probably because of the insufficient statistical power. Further functional and molecular epidemiologic studies were suggested to explore the joint/ interaction effects between functional polymorphisms in p53-MDM2–related genes and p53 mutation status in CRC susceptibility.
When stratified by ethnicity, the MDM2 SNP309 polymorphism presented a risk factor for CRC in Asian and African populations, but not in Europeans. Actually, it might not be uncommon for the same polymorphism playing different roles in cancer susceptibility among different ethnic populations. In Asians and Africans, the differences in genetic backgrounds and the environment they lived in may influence the association between the MDM2 SNP309 polymorphism and CRC risk. In addition, owing to the limited number of relevant studies among African population included in this
meta-Figure 2. Subgroup analysis by ethnicity in the meta-analysis on the association between MDM2 SNP309 polymorphism and CRC risk using a random-effect model (additive model TG versus TT).
analysis, the observed positive association between MDM2 SNP309 polymorphism and CRC risk in Africans is likely to be caused by chance because study with small sample sizes may have insufficient statistical power to detect a slight effect or may have generated a fluctuated risk estimate. Currently there is only one study [34] on MDM2 SNP309 polymorphism and CRC risk among African population, and the genotype distributions in the control population of this study was deviated from HWE. Therefore, the positive results of the African population should be interpreted with caution.
It seemed that selection bias could have played a role because the genotype distribution of the MDM2 SNP309 polymorphism among control subjects disobeyed the law of HWE in five studies [26,28,32,34,36]. It is widely believed that deviation from HWE may be as a result of genetic reasons including non-random mating, or the alleles reflect recent mutations that have not reached equilibrium, as well as methodological reasons including biased selection of subjects from the population or genotyping errors [42,43]. Because of the reasons of disequilibrium, the results of genetic association studies might be spurious if the distribution of genotypes in the control groups were not in HWE [44,45]. Hence, we carried out
subgroup analysis by HWE in controls. When excluding the studies that were not in HWE, the results were persistent and robust, suggesting that this factor probably had little effect on the overall estimates.
Evidence suggests that estrogen receptors have been widely detected in cancer cells, indicating that sex steroid may play a critical role in the pathogenesis of cancers [46,47]. Besides, MDM2 may act as a strong contributor via the P53-independent pathway during the process of estrogen-induced cell proliferation [48]. MDM2 can induce expression of the p65 subunit of NF-kB, which is an anti-apoptotic factor expressed in neoplastic cells [49]. In addition, SNP309 of MDM2 increases the binding affinity for Sp1, a coactivator of receptors for multiple hormones including estrogen. It could potentially affect the hormone-dependent regulation of MDM2 transcription and result in further elevation of the MDM2 protein levels [50,51]. Thus, the MDM2 SNP309 polymorphism might accelerate carcinogenesis of colorectal tissues in a gender-specific manner [52]. Therefore, we carried out subgroup analysis according to gender. However, no significant associations were found in both Female and Male subgroups for all genetic models in our meta-analysis. The results should be interpreted
Figure 3. Galbraith plots of MDM2 SNP309 polymorphism and CRC risk in additive model TG versus TT. The studies of Chaar et al. and Liu et al. were spotted as outliers.
doi: 10.1371/journal.pone.0076031.g003
MDM2 SNP309 Polymorphism with Colorectal Cancer
with care because of the limited numbers of the original studies. Therefore, further studies concerning stratification for gender are needed to increase power for the association estimation.
Heterogeneity is a potential problem when interpreting the results of a meta-analysis, and finding the sources of heterogeneity is one of the most important goals of meta-analysis [53]. In the present meta-meta-analysis, significant between-study heterogeneity in the pooled analyses of total eligible studies was observed (all PQ values were 0.000). To find the
sources of heterogeneity, we performed metaregression and subgroup analyses. Metaregression analysis of data showed that the ethnicity was the major source which contributed to heterogeneity. The Genotyping methods, Source of control, Quality scores, and CRC diagnosis were not effect modifiers. Subgroup analysis by ethnicity showed that the heterogeneity was still significant in Asians. To further investigate the heterogeneity, Galbraith plots analysis was performed to identify the outliers which might contribute most to the heterogeneity. Our results showed that the studies of Liu et al. [30] and Chaar et al. [34] were outliers of all genetic comparison models in the overall populations. All I2 values
decreased lower than 50% and PQ values were larger than 0.10
after excluding the studies of Liu et al. [30] and Chaar et al. [34]
in all genetic comparison models in the overall populations and Asians. In addition, the summary ORs for the MDM2 SNP309 polymorphism in different comparison models in the overall population and subgroup analyses were not material change by omitting the two studies, indicating that our results were robust and reliable. The results indicated that the two studies might be the major source of the heterogeneity in the meta-analysis.
Some possible limitations in this meta-analysis should be acknowledged. Firstly, in subgroup analysis by ethnicity, p53 mutation status, and gender, the sample size of population was relatively small for stratified analyses, which may lead to relatively weak power to detect the real relationship. Secondly, our results were based on unadjusted estimates. We did not perform the analysis adjusted for other covariates such as age, drinking status, cancer type, environment factors, and so on, because of the unavailable original data of the eligible studies.
In conclusion, our meta-analysis provided a more precise estimation based on larger sample size compared with the previous meta-analyses. Our study suggested that the MDM2 SNP309 polymorphism might contribute to CRC risk, especially in Asian populations. In order to further verify our findings, large well-designed epidemiological studies are warranted.
Figure 4. Influence analysis for additive model TG versus TT in the overall meta-analysis. This figure shows the influence of individual studies on the summary OR. The middle vertical axis indicates the overall OR and the two vertical axes indicate its 95% CI. Every hollow round indicates the pooled OR when the left study is omitted in this meta-analysis. The two ends of every broken line represent the 95% CI.
Supporting Information
Checklist S1. PRISMA checklist.
(DOC)
Figure S1. Flow diagram of included studies for this meta-analysis.
(TIF)
Author Contributions
Conceived and designed the experiments: XQ QP WT XL SL JZ. Performed the experiments: HL YD CM JS JW. Analyzed the data: ZC XQ QP. Contributed reagents/materials/analysis tools: LZ SY. Wrote the manuscript: QX QP XL.
References
1. Jemal A, Siegel R, Xu J, Ward E (2010) Cancer statistics, 2010. CA Cancer J Clin 60: 277-300. doi:10.3322/caac.20073. PubMed: 20610543.
2. Ferlay J, Parkin DM, Steliarova-Foucher E (2010) Estimates of cancer incidence and mortality in Europe in 2008. Eur J Cancer 46: 765-781. doi:10.1016/j.ejca.2009.12.014. PubMed: 20116997.
3. Sung JJ, Lau JY, Goh KL, Leung WK (2005) Increasing incidence of colorectal cancer in Asia: implications for screening. Lancet Oncol 6: 871-876. doi:10.1016/S1470-2045(05)70422-8. PubMed: 16257795. 4. Zhao P, Dai M, Chen W, Li N (2010) Cancer trends in China. Jpn J Clin
Oncol 40: 281-285. doi:10.1093/jjco/hyp187. PubMed: 20085904. 5. Le Marchand L, Donlon T, Seifried A, Wilkens LR (2002) Red meat
intake, CYP2E1 genetic polymorphisms, and colorectal cancer risk. Cancer Epidemiol Biomarkers Prev 11: 1019-1024. PubMed: 12376502.
6. Küry S, Buecher B, Robiou-du-Pont S, Scoul C, Sébille V et al. (2007) Combinations of cytochrome P450 gene polymorphisms enhancing the risk for sporadic colorectal cancer related to red meat consumption. Cancer Epidemiol Biomarkers Prev 16: 1460-1467. doi: 10.1158/1055-9965.EPI-07-0236. PubMed: 17627011.
7. Wu H, Leng RP (2011) UBE4B, a ubiquitin chain assembly factor, is required for MDM2-mediated p53 polyubiquitination and degradation. Cell Cycle 10: 1912-1915. doi:10.4161/cc.10.12.15882. PubMed: 21558803.
8. Poyurovsky MV, Katz C, Laptenko O, Beckerman R, Lokshin M et al. (2010) The C terminus of p53 binds the N-terminal domain of MDM2. Nat Struct Mol Biol 17: 982-989. doi:10.1038/nsmb.1872. PubMed: 20639885.
9. Bond GL, Hu W, Bond EE, Robins H, Lutzker SG et al. (2004) A single nucleotide polymorphism in the MDM2 promoter attenuates the p53
Figure 5. Funnel plots for publication bias of the meta-analysis on the association between MDM2 SNP309 polymorphism and CRC risk of the overall populations (additive model TG versus TT).
doi: 10.1371/journal.pone.0076031.g005
MDM2 SNP309 Polymorphism with Colorectal Cancer
tumor suppressor pathway and accelerates tumor formation in humans. Cell 119: 591-602. doi:10.1016/j.cell.2004.11.022. PubMed: 15550242. 10. Levav-Cohen Y, Haupt S, Haupt Y (2005) Mdm2 in growth signaling
and cancer. Growth Factors 23: 183-192. doi: 10.1080/08977190500196218. PubMed: 16243710.
11. Fang F, Yu XJ, Yu L, Yao L (2011) MDM2 309 T/G polymorphism is associated with colorectal cancer risk especially in Asians: a meta-analysis. Med Oncol 28: 981-985. doi:10.1007/s12032-010-9577-1. PubMed: 20503107.
12. Cao X, Zhang T, Zhao Z, Zhao T (2012) MDM2 SNP309 polymorphism and colorectal cancer risk: a meta-analysis. DNA Cell Biol 31: 355-359. doi:10.1089/dna.2011.1338. PubMed: 21770737.
13. Stroup DF, Berlin JA, Morton SC, Olkin I, Williamson GD et al. (2000) Meta-analysis of observational studies in epidemiology: a proposal for reporting. Meta-analysis Of Observational Studies in Epidemiology (MOOSE) group. JAMA 283: 2008-2012. doi:10.1001/jama. 283.15.2008. PubMed: 10789670.
14. Thakkinstian A, McEvoy M, Minelli C, Gibson P, Hancox B et al. (2005) Systematic review and meta-analysis of the association between {beta}2-adrenoceptor polymorphisms and asthma: a HuGE review. Am J Epidemiol 162: 201-211. doi:10.1093/aje/kwi184. PubMed: 15987731. 15. Higgins JP, Thompson SG, Deeks JJ, Altman DG (2003) Measuring inconsistency in meta-analyses. BMJ 327: 557-560. doi:10.1136/bmj. 327.7414.557. PubMed: 12958120.
16. Higgins JP, Thompson SG (2002) Quantifying heterogeneity in a meta-analysis. Stat Med 21: 1539-1558. doi:10.1002/sim.1186. PubMed: 12111919.
17. DerSimonian R, Laird N (1986) Meta-analysis in clinical trials. Control Clin Trials 7: 177-188. doi:10.1016/0197-2456(86)90046-2. PubMed: 3802833.
18. Mantel N, Haenszel W (1959) Statistical aspects of the analysis of data from retrospective studies of disease. J Natl Cancer Inst 22: 719-748. PubMed: 13655060.
19. Egger M, Davey Smith G, Schneider M, Minder C (1997) Bias in meta-analysis detected by a simple, graphical test. BMJ 315: 629-634. doi: 10.1136/bmj.315.7109.629. PubMed: 9310563.
20. Duval S, Tweedie R (2000) Trim and fill: A simple funnel-plot-based method of testing and adjusting for publication bias in meta-analysis. Biometrics 56: 455-463. doi:10.1111/j.0006-341X.2000.00455.x. PubMed: 10877304.
21. Chaar I, Amara S, Khiari M, Ounissi D, Dhraif M et al. (2013) Relationship between MDM2 and p53 alterations in colorectal cancer and their involvement and prognostic value in the Tunisian population. Appl Immunohistochem Mol Morphol 21: 228-236. PubMed: 22914606. 22. Bond GL, Menin C, Bertorelle R, Alhopuro P, Aaltonen LA et al. (2006)
MDM2 SNP309 accelerates colorectal tumour formation in women. J Med Genet 43: 950-952. doi:10.1136/jmg.2006.043539. PubMed: 16825430.
23. Khan SA, Idrees K, Forslund A, Zeng Z, Rosenberg S et al. (2008) Genetic variants in germline TP53 and MDM2 SNP309 are not associated with early onset colorectal cancer. J Surg Oncol 97: 621-625. doi:10.1002/jso.20996. PubMed: 18381604.
24. Sugano N, Suda T, Godai TI, Tsuchida K, Shiozawa M et al. (2010) MDM2 gene amplification in colorectal cancer is associated with disease progression at the primary site, but inversely correlated with distant metastasis. Genes Chromosomes Cancer 49: 620-629. PubMed: 20461754.
25. Alhopuro P, Ylisaukko-Oja SK, Koskinen WJ, Bono P, Arola J et al. (2005) The MDM2 promoter polymorphism SNP309T-- G and the risk of uterine leiomyosarcoma, colorectal cancer, and squamous cell carcinoma of the head and neck. J Med Genet 42: 694-698. doi: 10.1136/jmg.2005.031260. PubMed: 16141004.
26. Sotamaa K, Liyanarachchi S, Mecklin JP, Järvinen H, Aaltonen LA et al. (2005) p53 codon 72 and MDM2 SNP309 polymorphisms and age of colorectal cancer onset in Lynch syndrome. Clin Cancer Res 11: 6840-6844. doi:10.1158/1078-0432.CCR-05-1139. PubMed: 16203772. 27. Menin C, Scaini MC, De Salvo GL, Biscuola M, Quaggio M et al. (2006) Association between MDM2-SNP309 and age at colorectal cancer diagnosis according to p53 mutation status. J Natl Cancer Inst 98: 285-288. doi:10.1093/jnci/djj054. PubMed: 16478747.
28. Alazzouzi H, Suriano G, Guerra A, Plaja A, Espín E et al. (2007) Tumour selection advantage of non-dominant negative P53 mutations in homozygotic MDM2-SNP309 colorectal cancer cells. J Med Genet 44: 75-80. doi:10.1136/jmg.2007.049049. PubMed: 16825434. 29. Talseth BA, Meldrum C, Suchy J, Kurzawski G, Lubinski J et al. (2007)
MDM2 SNP309 T>G alone or in combination with the TP53 R72P polymorphism does not appear to influence disease expression and age of diagnosis of colorectal cancer in HNPCC patients. Int J Cancer 120: 563-565. doi:10.1002/ijc.22339. PubMed: 17096342.
30. Liu JN, Zhang XM, Guo YL, Sun T, Lin DX et al. (2008) [Genetic polymorphism in MDM2 is associated with susceptibility to colorectal cancer in a Chinese population]. Zhonghua Zhong Liu Za Zhi 30: 335-338. PubMed: 18953830.
31. Joshi AM, Budhathoki S, Ohnaka K, Mibu R, Tanaka M et al. (2011) TP53 R72P and MDM2 SNP309 polymorphisms and colorectal cancer risk: the Fukuoka Colorectal Cancer Study. Jpn J Clin Oncol 41: 232-238. doi:10.1093/jjco/hyq200. PubMed: 21051533.
32. Chen YL, Chang YS, Chang JG, Wu SM (2009) Genotyping of single nucleotide polymorphism in MDM2 genes by universal fluorescence primer PCR and capillary electrophoresis. Anal Bioanal Chem 394: 1291-1297. doi:10.1007/s00216-008-2416-y. PubMed: 19015838. 33. Zhang Y, Liu L, Tang Y, Chen C, Wang Q et al. (2012) Polymorphisms
in TP53 and MDM2 contribute to higher risk of colorectal cancer in Chinese population: a hospital-based, case-control study. Mol Biol Rep 39: 9661-9668. doi:10.1007/s11033-012-1831-5. PubMed: 22744426. 34. Chaar I, Arfaoui TA, El Amine el HO, Mahmoud LB, Khiari M et al.
(2012) Impact of MDM2 polymorphism: increased risk of developing colorectal cancer and a poor prognosis in the Tunisian population. Eur J Gastroenterol Hepatol 24: 320-327. doi:10.1097/MEG. 0b013e32834bdf84. PubMed: 22266832.
35. Tuna G, Kucukhuseyin O, Arikan S, Kaytan Saglam E, Guler E et al. (2013) Do CDKN2 p16 540 C>G, CDKN2 p16 580 C>T, and MDM2 SNP309 T>G Gene Variants Act on Colorectal Cancer Development or Progression? DNA Cell Biol 32: 400-408.
36. Jin M, Zhang S, Zhang Y, Liu B, Wu Y et al. (2013) Interaction analysis of P53 Pathway gene polymorphisms and colorectal cancer risk. Chin J Dig 32: 703-706.
37. Olivier M, Hussain SP, Caron de Fromentel C, Hainaut P, Harris CC (2004) TP53 mutation spectra and load: a tool for generating hypotheses on the etiology of cancer. IARC Sci Publ: 247-270. PubMed: 15055300.
38. Bougeard G, Baert-Desurmont S, Tournier I, Vasseur S, Martin C et al. (2006) Impact of the MDM2 SNP309 and p53 Arg72Pro polymorphism on age of tumour onset in Li-Fraumeni syndrome. J Med Genet 43: 531-533. doi:10.1136/jmg.2005.037952. PubMed: 16258005. 39. Ruijs MW, Schmidt MK, Nevanlinna H, Tommiska J, Aittomäki K et al.
(2007) The single-nucleotide polymorphism 309 in the MDM2 gene contributes to the Li-Fraumeni syndrome and related phenotypes. Eur J Hum Genet 15: 110-114. doi:10.1038/sj.ejhg.5201715. PubMed: 17003841.
40. Lind H, Zienolddiny S, Ekstrøm PO, Skaug V, Haugen A (2006) Association of a functional polymorphism in the promoter of the MDM2 gene with risk of nonsmall cell lung cancer. Int J Cancer 119: 718-721. doi:10.1002/ijc.21872. PubMed: 16496380.
41. Ohmiya N, Taguchi A, Mabuchi N, Itoh A, Hirooka Y et al. (2006) MDM2 promoter polymorphism is associated with both an increased susceptibility to gastric carcinoma and poor prognosis. J Clin Oncol 24: 4434-4440. doi:10.1200/JCO.2005.04.1459. PubMed: 16983111. 42. Mitchell AA, Cutler DJ, Chakravarti A (2003) Undetected genotyping
errors cause apparent overtransmission of common alleles in the transmission/disequilibrium test. Am J Hum Genet 72: 598-610. doi: 10.1086/368203. PubMed: 12587097.
43. Hosking L, Lumsden S, Lewis K, Yeo A, McCarthy L et al. (2004) Detection of genotyping errors by Hardy-Weinberg equilibrium testing. Eur J Hum Genet 12: 395-399. doi:10.1038/sj.ejhg.5201164. PubMed: 14872201.
44. Salanti G, Amountza G, Ntzani EE, Ioannidis JP (2005) Hardy-Weinberg equilibrium in genetic association studies: an empirical evaluation of reporting, deviations, and power. Eur J Hum Genet 13: 840-848. doi:10.1038/sj.ejhg.5201410. PubMed: 15827565.
45. Trikalinos TA, Salanti G, Khoury MJ, Ioannidis JP (2006) Impact of violations and deviations in Hardy-Weinberg equilibrium on postulated gene-disease associations. Am J Epidemiol 163: 300-309. PubMed: 16410351.
46. Bogush TA, Dudko EA, Beme AA, Bogush EA, Kim AI et al. (2010) Estrogen receptors, antiestrogens, and non-small cell lung cancer. Biochemistry (Mosc) 75: 1421-1427. doi:10.1134/S0006297910120011. PubMed: 21314611.
47. Verma MK, Miki Y, Sasano H (2011) Sex steroid receptors in human lung diseases. J Steroid Biochem Mol Biol 127: 216-222. doi:10.1016/ j.jsbmb.2011.07.013. PubMed: 21856418.
48. Brekman A, Singh KE, Polotskaia A, Kundu N, Bargonetti J (2011) A p53-independent role of Mdm2 in estrogen-mediated activation of breast cancer cell proliferation. Breast Cancer Res 13: R3. doi:10.1186/ bcr2955. PubMed: 21223569.
lymphoblastic leukemia. Blood 99: 3367-3375. doi:10.1182/ blood.V99.9.3367. PubMed: 11964305.
50. Hu W, Feng Z, Ma L, Wagner J, Rice JJ et al. (2007) A single nucleotide polymorphism in the MDM2 gene disrupts the oscillation of p53 and MDM2 levels in cells. Cancer Res 67: 2757-2765. doi: 10.1158/0008-5472.CAN-06-2656. PubMed: 17363597.
51. Petz LN, Ziegler YS, Schultz JR, Kim H, Kemper JK et al. (2004) Differential regulation of the human progesterone receptor gene through an estrogen response element half site and Sp1 sites. J
Steroid Biochem Mol Biol 88: 113-122. doi:10.1016/j.jsbmb. 2003.11.008. PubMed: 15084343.
52. Bond GL, Hirshfield KM, Kirchhoff T, Alexe G, Bond EE et al. (2006) MDM2 SNP309 accelerates tumor formation in a gender-specific and hormone-dependent manner. Cancer Res 66: 5104-5110. doi: 10.1158/0008-5472.CAN-06-0180. PubMed: 16707433.
53. Ioannidis JP, Patsopoulos NA, Evangelou E (2007) Uncertainty in heterogeneity estimates in meta-analyses. BMJ 335: 914-916. doi: 10.1136/bmj.39343.408449.80. PubMed: 17974687.
MDM2 SNP309 Polymorphism with Colorectal Cancer