www.biogeosciences.net/6/3017/2009/
© Author(s) 2009. This work is distributed under the Creative Commons Attribution 3.0 License.
Biogeosciences
Short scale (6 h) temporal variation of sinking fluxes of planktonic
and terrigeneous lipids at 200 m in the NW Mediterranean Sea
L. M´ejanelle1and J. Dachs2
1LOOB, UMR CNRS 7651, Avenue Fontaul´e, BP 44, 66650 Banyuls Sur Mer, France
2Department of Environmental Chemistry, IDAEA, CSIC, 18–24 C/Jordi Girona, 08034 Barcelona, Catalonia, Spain
Received: 13 May 2009 – Published in Biogeosciences Discuss.: 30 July 2009
Revised: 27 November 2009 – Accepted: 30 November 2009 – Published: 15 December 2009
Abstract.Drifting sediment trap measurements were carried
out at high temporal frequency in the northwestern Mediter-ranean Sea in the course of the DYNAPROC 2 campaign, during the transition between late summer to autumn con-ditions. Molecular biomarkers were analyzed in selected subsets of consecutive samples collected for 6 h at 200 m depth. Fluxes of n-alkanes, long-chain alkenones, sterols and steroid ketones show high variability between consecu-tive 6-h samples, comparable in range to seasonal variability.
n-Alkane export ranges from 1.4 to 29.7 µg m−2d−1, fluxes of C37 alkenones varies from 0 to 14.2 µg m−2d−1. Fluxes
of sterols, steroid ketones and C30 alkane diol respectively
range from 31 to 377, 2.2 to 46 and 0.3 to 9.3 µg m−2d−1. Biomarker flux ranges are coherent with the relatively low primary production and the low export ratio encountered dur-ing the study. Molecular characteristics of biomarker com-position is consistent with reworked algal and zooplanktonic organic matter. Lipid biomarker composition points to the dominance of haptophytes over dinoflagellates in the ex-ported material, and to a minor contribution of diatoms and eustigmatophytes. The intrusion of coastal water at the study site was recorded by an enhanced imprint of higher plantn -alkanes.
Two processes can be responsible for the pulses in biomarker flux: changes in the magnitude of particle flux (dry weight mass flux) and changes in the concentration of biomarkers in the particles.
Concurrent variability in fluxes, significant Pearson cor-relations between fluxes of biomarkers of haptophytes, di-noflagellates, eustigmatophytes, zooplankton activity and higher plants (alkenones, dinosterol, alkyl diols,
dehydroc-Correspondence to:L. M´ejanelle (laurence.mejanelle@obs-banyuls.fr)
holesterol, steroid ketones,p <0.01,n=31, suggest that the short term temporal variability of biomarker export fluxes de-pends primarily on the intensity of particle dry weight flux. Biomarker concentrations vary on a relatively narrower range than biomarker fluxes, indicating that changes in particle composition (due to degradation or change in source appor-tionment) has a weaker influence on flux variability. Thus, particle aggregation and sinking are key processes to explain the dynamic of biomarker export at a temporal scale of 6 h. None the less, abrupt changes of OC-normalized concentra-tions of biomarkers, in the time scale of 6 h, indicate that the exported particles composition also show short-time variabil-ity. Highest biomarker flux values recorded by the trap sam-ples from 27 to 29 September correspond to highest values of zooplankton biomass integrated between the surface and 200 m. The decrease in primary production after the Octo-ber wind events is echoed by minima in biomarker flux val-ues. Despite these correspondences, the coupling between primary production and biomarker export is complex.
1 Introduction
The fate of organic carbon produced by primary production is a central issue of the carbon cycle. The vertical export of biogenic particles results from biological production, ag-gregation, incorporation of ballast minerals, recycling in the surface ocean and vertical sinking. The flux of organic com-pounds mirror the interplay of these processes.
3018 L. M´ejanelle and J. Dachs: Short scale temporal variation of sinking fluxes forcing, phytoplanktonic, zooplanktonic and bacterial
com-munities as well as related changes in inorganic and organic characteristics of dissolved and particulate phases, including sinking particles (Andersen et al., 2009). The strategy of DYNAPROC 2 is based on high frequency observations at the late summer-fall transition, when water stratification is disrupted by wind events (Andersen et al., 2009). Many bi-ological processes show short-term variability, in particular day-night changes. However, to which degree this variability is transferred to the export of organic matter remains largely unknown. A previous work at the DYFAMED site during spring showed that lipid export variability over timescale of 4 hours was in the same range as seasonal variability (Goutx et al., 2000). Another study in a frontal system of the Alb-oran Sea showed differences between day and night fluxes of biomarkers less 50% (Tolosa et al., 2005). During DY-NAPROC 2, sinking particles were collected at 200 m by drifting sediment traps using a sampling frequency of 6 h. The export of organic carbon, organic nitrate, organic phos-phorus and lipid classes showed rapid changes over 6 h pe-riods and are discussed by Marty et al. (2009). Lipid class composition evolved from a dominance of glycolipids to a dominance of neutral lipids became along the sampling pe-riod, a pattern associated with an increasing importance of heterotrophs (Marty et al., 2009).
The present contribution assesses the export of molecu-lar biomarkers, aliphatic and steroidal alcohols, long-chain alkenones and hydrocarbons, in a selected number of the drifting trap series of samples. Some molecular biomarkers can be related to a specific phytoplanctonic, zooplanktonic or terrigeneous sources, and inform on the changes in the contribution of the related sources to the exported material, Vertical fluxes of are determined to explore the evolution of the contribution of each respective source to the exported ma-terial, which complements the general information borne by lipid classes.
At different time scales than that of the present study, sediment traps time-course surveys have showed that phy-toplanktonic biomarkers recorded seasonal changes in pri-mary productivity and in the phytoplanktonic community, in particular at the study site (Marty et al., 1994; Wakeham et al., 2002, 2009; Sicre et al., 1999). The molecular compo-sition of lipid biomarkers of sinking particles also informs on the freshness or degraded state of the organic matter and on contamination events (Matsueda and Handa, 1986; Wake-ham and Lee, 1989; WakeWake-ham and Beir, 1991; Burns et al., 2001, 2003; Christodoulou et al., 2009).
Eventhough some biomarkers can be ascribed to a specific sources, others are contributed by several organisms, known or not. Ecological information determined in the frame of the DYNAPROC 2 program helps implementing the signifi-cance of biomarker profiles. Environmental parameters doc-umented by the program also facilitate exploring the drivers of high frequency temporal variability of fluxes.
2 Material and methods
2.1 Cruise track and sample collection
The DYNAPROC2 cruise took place between the 13 Septem-ber and 17 OctoSeptem-ber 2004 in the Northwestern Mediteranean Sea, 28 miles offshore from Nice (France) (Andersen et al., 2009). The sampling zone was a grid of 16 stations de-fined by the crosses in Fig. 1, at the vicinity of the French JGOFS Station DYFAMED (43◦25′N, 7◦52′E). Sinking par-ticles were collected using Technicap PPS5 sediment traps (1 m2 collecting area) drifting at 200 m depth. Traps were
allowed to drift in this area while other sampling opera-tions took place. When traps occasionally drifted out of this zone, they were retrieved and replaced at the original site. Carousels of 24 collecting cups were programmed with a 6 h-time resolution. Four series of samples were collected: the A series from 17 to 22 September, the B series from 23 to 29 September, the C series from 3 to 8 October and the D series from 10 to 15 October; their mooring and recov-ering positions are given in Table 1. Before mooring, col-lecting cups were poisoned by a 2% buffered formalin solu-tion made with filtered seawater. Upon trap recovery, swim-mers were removed and the collected material was split us-ing a wet suspension divider. One tenth of the samples was dedicated to this study and kept frozen until analysis. The other fractions were dedicated to bulk analyses (2/10th), pig-ment (2/10th) and lipid class analyses (1/10th) and the results are reported and discussed in detail by Marty et al. (2009). Four other fractions were dedicated to mass flux and col-ored matter analyses, but these results could not be suc-cessfully acquired due to the low levels of material avail-able. The accuracy of sample splitting is demonstrated by the reproducible trends in sterols fluxes measured by two distinct methods on one tenth of the sample, by Iatroscan (Marty et al., 2009) and by GC/FID (Fig. S1, Supplementary material, see: http://www.biogeosciences.net/6/3017/2009/ bg-6-3017-2009-supplement.pdf).
2.2 Lipid extraction, separation, and analysis
The supernatant of sediment trap samples were shown to con-tain lipidic compounds accounting for 15 to 75% of the to-tal trap material when the collection time was in the order of weeks to one month (K¨ortzinger et al., 1994). In colder waters, the dissolution of fatty acids into the dissolved super-natant of the trap collecting cups still accounted for half of the flux (Budge and Parrish, 1998). Beside organics, about 30% of inorganic phosphorus was also reported to occur in sediment trap supernatant (O’Neill et al., 2005). A challenge of the present study was the small sample size: one tenth of 6 h-collection of sinking particles in a low productivity area. To maximize the recovery of lipids from the trap material, the extraction procedure was set to recover the lipids from the particles and from the supernatant of the trap, as well
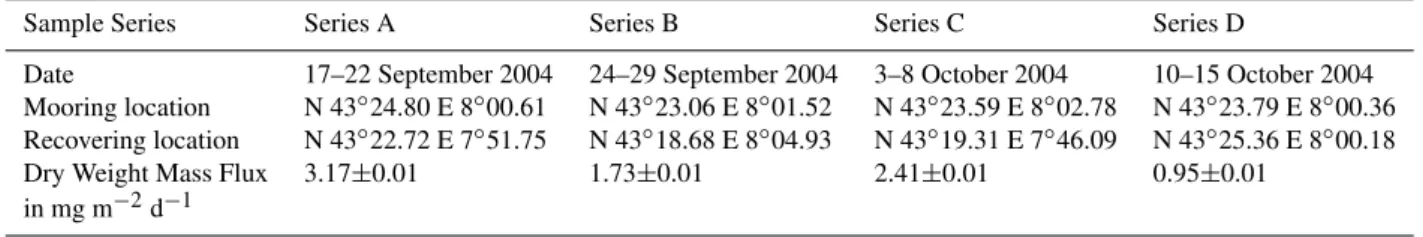
Table 1.Dates and positions (mooring and recovering) of drifting sediment traps. For each series, dry weight mass flux was measured for a composite sample in which all the samples of the series were pooled. The mass flux is given with the absolute accuracy of the measurement,
0.01 mg m−2d−1.
Sample Series Series A Series B Series C Series D
Date 17–22 September 2004 24–29 September 2004 3–8 October 2004 10–15 October 2004
Mooring location N 43◦24.80 E 8◦00.61 N 43◦23.06 E 8◦01.52 N 43◦23.59 E 8◦02.78 N 43◦23.79 E 8◦00.36
Recovering location N 43◦22.72 E 7◦51.75 N 43◦18.68 E 8◦04.93 N 43◦19.31 E 7◦46.09 N 43◦25.36 E 8◦00.18
Dry Weight Mass Flux 3.17±0.01 1.73±0.01 2.41±0.01 0.95±0.01
in mg m−2d−1
as lipids that may leach during freezing and thawing. After thawing, the samples were centrifuged and the water phase was extracted by liquid liquid extraction using CH2Cl2. The
obtained solution was used to extract the particles according to a modified Bligh and Dyer (1959) method where CH2Cl2
replaced CH3Cl3. Known amounts of surrogates were added
to the samples prior extraction: C24D50, C21-OH and
an-drostanol were used as surrogates for hydrocarbons, alkanols and sterols, respectively. Particles were extracted by 15 min-utes of contact in a CH2Cl2-H2O-CH3OH solution (1/0.8/2;
v/v/v) and the liquid phase was pipetted out after 5 min of centrifugation. Two other extractions were carried out by sonication for 15 min in the solvent mixture and all the liquid phases were combined into a decantation flask. After adding H2O and CH2Cl2to reach the proportions where two phases
appear, the phases were shaken and allowed to decant for 30 min. The organic phase was collected, and the aqueous phase was rinsed twice with 20 ml of CH2Cl2. All combined
organic extracts were dried overnight over MgSO4, filtered
and reduced by rota-evaporation. Total lipids were separated into various lipid classes using SEP-PACK Si-NH2 glass cartridges purchased from Macherey Nagel. The method was adapted from Hinrichs et al. (2000) and the recovery of the selected lipid classes was validated using standards (C24D50C36H74and squalene for hydrocarbons; a previously
analyzed fraction of long chain alkenones for ketones; C21
-OH, androstanol, coprostanol, cholesterol and lanosterol for alcohols; the quantities were in the upper range of those oc-curring in the samples). The cartridge was conditioned by 10 ml of hexane and the sample was spotted on its top in 150 µl of heptane. The first fraction was eluted by another 3.850 ml of hexane and contained the hydrocarbons. The sec-ond fraction, comprising long-chain alkenones was eluted by 6 ml of hexane/CH2Cl2 (3:1, v/v). The third fraction was
eluted by 5 ml CH2Cl2/aceton (9:1, v/v) and contained n
-alkanols, sterols, n-alkyl diols and hydroxy-ketones. The fractions were reduced by rota-evaporation and transferred to vials for gas chromatography analysis.
The hydrocarbons were analyzed using a Hewlett-Packard HP5890 gas chromatograph (GC) and a JW DB5 (Chrompack) column (50 m, 0.32 mm internal diameter,
stations. 821
822
Fig. 1. Location of sampling site (red star) and grid of stations (blue crosses) of the DYNAPROC 2 cruise. The DYFAMED site is located on the low left angle of the grid of DYNAPROC 2 sampling stations.
0.25 µm film thickness). The oven temperature was pro-grammed to rise from 60◦C to 100◦C at 25◦C min−1, then to 310◦C at 2◦C min−1(80 min hold time). The injector was an on-column injector programmed on the oven track mode, the detector temperature was 330◦C and the carrier gas was Helium set at a pressure of 1.1 bar.
3020 L. M´ejanelle and J. Dachs: Short scale temporal variation of sinking fluxes and helium was used as carrier gas at a pressure of 0.98 bar.
Prior to analyses, a known amount of C36H74 was added as
injection standard to the fractions.
Alcohols were transformed into the corresponding trimethylsilyl ether derivatives (TMS) using a mix-ture of bis (trimethylsilyl)-trifluoroacetamide and trimethylchlorosilane (99:1, Silyl-99) purchased from Macherey-Nagel (Germany) and pyridine during 60 min at 80◦C. TMS of alcohols were analyzed on a non-polar column (JW DB5, 30 m, 0.32 mm internal diameter, 0.25 µm film thickness) and an Agilent 6890N chro-matograph, using the following oven temperature program: 60◦(1 min)/25◦min−1/100◦/15◦min−1/150◦/3◦min−1/300◦ (>60 min). The GC was equipped with an on-column in-jector programmed to track the oven temperature and a FID detector at 320◦C and helium was used as carrier gas at a pressure of 0.8 bar.
GC coupled to mass spectrometry (MS) and co-injection with authentic compounds of known structures confirmed the identities of the major components. GC/MS analysis of lipids was performed on an Agilent 6890 GC coupled to an Agilent 5973 quadrupole mass spectrometer. The GC was equipped with an on-column injector programmed on the oven track mode, a JW DB5-MS column (0.25 mm internal diameter, 0.25 µm film thickness) and the carrier gas was helium with a flow of 1.2 ml min−1. The interface temperature was 280◦C. MS operating conditions were: ion source temperature of 230◦C, quadrupole temperature 150◦C, electron impact en-ergy of 70 eV, the scanned mass range was 40–600 atomic mass units at 0.6 scan s−1. The chromatographic columns used were DB5 with oven programs as previously described. The quantification of hydrocarbons and sterols was carried out using the surrogates used as internal standards. Long-chain ketones were quantified using the injection standard.
The formalin solution used to poison the traps was ana-lyzed using the same procedure as the samples to estimate whether it contributed targeted compounds to crude extracts of samples.
2.3 Hydrocarbon and sterol nomenclature
The nomenclature used to design hydrocarbons is Cxfor
sat-urated aliphatic homologues, where x is the number of car-bon of the aliphatic chain, and Cx:yfor unsaturated
hydrocar-bons, y being the number of double bonds. n-Alkanols are designed Cx-OH, x is the number of carbon of the aliphatic
chain. The nomenclature used to design sterols is used for the graphics only and is detailed in the first figure’s legend where they appear.
The carbon preference index (CPI) ofn-alkanes is calcu-lated as:
CPI24−34=
1 2×
(C25+C27+C29+C31+C33) (C24+C26+C28+C30+C32)
+(C25+C27+C29+C31+C33) (C26+C28+C30+C32+C34)
.
2.4 Statistical analyses
Pearson correlations between data were computed using SPSS® Software version 17.0.
3 Physical and biological environment
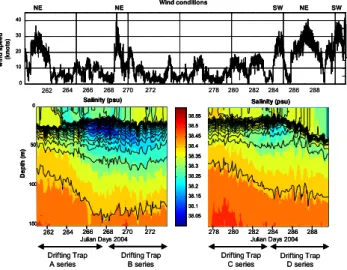
Characteristic hydrological and meteorological conditions of the cruise are detailed in Andersen et al. (2009). Briefly, the hydrological conditions are typical of late summer sit-uation with a stratified water column and the location of the thermocline at 25 m depth, with surface temperatures above 20◦C (up to 22◦C during calm periods). The meteorologi-cal regime is characterized by the alternation of strong wind events and calm periods. Two NE wind events occur during the collection of trap series A and B (Fig. 2) and it rained sig-nificantly before the start of the cruise and during the wind events. An intrusion of low salinity (<38.3 PSU) coastal ter is evidenced between 15 and 75 m depth while the wa-ter column remains stratified (Fig. 2; Andersen et al., 2009). Intrusion of coastal water shows that the central part of the Ligurian Sea is susceptible to receive local lateral advection (Stewart et al., 2007). A succession of wind events from SW, NE and SW directions occurs between 11 and 16 October, at the end of the collection of the trap series C and D (se-ries sampled from 3 to 15 October). As a consequence, the thermocline deepens to 40 m depth and the mixed layer cools down to 16◦C. This destratification suggests that the transi-tion from late summer to autumnal conditransi-tion is initiated at the end of the cruise. A second intrusion of low salinity wa-ter is recorded at the study site between 9 and 11 October, less in intensity than the previous similar event (Fig. 2).
Pigments analyses showed that phytoplankton is domi-nated by pico- and nano-autotrophs (around 87%, Marty et al., 2008). Microphytoplankton is dominated by dinoflag-ellates while senescent diatoms are present at subsurface at the beginning of the cruise and around 5 October (Marty et al., 2008; Lasternas et al., 2008). Primary production varies between 97 and 310 mgC m−212 h−1, which is con-sistent with the oligotrophic character of the area in late sum-mer (Marty et al., 2009). Integrated chlorophylla however showed higher values (20 to 40 mg m−2)than those typical of
this time of the year at the beginning of the cruise, in associ-ation with the occurrence of senescent diatoms at subsurface (Marty et al., 2008). Zooplankton was dominated by cope-pods from 17 to 30 September, whereas their contribution slightly decreased in October in favor of other predators like Pteropods and other carnivorous predators (Mousseau et al., 2009; Raybaud et al., 2009).
4 Results
Five groups of consecutive samples were selected for the present study on the basis of visual examination of the
Drifting Trap A series Drifting Trap B series Drifting Trap C series Drifting Trap D series Wind conditions w in d sp ee d (k not s) 10 20 30 40 0
NE NE SW NE SW
De p th (m ) 0 50 100 150 26.7 26.8 26.9 27.2 28.5 28.8 28.9 29 26.7 26.8 26.9 27.2 28.5 28.8 28.9 29 26.7 26.8 26.9 27.2 28.5 28.8 28.9 29 26.7 26.8 26.9 27.2 28.5 28.8 28.9 29 26.7 26.8 26.9 27.2 28.5 28.8 28.9 29 26.7 26.8 26.9 27.2 28.5 28.8 28.9 29 Salinity (psu) 27.1 27 27 27.4 27.7 28.8 28.9 29 27.1 27 27 27.4 28.8 28.9 29 27.1 27 27 27.4 28.8 28.9 29 27.1 27 27 27.4 28.8 28.9 29 27.1 27 27 27.4 27.7 28.8 28.9 29 27.1 27 27 27.4 27.7 28.8 28.9 29 38.05 38.1 38.15 38.2 38.25 38.3 38.35 38.4 38.45 38.5 38.55 Salinity (psu)
262 264 266 268 270 272 278 280 282 284 286 288
Julian Days 2004 Julian Days 2004
262 264 266 268 270 272 278 280 282 284 286 288
Drifting Trap A series Drifting Trap B series Drifting Trap C series Drifting Trap D series Wind conditions w in d sp ee d (k not s) 10 20 30 40 0 10 20 30 40 0 0
NE NE SW NE SW
De p th (m ) 0 50 100 150 26.7 26.8 26.9 27.2 28.5 28.8 28.9 29 26.7 26.8 26.9 27.2 28.5 28.8 28.9 29 26.7 26.8 26.9 27.2 28.5 28.8 28.9 29 26.7 26.8 26.9 27.2 28.5 28.8 28.9 29 26.7 26.8 26.9 27.2 28.5 28.8 28.9 29 26.7 26.8 26.9 27.2 28.5 28.8 28.9 29 Salinity (psu) 27.1 27 27 27.4 27.7 28.8 28.9 29 27.1 27 27 27.4 28.8 28.9 29 27.1 27 27 27.4 28.8 28.9 29 27.1 27 27 27.4 28.8 28.9 29 27.1 27 27 27.4 27.7 28.8 28.9 29 27.1 27 27 27.4 27.7 28.8 28.9 29 38.05 38.1 38.15 38.2 38.25 38.3 38.35 38.4 38.45 38.5 38.55 Salinity (psu)
262 264 266 268 270 272 278 280 282 284 286 288
Julian Days 2004 Julian Days 2004
De p th (m ) 0 50 100 150 26.7 26.8 26.9 27.2 28.5 28.8 28.9 29 26.7 26.8 26.9 27.2 28.5 28.8 28.9 29 26.7 26.8 26.9 27.2 28.5 28.8 28.9 29 26.7 26.8 26.9 27.2 28.5 28.8 28.9 29 26.7 26.8 26.9 27.2 28.5 28.8 28.9 29 26.7 26.8 26.9 27.2 28.5 28.8 28.9 29 0 50 100 150 26.7 26.8 26.9 27.2 28.5 28.8 28.9 29 26.7 26.8 26.9 27.2 28.5 28.8 28.9 29 26.7 26.8 26.9 27.2 28.5 28.8 28.9 29 26.7 26.8 26.9 27.2 28.5 28.8 28.9 29 26.7 26.8 26.9 27.2 28.5 28.8 28.9 29 26.7 26.8 26.9 27.2 28.5 28.8 28.9 29 26.7 26.8 26.9 27.2 28.5 28.8 28.9 29 26.7 26.8 26.9 27.2 28.5 28.8 28.9 29 26.7 26.8 26.9 27.2 28.5 28.8 28.9 29 26.7 26.8 26.9 27.2 28.5 28.8 28.9 29 26.7 26.8 26.9 27.2 28.5 28.8 28.9 29 26.7 26.8 26.9 27.2 28.5 28.8 28.9 29 26.7 26.8 26.9 27.2 28.5 28.8 28.9 29 26.7 26.8 26.9 27.2 28.5 28.8 28.9 29 26.7 26.8 26.9 27.2 28.5 28.8 28.9 29 26.7 26.8 26.9 27.2 28.5 28.8 28.9 29 26.7 26.8 26.9 27.2 28.5 28.8 28.9 29 26.7 26.8 26.9 27.2 28.5 28.8 28.9 29 Salinity (psu) 27.1 27 27 27.4 27.7 28.8 28.9 29 27.1 27 27 27.4 28.8 28.9 29 27.1 27 27 27.4 28.8 28.9 29 27.1 27 27 27.4 28.8 28.9 29 27.1 27 27 27.4 27.7 28.8 28.9 29 27.1 27 27 27.4 27.7 28.8 28.9 29 27.1 27 27 27.4 27.7 28.8 28.9 29 27.1 27 27 27.4 28.8 28.9 29 27.1 27 27 27.4 28.8 28.9 29 27.1 27 27 27.4 28.8 28.9 29 27.1 27 27 27.4 27.7 28.8 28.9 29 27.1 27 27 27.4 27.7 28.8 28.9 29 38.05 38.1 38.15 38.2 38.25 38.3 38.35 38.4 38.45 38.5 38.55 38.05 38.1 38.15 38.2 38.25 38.3 38.35 38.4 38.45 38.5 38.55 Salinity (psu)
262 264 266 268 270 272 278 280 282 284 286 288
Julian Days 2004 Julian Days 2004
262 264 266 268 270 272 278 280 282 284 286 288
Fig. 2. Upper panel: time series wind conditions during DY-NAPROC 2. Wind speed is plotted in knots and wind direction is given above the panel. Lower panel: time-series salinity profiles. The blue color shows the intrusions of low salinity waters at the study site.
samples. The first part of the A series (17 and 18 Septem-ber) and the samples from the D series (12 and 13 OctoSeptem-ber) showed few visible particles whereas particles could easily be observed in the other groups of consecutive samples from the A, B and C series.
4.1 Hydrocarbons
The formalin solution used to preserve the samples con-tributed some dissolved hydrocarbons in negligible quanti-ties except for C19 and C23 n-alkanes; therefore both
alka-nes are not reported here. Total hydrocarbon fluxes de-scribe ample variations between 1.4 and 29.7 µg m−2d−1 without clear day-night periodicity (Fig. 3). Hydrocarbon composition and fluxes are reported in the Supplementary Material (Table S1, see: http://www.biogeosciences.net/6/ 3017/2009/bg-6-3017-2009-supplement.pdf). They encom-pass n-alkanes in the C12-C37 range with an even
pre-dominance from C12 to C26 and an odd predominance for
the C27-C36 homologues. The even predominance of low
molecular weightn-alkanes is an unusual profile, reported in other few situations. For instance, C16, C18 and C20
also dominated hydrocarbons in sinking particles from the Western Mediterranean Sea and from the Laurentian Great Lakes (Dachs et al., 1998; Parrish et al., 1992). Odd alka-nes also characterized sediment trap material collected in the Mediterranean Sea, together with a high abundance of methylalkanes and diploptene, and were associated to the contribution of cyanobacteria (Dachs et al., 1998). The occurrence of alkanes with even carbon number has also been related to bacterial reworking of organic matter (Gri-malt and Albaig´es, 1988). In the present report, diplotene
is a minor compound and methylalkanes could not be de-tected. Other hydrocarbons detected in the samples have an algal origin: C15, C17 (Clark and Blumer, 1967),
pris-tane, lycopane (Sinninghe Damst´e et al., 1993) as well as C37:2 and C37:3 synthesized by alkenone-producing
hap-tophytes (Volkman et al., 1980). These phytoplanktonic biomarkers occur in low percentages (Supplementary mate-rial, Table S1, see: http://www.biogeosciences.net/6/3017/ 2009/bg-6-3017-2009-supplement.pdf). At the same study site, a high flux event was recorded at 200 m in April 1987 and C17 was the dominant n-alkanes (20%, Marty et al.,
1994). In comparison, C17 abundances measured in the
present time series samples are lower (0.8 to 5.2% of hy-drocarbons, Supplementary material, Table S1), which indi-cates that fresh phytoplanktonic inputs did not dominate the sinking material or that there was an efficient degradation of low MW alkanes during sinking. The relative contribu-tion of C17 ton-alkanes peaks at the beginning of the D
se-ries, on the night of 12 to 13 October, while the D series corresponds to weak fluxes. Odd-chain alkenes in the C15
-C19 range and C21:6 are phytoplanktonic biomarkers
com-monly found in sinking particles rich in fresh phytoplank-tonic residues (Burns et al., 2003) and they are rapidly de-graded during particle decay (Matsueda and Handa, 1986). None of these indicators for fresh algal residue could be de-tected in sinking particles collected during DYNAPROC 2 cruise.
No unresolved hydrocarbon mixture, sourced by petroleum contamination, could be evidenced, nor hopanes nor steranes; however the detection of the humps and of petroleum biomarkers on the chromatograms may have been impeded by the low quantities of material analyzed.
A moderate odd-to-even carbon number predominance or an even preference characterizes C24 to C34 n-alkanes
in samples where long-chainn-alkanes fluxes showed low-est contribution (Fig. 4). In contrast, the samples with a clear odd predominance of long-chainn-alkanes correspond to maxima in C25-C37oddn-alkanes fluxes (>2 µg m−2d−1).
This signature is characteristic of terrestrial higher plants (Eglinton and Hamilton, 1967) whereas lower CPI values point to petroleum or marine organism inputs (Davis, 1968; Han and Calvin, 1969; Cripps 1990).
The hydrocarbons which relative abundances show greater variations are squalene, squalane and long-chainn-alkanes. Squalene is likely contributed by zooplankton (Wakeham and Canuel, 1986, 1988). Its observed variation trend is quite er-ratic with increases and decreases up to 5 folds in consec-utives 6 h-samples. Moreover, maxima occurred during the day as well as at night.
4.2 Long-chain alkenones
C37 and C38 unsaturated methyl and ethyl alkenones are
3022 L. M ´ejanelle and J. Dachs: Short scale temporal v ariation of sinking flux es
A s
e
rie
s
B
s
e
ries
C s
e
ries
D s
e
ries
0200 400 600
08 - 14 H 14 - 20 H 20 - 02 H 02 - 08 H 08 - 14 H 14 - 20 H 20 - 02 H 02 - 08 H 08 - 14 H 14 - 20 H 20 - 02 H 02 - 08 H 08 - 14 H 14 - 20 H 20 - 02 H 02 - 08 H 08 - 14 H 14 - 20 H 20 - 02 H 02 - 08 H
14 - 20 H 20 - 02 H 02 - 08 H 08 - 14 H 14 - 20 H 20 - 02 H 02 - 08 H 08 - 14 H 14 - 20 H 20 - 02 H 02 - 08 H 08 - 14 H 14 - 20 H 20 - 02 H 02 - 08 H 08 - 14 H 14 - 20 H 20 - 02 H 02 - 08 H 08 - 14 H
14 - 20 H 20 - 02 H 02 - 08 H 08 - 14 H 14 - 20 H 20 - 02 H 02 - 08 H 08 - 14 H 14 - 20 H 20 - 02 H 02 - 08 H 08 - 14 H 14 - 20 H 20 - 02 H 02 - 08 H 08 - 14 H 14 - 20 H 20 - 02 H 02-08h 08-14h
14 - 20 H 20 - 02 H 02 - 08 H 08 - 14 H 14 - 20 H 20 - 02 H 02 - 08 H 08 - 14 H 14 - 20 H 20 - 02 H 02 - 08 H 08 - 14 H 14 - 20 H 20 - 02 H 02 - 08 H 08 - 14 H 14 - 20 H 20 - 02 H 02 - 08 H 08 - 14 H
1 7 18 19 2 0 21 2 2 24 25 26 2 7 28 29 3 4 5 6 7 8 10 1 1 12 13 14 15
0 10 20 30 40
OC flux (mM m-2d-1)
Ste rol flu x Alk enon ef lu x HC f lu x ( μ g m -2 d -1 ) S e pt em ber 2004 O c to ber 2004
A s
e
rie
s
B
s
e
ries
C s
e
ries
D s
e
ries
0200 400 600
08 - 14 H 14 - 20 H 20 - 02 H 02 - 08 H 08 - 14 H 14 - 20 H 20 - 02 H 02 - 08 H 08 - 14 H 14 - 20 H 20 - 02 H 02 - 08 H 08 - 14 H 14 - 20 H 20 - 02 H 02 - 08 H 08 - 14 H 14 - 20 H 20 - 02 H 02 - 08 H
14 - 20 H 20 - 02 H 02 - 08 H 08 - 14 H 14 - 20 H 20 - 02 H 02 - 08 H 08 - 14 H 14 - 20 H 20 - 02 H 02 - 08 H 08 - 14 H 14 - 20 H 20 - 02 H 02 - 08 H 08 - 14 H 14 - 20 H 20 - 02 H 02 - 08 H 08 - 14 H
14 - 20 H 20 - 02 H 02 - 08 H 08 - 14 H 14 - 20 H 20 - 02 H 02 - 08 H 08 - 14 H 14 - 20 H 20 - 02 H 02 - 08 H 08 - 14 H 14 - 20 H 20 - 02 H 02 - 08 H 08 - 14 H 14 - 20 H 20 - 02 H 02-08h 08-14h
14 - 20 H 20 - 02 H 02 - 08 H 08 - 14 H 14 - 20 H 20 - 02 H 02 - 08 H 08 - 14 H 14 - 20 H 20 - 02 H 02 - 08 H 08 - 14 H 14 - 20 H 20 - 02 H 02 - 08 H 08 - 14 H 14 - 20 H 20 - 02 H 02 - 08 H 08 - 14 H
1 7 18 19 2 0 21 2 2 24 25 26 2 7 28 29 3 4 5 6 7 8 10 1 1 12 13 14 15
0 10 20 30 40
OC flux (mM m-2d-1)
Ste rol flu x Alk enon ef lu x HC f lu x ( μ g m -2 d -1 ) S e pt em ber 2004 O c to ber 2004 0
200 400 600
08 - 14 H 14 - 20 H 20 - 02 H 02 - 08 H 08 - 14 H 14 - 20 H 20 - 02 H 02 - 08 H 08 - 14 H 14 - 20 H 20 - 02 H 02 - 08 H 08 - 14 H 14 - 20 H 20 - 02 H 02 - 08 H 08 - 14 H 14 - 20 H 20 - 02 H 02 - 08 H
14 - 20 H 20 - 02 H 02 - 08 H 08 - 14 H 14 - 20 H 20 - 02 H 02 - 08 H 08 - 14 H 14 - 20 H 20 - 02 H 02 - 08 H 08 - 14 H 14 - 20 H 20 - 02 H 02 - 08 H 08 - 14 H 14 - 20 H 20 - 02 H 02 - 08 H 08 - 14 H
14 - 20 H 20 - 02 H 02 - 08 H 08 - 14 H 14 - 20 H 20 - 02 H 02 - 08 H 08 - 14 H 14 - 20 H 20 - 02 H 02 - 08 H 08 - 14 H 14 - 20 H 20 - 02 H 02 - 08 H 08 - 14 H 14 - 20 H 20 - 02 H 02-08h 08-14h
14 - 20 H 20 - 02 H 02 - 08 H 08 - 14 H 14 - 20 H 20 - 02 H 02 - 08 H 08 - 14 H 14 - 20 H 20 - 02 H 02 - 08 H 08 - 14 H 14 - 20 H 20 - 02 H 02 - 08 H 08 - 14 H 14 - 20 H 20 - 02 H 02 - 08 H 08 - 14 H
1 7 18 19 2 0 21 2 2 24 25 26 2 7 28 29 3 4 5 6 7 8 10 1 1 12 13 14 15
0 10 20 30 40
0
200 400 600
08 - 14 H 14 - 20 H 20 - 02 H 02 - 08 H 08 - 14 H 14 - 20 H 20 - 02 H 02 - 08 H 08 - 14 H 14 - 20 H 20 - 02 H 02 - 08 H 08 - 14 H 14 - 20 H 20 - 02 H 02 - 08 H 08 - 14 H 14 - 20 H 20 - 02 H 02 - 08 H
14 - 20 H 20 - 02 H 02 - 08 H 08 - 14 H 14 - 20 H 20 - 02 H 02 - 08 H 08 - 14 H 14 - 20 H 20 - 02 H 02 - 08 H 08 - 14 H 14 - 20 H 20 - 02 H 02 - 08 H 08 - 14 H 14 - 20 H 20 - 02 H 02 - 08 H 08 - 14 H
14 - 20 H 20 - 02 H 02 - 08 H 08 - 14 H 14 - 20 H 20 - 02 H 02 - 08 H 08 - 14 H 14 - 20 H 20 - 02 H 02 - 08 H 08 - 14 H 14 - 20 H 20 - 02 H 02 - 08 H 08 - 14 H 14 - 20 H 20 - 02 H 02-08h 08-14h
14 - 20 H 20 - 02 H 02 - 08 H 08 - 14 H 14 - 20 H 20 - 02 H 02 - 08 H 08 - 14 H 14 - 20 H 20 - 02 H 02 - 08 H 08 - 14 H 14 - 20 H 20 - 02 H 02 - 08 H 08 - 14 H 14 - 20 H 20 - 02 H 02 - 08 H 08 - 14 H
1 7 18 19 2 0 21 2 2 24 25 26 2 7 28 29 3 4 5 6 7 8 10 1 1 12 13 14 15
0 10 20 30 40
OC flux (mM m-2d-1)
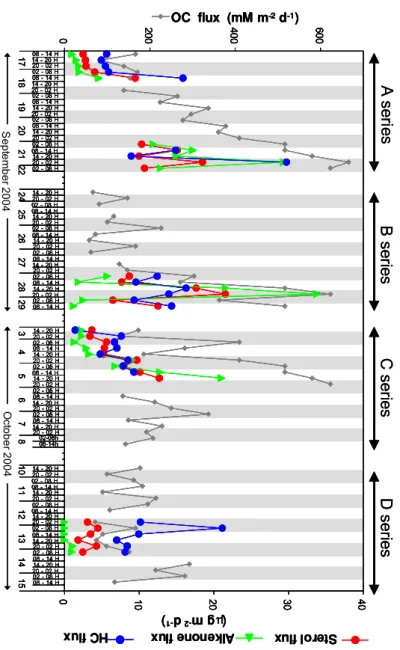
Ste rol flu x Alk enon ef lu x HC f lu x ( μ g m -2 d -1 ) S e pt em ber 2004 O c to ber 2004 Fig . 3 . Flux es of or g anic carbon and flux es of sterols, alk enones and h ydrocarbons measured at 200 m during D YN APR OC 2. Or g anic carbon data ar e from Marty et al., 2009. Gr ey filling indicate night-time collection of particles. The x axis represents time of particles collection and is discontinuous.
D
ser ies A se ri e s B s e ri e s C s e ri e sFluxes of odd alkanes≥C25 (μg m-2d-1)
Flu xes o f C 22-C 26-OH (μg m -2 d -1 ) S ept em ber 2004 O c tober 2004
0 2 4 6 8
08-14 h 14-20 h 20-02 h 02-08 h 08-14 h 02-08 h 08-14 h 14-20 h 20-02 h 02-08 h 02-08 h 08-14 h 14-20 h 20-02 h 02-08 h 08-14 h 14-20 h 20-02 h 02-08 h 08-14 h 14-20 h 20-02 h 02-08 h 08-14 h 14-20 h 20-02 h 02-08 h 08-14 h 14-20 h 20-02 h 02-08 h 17 18 21 22 28 29 3 4 5 12 13 14
0 1 2 3 4
CPI24-34
D
ser ies A se ri e s B s e ri e s C s e ri e sFluxes of odd alkanes≥C25 (μg m-2d-1)
Flu xes o f C 22-C 26-OH (μg m -2 d -1 ) S ept em ber 2004 O c tober 2004
0 2 4 6 8
08-14 h 14-20 h 20-02 h 02-08 h 08-14 h 02-08 h 08-14 h 14-20 h 20-02 h 02-08 h 02-08 h 08-14 h 14-20 h 20-02 h 02-08 h 08-14 h 14-20 h 20-02 h 02-08 h 08-14 h 14-20 h 20-02 h 02-08 h 08-14 h 14-20 h 20-02 h 02-08 h 08-14 h 14-20 h 20-02 h 02-08 h 17 18 21 22 28 29 3 4 5 12 13 14
0 1 2 3 4
S ept em ber 2004 O c tober 2004
0 2 4 6 8
08-14 h 14-20 h 20-02 h 02-08 h 08-14 h 02-08 h 08-14 h 14-20 h 20-02 h 02-08 h 02-08 h 08-14 h 14-20 h 20-02 h 02-08 h 08-14 h 14-20 h 20-02 h 02-08 h 08-14 h 14-20 h 20-02 h 02-08 h 08-14 h 14-20 h 20-02 h 02-08 h 08-14 h 14-20 h 20-02 h 02-08 h 17 18 21 22 28 29 3 4 5 12 13 14
0 1 2 3 4
represents time of particles collection and is discontinuous.
September October
10 15 20 25
08-14 h
14-20 h
20-02 h
02-08 h
08-14 h
02-08 h
08-14 h
14-20 h
20-02 h
02-08 h
02-08 h
08-14 h
14-20 h
20-02 h
02-08 h
08-14 h
14-20 h
20-02 h
02-08 h
08-14 h
14-20 h
20-02 h
02-08 h
08-14 h
14-20 h
20-02 h
02-08 h
08-14 h
14-20 h
20-02 h
02-08 h
17 18 21 22 28 29 3 4 5 12 13 14
3m 10m 20m
30m 40m 50m
SST estimated from UK’37 Measured Temperature at various depths:
Tem
per
a
tu
re
i
n
°
C
September October
10 15 20 25
08-14 h
14-20 h
20-02 h
02-08 h
08-14 h
02-08 h
08-14 h
14-20 h
20-02 h
02-08 h
02-08 h
08-14 h
14-20 h
20-02 h
02-08 h
08-14 h
14-20 h
20-02 h
02-08 h
08-14 h
14-20 h
20-02 h
02-08 h
08-14 h
14-20 h
20-02 h
02-08 h
08-14 h
14-20 h
20-02 h
02-08 h
17 18 21 22 28 29 3 4 5 12 13 14
3m 10m 20m
30m 40m 50m
SST estimated from UK’37 Measured Temperature at various depths:
10 15 20 25
08-14 h
14-20 h
20-02 h
02-08 h
08-14 h
02-08 h
08-14 h
14-20 h
20-02 h
02-08 h
02-08 h
08-14 h
14-20 h
20-02 h
02-08 h
08-14 h
14-20 h
20-02 h
02-08 h
08-14 h
14-20 h
20-02 h
02-08 h
08-14 h
14-20 h
20-02 h
02-08 h
08-14 h
14-20 h
20-02 h
02-08 h
17 18 21 22 28 29 3 4 5 12 13 14
3m 10m 20m 20m
30m 40m 40m 50m 50m
SST estimated from UK’37 Measured Temperature at various depths:
Tem
per
a
tu
re
i
n
°
C
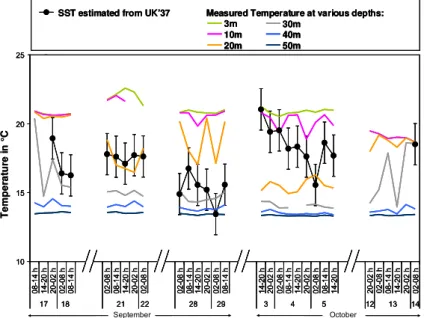
Fig. 5.Comparison of SST reconstructed using the alkenone unsaturation index UK′37and hydrocast temperatures at various depths. The x axis represents time of particles collection and is discontinuous.
Gephyrocapsa oceanica(Conte et al., 1992). They are un-equivocal biomarkers for haptophytes. They could be de-tected in most of the samples except for the D series (Sup-plementary material, Table S2). Fluxes of alkenone and alkenoates range from to 1.0 to 33.8 µg m−2d−1, and C37
alkenone fluxes 0.4 to 14.28 µg m−2d−1, with increases or decreases up to ten fold between consecutive 6 h-samples (Supplementary material, Table S2 and Fig. 3). The alkenone unsaturation index UK37′ , defined as UK′37=37:372+:237:3, is re-lated to the growth temperature of the alkenone producing haptophytes and is used to reconstruct sea surface temper-atures (SST) from UK′37 measured in old sediments (Prahl et al., 1988). SST estimates may be overestimated when the chromatographic peak of the methylalkenone C37:3is not
well above the noise or when the capillary column has been used for a while (Villanueva and Grimalt, 1996; Grimalt et al., 2001). For instance, we considered that a peak area of methylalkenone C37:3above 2500 mV s enables a proper
de-termination of UK′37. Two samples at the start of the A series and one at end of the D series, with lower peak areas, were discarded for the calculation of UK′37. SST estimates recon-structed using the Prahl et al. (1988)’s calibration varied be-tween 13 and 21◦C (Fig. 5). Reconstructed temperature es-timates are in the range of the CTD hydrocast temperatures from 20 to 30 m for the A and B series-samples (Fig. 5). They are higher for the C and D series samples and correspond to hydrocast temperature above 20 m (Fig. 5). The sample from the D series is collected after the mixing of the water column and alkenone composition may have adapted to the changing temperature. When the C series is collected, the water is still well stratified and the results rather suggest that haptophytes producing alkenones are situated slightly higher in the
wa-ter column. The depth of production of alkenones is in good agreement with that inferred from alkenones in suspended particles in November, whereas the depth of production of alkenones during spring and early summer is deeper (Ternois et al., 1997).
Alkenones and C37:3 and C38:3 homologous long-chain
alkenes show synchronous maxima in fluxes (Fig. S2 Sup-plementary material, see: http://www.biogeosciences.net/6/ 3017/2009/bg-6-3017-2009-supplement.pdf). The ratio of alkenones to homologous alkenes varies over one order of magnitude (Fig. S2 Supplementary material). The geochem-ical significance of this ratio is unknown at present. If long-chain alkenes are intermediates in the biosynthesis or the catabolism of alkenones, this ratio may be related to the physiological state of alkenone producers.
4.3 Alkanols, sterols and steroidal ketones
Alcohols constitute the most abundant of the targeted lipid classes with fluxes one order of magnitude above those of hydrocarbons and of long-chain alkenones (Fig. 3). The timing of sterol fluxes is similar to that of long chain alkenones (Fig. 3). Total sterol fluxes ranged from 31 to 377 µg m−2d−1, they are detailed in Table S2 of the
3024 L. M´ejanelle and J. Dachs: Short scale temporal variation of sinking fluxes determined in sediment traps from the same site between
March and June 2003, however with a noticeably higher contribution of 24-methylcholesta-5,22E-dien-3β-ol (Wake-ham et al., 2009).
4-Methylsterols having additional methyl groups substi-tuted at C23 or both at C23 and C24 were identified in the
sinking particles, with 4α,23,24-trimethylcholest-22-en-3β -ol (dinoster-ol) as the major hom-ologue (2.5±0.5% of to-tal sterols, Fig. S3 Supplementary material). Other sterols stemming from dinoflagellates are identified in the sink-ing particles. 23,24-Dimethylcholesta-5,22E-dien-3β-ol and its stanol counterpart contribute from 2.1 to 3.8% of total sterols, and 4α,24-dimethylcholestan-3β-ol occurs at trace levels.
C26Sterols having 27-noror 24-norstructures accounted
for a non negligible part (6.5 to 12.5%, Fig. S3 of Supplementary material) of total sterols, with 27-nor -24-methylcholesta-5,22E-dien-3β-ol ranking in the five more abundant sterols ( 4.7 to 8.7% of total sterols).
24-Methylcholesta-5,24(28)-dien-3β-ol, often used to fin-gerprint diatom occurrence, accounts for a few percent of to-tal sterols (Fig. S3). C29sterol with15,24(28) double bond
system is also identified in all trap samples in small amounts and is synthesized by Prasinophyceae, dinoflagellates and diatoms. Two isomers of 24-propylcholesta-5,24(28)-dien-3β-ol are identified in the sinking particles (Supplementary material, Table S3) and have been previously reported in Mediterranean samples, including in sediment trap from the study site (Tolosa et al., 2003; Christodoulou et al., 2009). Its biological precursor is yet unknown.
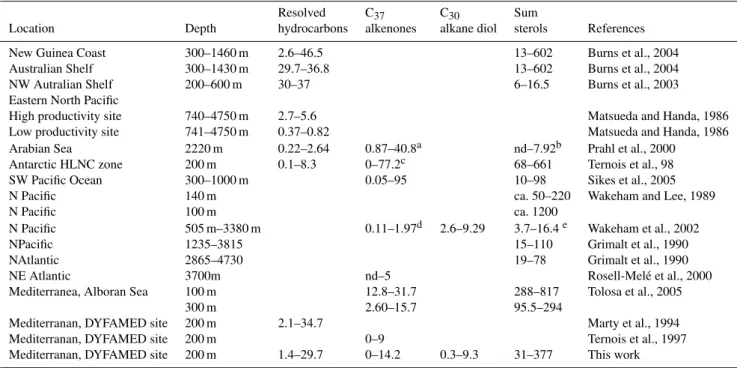
A series of steroid ketones was identified in the samples (Supplementary material, Table S2). 24-nor -cholesta-4,22E-dien-3-one, cholestanone and cholest-4-en-3-one were chro-matographically resolved from sterols whereas another iso-mer of cholestanone coeluted with 5α(H )-cholestan-3β -ol, and cholesta-4,22-dien-3-one occurred in a composite peak with 4-methylcholesta-24(25)-en-3β-ol in some sam-ples. Other steroid ketone with mass peak of 412 and 414 daltons eluted at the end of the elution time span of sterols. However, their poor peak shape and the mismatch between their retention time under GC and GC-MS conditions (con-stant gas pressure fit versus con(con-stant gas flow) made their quantification and their attribution tricky; therefore they were not further considered. Cholest-4-en-3-one was the dominant steroidal ketone and accounted for up to 19.5% of the com-pounds in the alcohol fraction, alike in sinking particles from various location (Wakeham and Canuel, 1986). The timing of its flux shares some similarities with that of sterols, with no obvious maxima at night (Fig. 6).
C30 mid-chain alkane diols and C30 hydroxy mid-chain
alkanone were detected in comparable amounts (Supplemen-tary material, Table S2). Eustigmatophytes are generally considered as the source of mid-chain hydroxy alkanols in marine sediments (Volkman et al., 1992; Gelin et al., 1997; Volkman et al., 1999; Versteegh et al., 2000).
High-molecular weightn-alkanols are indicative of terri-geneous higher plants and are little abundant in the present series of samples. Their flux pattern shows synchronous characteristics with that of long-chain n-alkanes, and lin-ear correlation between both biomarker groups explains 67% of their variability (Fig. 2). Long-chain n-alkane abun-dances accounted for two to four folds those of long-chain
n-alkanols except for the last series of samples where they reached 12 times long-chainn-alkanol abundances.
5 Discussion
5.1 Occurrence of lipidic biomarkers and nature of
ex-ported particles
The analysis of molecular biomarkers in one tenth of sed-iment trap material collected during 6 h in an oligotrophic area represented a challenge because of the low amounts of material. Hydrocarbons and sterols could be quantified in all studied samples, while alkenones could not be detected or inappropriately quantified in a few samples.
Steroid ketones occur in minor abundances in marine or-ganisms and are produced by microbial oxidation of sterol, for instance cholest-4-en-3-one is produced by degradation of cholest-5-en-3β-ol (Wakeham and Canuel, 1986, 1988; Burns et al., 2003). Their relative abundance in sediment trap tend to increase with depth (Wakeham and Lee, 1989; Burns et al., 2003). The ratio of 4-en-3-one to cholest-5-en-3β-ol in the sinking particles collected during DY-NAPROC 2 is in the upper range or higher than values mea-sured in sediment traps at the same site during spring bloom and post-bloom conditions (May–June, Christodoulou et al., 2009), suggesting a more intense reworking in the late sum-mer conditions. Pigments of sinking particles are character-ized by the dominance of phaeopigments over intact chloro-phylls, which also denotes that phytoplanktonic remains are degraded (Marty et al., 2009). The concurrent variation in fluxes of phaeopigments and molecular biomarkers suggests a common vector of transport, fecal pellets (Fig. S4 Sup-plementary material, see: http://www.biogeosciences.net/6/ 3017/2009/bg-6-3017-2009-supplement.pdf).
24-Ethylsterols are synthesized by higher plants and are possibly related to fluvial and aerosol inputs. No major rivers are located in the vicinity of the study site and the area of study is located in the central Ligurian Sea, where the Lig-urian current prevents inputs of coastal waters (B´ethoux and Prieur, 1983). However advective inputs occasionally oc-cur (Steward 2007), as evidenced by the intrusion of low salinity coastal waters during DYNAPROC 2 (Andersen et al., 2009). After the intrusion of coastal waters, a stronger higher plant imprint in n-alkanes indicates the incorpora-tion of terrigeneous material to the rain of particles (Fig. 2), whilst no increase in C29 sterol abundances was recorded.
Aerosols inputs are significant at the study site (Migon et al.,
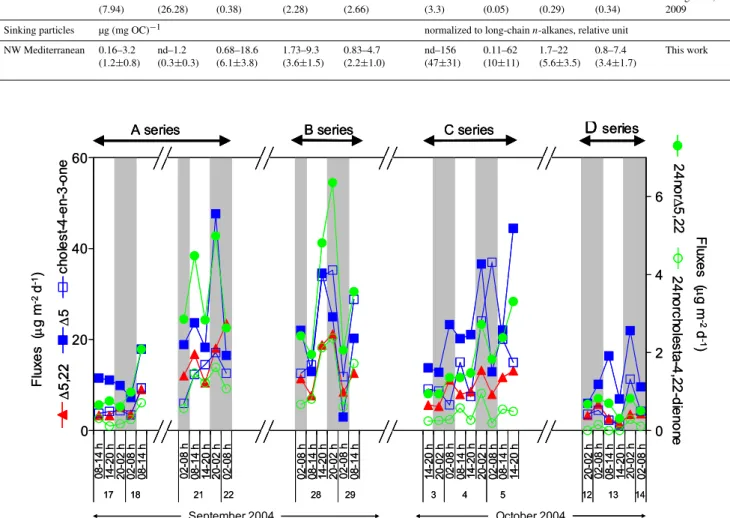
Table 2. Comparison of the abundance of C29sterols, of higher plantn-alkanes and of higher plantn-alkanols in aerosols and in sinking
particles collected during DYNAPROC 2. The left side of the table comprise concentrations, the right side of the table comprise abundance
of biomarkers normalized to the abundance of long-chainn-alkanes. Minima and maxima of the reported values are given on top lines
separated by a dash; average values and standard deviation, when available, are given in brackets on the second lines. nd stands for non
detected.asum ofn-alkanes, but they are mostly long-chain odd alkanes.bSum ofn-alkanols, but they are mostly long-chain even alkanols.
long-chain long-chain long-chain
Location n-alkanes n-alkanols 15 24Et15 24Et15,22E n-alkanols 15 24 Et15 24 Et15,22 E References
Marine aerosols ng m−3 normalized to long-chainn-alkanes, relative unit
Azores 0.3–6.18a 0.75–8.6b 0.002–0.209 0.01–0.139 2.5– 3.0 0.01–0.03 0.01–0.03 Alves et al.,
(1.11) (3.47) (3.1) 2007
North Pacific 0.11–4.1a 0.18–19.7 nd–0.89 nd–0.30 1.4–1.6 nd–0.06 nd–0.03 Kawamura et al.,
(1.8) (2.2) (0.053) (0.066) (1.2) (0.03) (0.04) 2003
Korea 2.31–14.0 3.38–53.2 nd–2.19 nd–11.4 nd–13.6 1–4 nd–0.16 nd–0.81 nd–0.97 Wang et al.,
(7.94) (26.28) (0.38) (2.28) (2.66) (3.3) (0.05) (0.29) (0.34) 2009
Sinking particles µg (mg OC)−1 normalized to long-chainn-alkanes, relative unit
NW Mediterranean 0.16–3.2 nd–1.2 0.68–18.6 1.73–9.3 0.83–4.7 nd–156 0.11–62 1.7–22 0.8–7.4 This work
(1.2±0.8) (0.3±0.3) (6.1±3.8) (3.6±1.5) (2.2±1.0) (47±31) (10±11) (5.6±3.5) (3.4±1.7)
Δ Δ
Δ β
24n
or
Δ
5,
2
2
24n
or
ch
ol
e
s
ta
-4
,2
2-di
en
on
e
September 2004 October 2004
A series B series C series
D
series0 20 40 60
08-1
4 h
14
-2
0 h
20
-0
2 h
02
-0
8 h
08
-1
4 h
02-0
8 h
08
-1
4 h
14
-2
0 h
20
-0
2 h
02
-0
8 h
02
-0
8 h
08
-1
4 h
14
-2
0 h
20
-0
2 h
02-0
8 h
08
-1
4 h
14
-2
0 h
20
-0
2 h
02-0
8 h
08
-1
4 h
14-2
0 h
20
-0
2 h
02
-0
8 h
08
-1
4 h
14
-2
0 h
20
-0
2 h
02-0
8 h
08
-1
4 h
14
-2
0 h
20-0
2 h
02
-0
8 h
17 18 21 22 28 29 3 4 5 12 13 14
0 2 4 6
Δ
5,
22
Δ
5
ch
ol
est
-4-en
-3
-o
n
e
Fl
u
x
es (
μ
g m
-2
d
-1)
Fl
u
x
es (
μ
g m
-2
d
-1
)
24n
or
Δ
5,
2
2
24n
or
ch
ol
e
s
ta
-4
,2
2-di
en
on
e
September 2004 October 2004
A series B series C series
D
seriesA series B series C series
D
series0 20 40 60
08-1
4 h
14
-2
0 h
20
-0
2 h
02
-0
8 h
08
-1
4 h
02-0
8 h
08
-1
4 h
14
-2
0 h
20
-0
2 h
02
-0
8 h
02
-0
8 h
08
-1
4 h
14
-2
0 h
20
-0
2 h
02-0
8 h
08
-1
4 h
14
-2
0 h
20
-0
2 h
02-0
8 h
08
-1
4 h
14-2
0 h
20
-0
2 h
02
-0
8 h
08
-1
4 h
14
-2
0 h
20
-0
2 h
02-0
8 h
08
-1
4 h
14
-2
0 h
20-0
2 h
02
-0
8 h
17 18 21 22 28 29 3 4 5 12 13 14
0 2 4 6
Δ
5,
22
Δ
5,
22
Δ
5
ch
ol
est
-4-en
-3
-o
n
e
Fl
u
x
es (
μ
g m
-2
d
-1)
Fl
u
x
es (
μ
g m
-2
d
-1
)
Fig. 6. Time series fluxes of selected zooplanktonic biomarkers and biomarkers of digestive oxidation. 15,22: dehydrocholesterol,15:
cholesterol and its oxidation product cholest-4-en-3-one, 24nor15,22: 24-nor-cholesta-5,22-dien-3β-ol and its oxidation product 24-nor
-cholesta-4,22-dien-3-one. The x axis on the lower panel is discontinuous. Grey filling indicate night-time collection of particles.
2001; Guieu et al., 2002) and constitute a potential source of C29 sterols. The ratio of terrigeneous alkanols,
cholest-5-en-3β-ol, 24-ethylcholest-5-en-3β-ol and 24-ethylcholest-5,22E-dien-3β-ol to terrigeneous alkanes in marine aerosols are reported in Table 2. In marine aerosols, the ratio of 24-ethylcholest-5-en-3β-ol to terrigeneous long-chainn-alkanes
takes values varying from 0.01 to 0.81, whereas the val-ues are one order of magnitude higher in sinking particles (5.6±3.5%). Similar behavior is observed for cholest-5-en-3β-ol and 24-ethylcholest-5,22E-dien-3β-ol. Consequently, aerosol inputs accounts only for a small portion of C29sterols
3026 L. M´ejanelle and J. Dachs: Short scale temporal variation of sinking fluxes
5.2 Relationships between lipidic biomarker
composi-tion and phytoplanktonic community
During DYNAPROC 2, primary productidivity was mea-sured, specific abundances of microphytoplankton was de-termined by microscopy and pigment analyses gave a com-plementary view of the whole phytoplanktonic community (Lasternas et al., 2008; Marty et al., 2008). The good descrip-tion of the phytoplanktonic community present in the water column sets a pertinent framework to attempt to implement the significance of sterol fingerprints in terms of phytoplank-tonic sources in a oligotrophic Mediterranean system.
Pigment chemometry indicated that the phytoplankton is dominated by small forms (haptophytes=“prymnesiophytes”, pelagophytes, prasinophytes, cyanobacteria and prochloro-phytes) whereas diatoms and dinoflagellates contributed to 3 to 18% of chlorophylla (Marty et al., 2008). This charac-teristic is in agreement with the oligotrophic character of the system at this time of the year.
24-Methylcholesta-5,22E-dien-3β-ol (brassicasterol) is almost the exclusive sterol of haptophytes, a major compo-nent of the plankton in the water column (Marty et al., 2008). This sterol often accounts for more than 90% of sterols in some diatoms species from productive area (Chaetoceros simplex, Skeletonema costatum, Thalassiosira pseudonana,
Nitzschia alba) which are not detected in the plankton of the water column (Lasternas et al., 2008). In addition the pig-ment signature of diatoms is almost absent in the exported particles (Marty et al., 2009). A diatom contribution to the source of brassicasterol thus can be discarded. Brassicasterol represents 53% of total sterols in the dinoflagellates Gymno-dinium simplex(Conte et al., 1994; Volkman, 1986), while
Gymnodiniumis one of the dominant genus of dinoflagel-lates at the time of study (Lasternas et al., 2008). However, microphytoplanktonic species represents only a small frac-tion of the whole phytoplankton community (Marty et al., 2008), their contribution to brassicasterol abundance is more likely minor relatively to pico and nano-forms such as hap-tophytes.
24-Ethylcholest-5-en-3β-ol (sitosterol) and 24-ethylcholesta-5,22E-dien-3β-ol are dominant sterols, and their fluxes depict the same variation trend as other phytosterols (Supplementary material, Fig. S5 and Table S3). Sitosterol is an important component of dinoflagellates and haptophytes, of a few Prymnesiophycea and Raphidophytes (Volkman, 1986; Nichols et al., 1987; Volkman et al., 1993). Its occurrence in diatoms is not relevant here, as it concerns genera insignificant in the water column (Asterionella and
Navicula, Lasternas et al., 2008). In DYNAPROC 2 sinking particles, the proportion of sitosterol to alkyl diols denies that eustigmatophytes are a foremost source for this sterol (Volkman et al., 1992; M´ejanelle et al., 2003). In this context, sitosterol is likely sourced by haptophytes and dinoflagellates, both significant algal groups in the water column. A high abundance of haptophytes could account
for both the dominance of brassicasterol and the relative high abundance of 24-ethylcholest-5-en-3β-ol in sinking particles.
24-Ethylcholesta-5,22E-dien-3β-ol is reported in signifi-cant amounts in algae that are little signifisignifi-cant during this study according to pigment chemometry (Cryptophycea and Chlorophyceae, Marty et al., 2008). It is also a compo-nent of Rhodophyceae and Chrysophyceae whose occurrence during DYNAPROC 2 study is not known (Volkman, 1986; Dunstan et al., 2005). The sterol compositions of pelago-phytes and prochloropelago-phytes, two dominant groups in the oligotrophic situation encountered during this work, are un-known at present. Whether these algae may contribute to the remarkable abundance of C29 sterols remains an open
question. The gap of knowledge concerning sterols of pico and nano-phytoplanktonic species of oligotrophic situations is a drawback for deciphering the information brought by sterols. Improving our knowledge on sterols of nano and pico-plankton would be a benefit for paleoceanographic stud-ies addressing the Mediterranean Sea and other oligotrophic environments.
The high abundances of cholest-5-en-3β-ol (cholesterol) and the cholesta-5,22E-dien-3β-ol (dehydrocholesterol) in the DYNAPROC 2 sinking particles suggest an important zooplanktonic contribution. High proportions of cholesterol are have also been reported in some dinoflagellates such as theGonyaulaxgenus, which is not an important phytoplank-tonic component at the time of this study (Lasternas et al., 2009), in haptophytes and in some diatoms (Volkman, 1986). Sterols in cultures of cyanobacteria were dominated by a mixture of cholesterol and sitosterol (Volkman, 1986), but further examination proved cyanobacteria to be devoid of sterols (Summons et al., 2006). Therefore, the occurrence of cholesterol in sinking particles is related to remains of zoo-plankton and haptophytes.
Haptophytes are specific producers of alkenones. A pluri-annual study of alkenone export at the study site and the same depth showed maxima at the end of the spring bloom (April to June) and in October-November with considerable interannual differences in flux maxima (Sicre et al., 1999; Ternois et al., 1996). The maxima in fluxes measured dur-ing DYNAPROC 2 are comparable to maxima measured in 1989, and higher than maxima measured in 1993 and 1994 (Sicre et al., 1999).The average flux of C37alkenones
mea-sured during this study (3.1±3.7 µg m−2d−1)is lower than
the flux maxima of 1989, but still higher than flux maxima of 1993 and 1994. Eventhough the fall disruption of the up-per thermocline was only initiated at the end of the cruise, alkenones fluxes during DYNAPROC 2 are in the range of seasonal maxima and suggest that the fall bloom of alkenone producers, haptophytes, may be occurring or starting.
The low abundance of dinosterol and dinostanol reflect the small contribution of microphytoplankton to the whole au-totrophs, eventhough dinoflagellates represent the dominant group of microphytoplankton (Marty et al., 2008; Lasternas
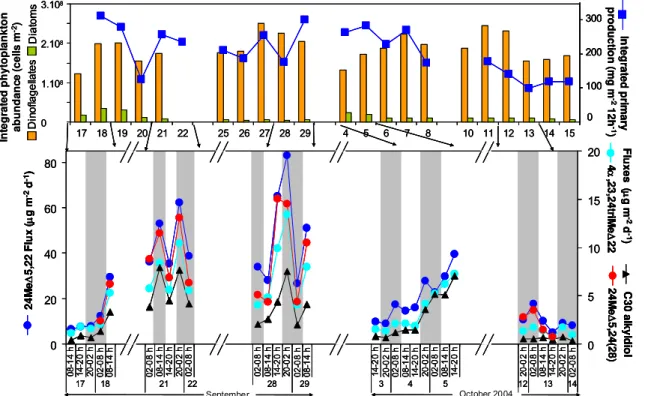
Table 3.Comparison of the biomarker fluxes measured by DYNAPROC 2 high frequency sediment trap experiment and in selected literature.
Fluxes are given in µg m−2d−1; minima and maxima values are given separated by a dash.aFlux of the sum of C37, C38and C39alkenones.
bFlux of 4α,23,23-trimethylcholest-22-en-3β-ol (dinosterol). cFlux of the summed C
37 and C38 alkenones. dFlux of C37:2 methyl
alkanone.eFlux of 24-methylcholesta-5,24(28)-dien-3β-ol. “nd” stands for non detected.
Resolved C37 C30 Sum
Location Depth hydrocarbons alkenones alkane diol sterols References
New Guinea Coast 300–1460 m 2.6–46.5 13–602 Burns et al., 2004
Australian Shelf 300–1430 m 29.7–36.8 13–602 Burns et al., 2004
NW Autralian Shelf 200–600 m 30–37 6–16.5 Burns et al., 2003
Eastern North Pacific
High productivity site 740–4750 m 2.7–5.6 Matsueda and Handa, 1986
Low productivity site 741–4750 m 0.37–0.82 Matsueda and Handa, 1986
Arabian Sea 2220 m 0.22–2.64 0.87–40.8a nd–7.92b Prahl et al., 2000
Antarctic HLNC zone 200 m 0.1–8.3 0–77.2c 68–661 Ternois et al., 98
SW Pacific Ocean 300–1000 m 0.05–95 10–98 Sikes et al., 2005
N Pacific 140 m ca. 50–220 Wakeham and Lee, 1989
N Pacific 100 m ca. 1200
N Pacific 505 m–3380 m 0.11–1.97d 2.6–9.29 3.7–16.4e Wakeham et al., 2002
NPacific 1235–3815 15–110 Grimalt et al., 1990
NAtlantic 2865–4730 19–78 Grimalt et al., 1990
NE Atlantic 3700m nd–5 Rosell-Mel´e et al., 2000
Mediterranea, Alboran Sea 100 m 12.8–31.7 288–817 Tolosa et al., 2005
300 m 2.60–15.7 95.5–294
Mediterranan, DYFAMED site 200 m 2.1–34.7 Marty et al., 1994
Mediterranan, DYFAMED site 200 m 0–9 Ternois et al., 1997
Mediterranan, DYFAMED site 200 m 1.4–29.7 0–14.2 0.3–9.3 31–377 This work
et al., 2008; Fig. 4). Dinosterol and dinostanol are abun-dant sterols of dinoflagellates, in particular inGymnodinium
which stands as one of the dominant dinoflagellate genus during this study (Volkman, 1986; Piretti et al., 1997; Man-sour et al., 2003; Lasternas et al., 2008). The other sterols substituted at C4 also fingerprint the dinoflagellate remains
in the sinking particles. 4α,24-Dimethyl substitued sterols are identified in variable amounts inScripssiellaand Gymno-dinium(Harvey et al., 1987; Mansour et al., 2003), relatively abundant in the microplankton and thus susceptible of hav-ing contributed these sterols. C26 sterols are not
systemati-cally reported in studies dealing with sterols. However they have been characterized in marine dinoflagellates, in particu-lar in the genusGymnodinium (Goad and Whithers, 1982; Volkman, 1986), that dominates the dinoflagellates during the present study (Lasternas et al., 2008) and is a possible source of these sterols.
5.3 Timing and drivers of biomarker flux variation
Drifting sediment trap efficiency may be a drawback to flux estimates. Fluxes of organic carbon estimated from thorium (234Th) deficiency in the 60 top meters of the water column varied from 197 to 219 mgCm−2d−1, whereas fluxes of or-ganic carbon calculated from234Th in the traps varies from 8 to 13 mgCm−2d−1(Schmidt et al., 2009). Advection, trap
efficiency, and organic carbon mineralization between 60 and 200 m depth may explain this discrepancy (Schmidt et al., 2009). Evidenced of the degraded state of the exported ma-terial laid the authors to the conclusion that the recycling of organic matter between 60 and 200 m was the main fac-tor explaining the large reduction in thorium-derived fluxes (Schmidt et al., 2009).
3028 L. M´ejanelle and J. Dachs: Short scale temporal variation of sinking fluxes Sterols decay during particle sinking complicate the
compar-ison with other worldwide situations because the literature on sterol fluxes concern sediment traps mostly moored at deeper depths (Table 3). Sterol fluxes measured during DY-NAPROC2 compare well to those measured in High Nutrient Low Chlorophyll Antarctic site at the same depth (Table 3), which characterizes a weak export. This is in good agree-ment with low bulk parameter export fluxes measured during DYNAPROC 2 and with the relatively low primary produc-tion (Andersen et al., 2009; Marty et al., 2009).
Chlorophylla integrated over the water column showed a diel variation during DYNAPROC 2 cruise (Marty et al., 2008), and the exported organic matter (POC and lipid classes) flux echoed this variation (Marty et al., 2009). Max-ima in export of some lipid classes were also observed at night at the end of spring (Goutx et al., 2000). However, for the subset of 31 samples under consideration here fluxes of hydrocarbons, alkenones and sterols failed to show an obvi-ous day-night periodicity (Fig. 3), even though some maxima occur at night. Cholesterol and dehydrocholesterol, markers of zooplankton, and steroid ketones, markers of fecal pel-lets neither show this diel variability and their flux timing is similar to those of intact phytosterols (Fig. 6). No day-night periodicity is depicted by the present subset of DY-NAPROC 2 samples, whilst this periodicity shows on the en-tire set of samples. It is possible that diel variability would have been as significant if the entire dataset (74 samples) had been analyzed for biomarkers. The low export ratio implies that sinking particles integrate algae which have remained in the euphotic layer over a longer period than the sampling frequency. In addition, particle sinking time may result in an offset between particle production and their collection in the traps. These processes may explain that some difference in the timing of primary production and fluxes of organic car-bon and of biomarkers.
The complexity of the coupling between primary produc-tion and export also shows when comparing integrated pri-mary production and export fluxes (Fig. 7). Whilst pripri-mary production shows little variation between 17 September and 5 October, biomarker fluxes remain low during several suc-cessive days and describe jagged pulses of high export dur-ing others (Fig. 7). After the October wind events and the mixing of the upper water column of (10 October onwards), the production decrease is echoed by minima in the export of biomarkers.
Two processes can be responsible for the pulses in biomarker flux: changes in the magnitude of particle flux (dry weight mass flux) and changes in the concentration of biomarkers in the particles. All biomarkers show concur-rent variation pattern, and their fluxes are significantly cor-related (Table 4). This indicates that a common driver con-trols biomarker fluxes: the mass flux intensity. Processes controlling aggregation and formation of organic particles have the most driving influence on flux variability. Linear correlations between fluxes of phytoplanktonic biomarkers
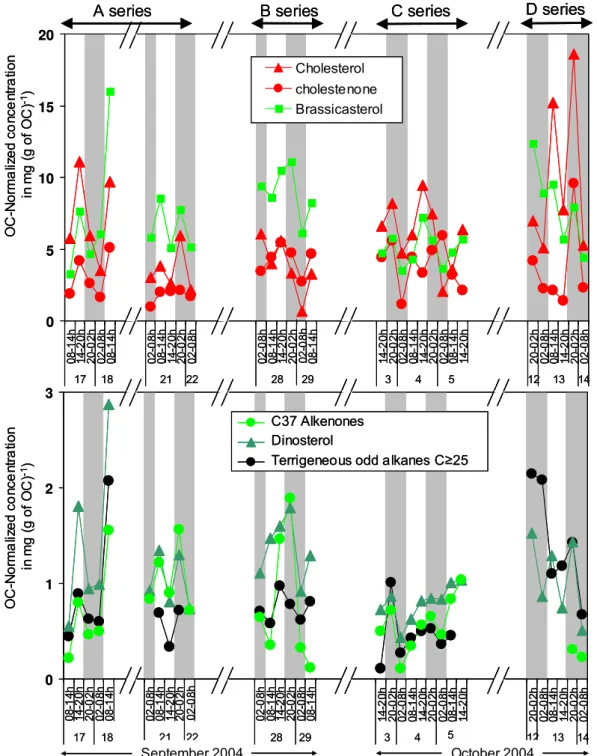
and those of biomarkers of oxidation, of zooplankton and of higher plants explain a lower fraction of the variance than correlations between phytobiomarkers only (57 to 97% and 86 to 99%, respectively, Table 4). Notwithstanding the gen-eral similar pattern of export, these results indicate some di-vergence in the relative variation of fluxes of higher plants, of zooplanktonic and of phytoplankton constituents, in turn implying changes in the composition of sinking particles. Compositional changes are also supported by the fact that the offset between organic carbon and biomarker fluxes dif-fers from one series to the other (Fig. 3). Concentrations of biomarker are calculated by normalizing their abundances to that of organic carbon. They vary on a smaller relative magnitude than do export fluxes (Fig. 8, compared to Figs. 6 and 7). As a consequence, biomarker concentration changes cause smaller variations of biomarker flux than do organic carbon flux. Interestingly, concentrations of biomarkers are less significantly correlated between themselves than do their fluxes. Concentrations of C37 alkenones and phytosterols
are not significantly correlated, neither concentrations of C37
alkenones and higher plant alkanols and alkanes, suggest-ing that their contribution to the organic particles have in-dependent timing (Supplementary material, Table S4 and Fig. 8). In contrast, concentration of other biomarkers such as brassicasterol are significantly correlated with concentra-tion of compounds of a distinct origin (higher plants alka-nols and alkanes), suggesting that compositional changes co-incide with an unknown common driver.
During the present study, the microphytoplankton and the nano and picoplankton in the water column show some changes at the time scale of a few days (Marty et al., 2008; Lasternas et al, 2008). Biomarker concentrations normalized to organic carbon points to some changes in sinking particle characteristics: punctual enrichments in haptophyte and di-noflagellate biomarkers (brassicasterol, alkenones and dinos-terol) on 18 September (A series, Fig. 8) and on 28 Septem-ber (B series). The time scale of these enrichments does not correspond to the variation of phytoplankton composition in euphotic zone particles, for instance the peak in haptophytes abundance lasted 3 days, from 17 to 19 September (Marty et al., 2008). The high frequency of the variation of sinking particles composition more likely integrate other parameters than water column primary production. The low export ratio and consequent high residence time of organic matter likely results in a temporal integration of biomarker signature in the exported particles over a larger period than the sampling frequency. In contrast, the enrichment in phytoplanktonic material inferred by lipid classes, which is a more general signature, applies to the whole A series (Fig. 8 in Marty et al., 2009).