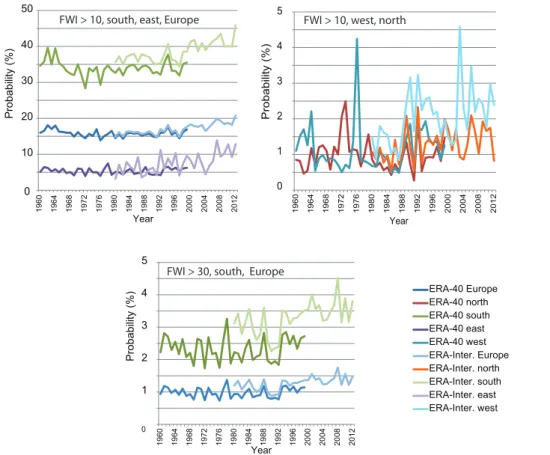
Temporal variations and change of forest fire danger in Europe in 1960–2012
Texto
Imagem


Documentos relacionados
The assessment is based on a spatial and temporal analysis of a meteorological fire danger index spe- cifically developed for Brazilian biomes, which was evaluated based on
The yellow peacock bass ( Cichla kelberi Kullander and Ferreira, 2006) is among the fish species used for fish culture and introduction in new reservoirs (stocking), private
For the 0- and 2-lepton channels, resolved events with more than two b-tagged jets or merged events with additional b-tagged track-jets not associated with the large-R jet are used
Milena Aparecida Ferrari Mateus 2 Rebeca de Cássia Andrade 3 Inês Caroline de Lima Proença 4 Brígida Souza 5 RESUMO: Entendendo a importância que este vasto grupo de
que os agricultores deveriam buscar, por si mesmos, envolver-se com o desenvolvimento local e principalmente os projetos voltados para a formação de jovens do meio
We also determined the critical strain rate (CSR), understood as the tangent of the inclination angle between the tangent to the crack development curve and the crack development
Uma das explicações para a não utilização dos recursos do Fundo foi devido ao processo de reconstrução dos países europeus, e devido ao grande fluxo de capitais no
