Optimal Skin-to-Stone Distance Is a Positive
Predictor for Successful Outcomes in Upper
Ureter Calculi following Extracorporeal Shock
Wave Lithotripsy: A Bayesian Model
Averaging Approach
Kang Su Cho1, Hae Do Jung2, Won Sik Ham3, Doo Yong Chung3, Yong Jin Kang3, Won Sik Jang3, Jong Kyou Kwon4, Young Deuk Choi3, Joo Yong Lee3*
1Department of Urology, Gangnam Severance Hospital, Urological Science Institute, Yonsei University College of Medicine, Seoul, Korea,2Department of Urology, Incheon Red Cross Hospital, Incheon, Korea,
3Department of Urology, Severance Hospital, Urological Science Institute, Yonsei University College of Medicine, Seoul, Korea,4Department of Urology, Severance Check-Up, Yonsei University Health System, Seoul, Korea
Abstract
Objectives
To investigate whether skin-to-stone distance (SSD), which remains controversial in patients with ureter stones, can be a predicting factor for one session success following extracorporeal shock wave lithotripsy (ESWL) in patients with upper ureter stones.
Patients and Methods
We retrospectively reviewed the medical records of 1,519 patients who underwent their first ESWL between January 2005 and December 2013. Among these patients, 492 had upper ureter stones that measured 4–20 mm and were eligible for our analyses. Maximal stone length, mean stone density (HU), and SSD were determined on pretreatment non-contrast computed tomography (NCCT). For subgroup analyses, patients were divided into four groups. Group 1 consisted of patients with SSD<25thpercentile, group 2 consisted of patients with SSD in the 25thto 50thpercentile, group 3 patients had SSD in the 50thto 75th percentile, and group 4 patients had SSD75thpercentile.
Results
In analyses of group 2 patients versus others, there were no statistical differences in mean age, stone length and density. However, the one session success rate in group 2 was higher than other groups (77.9% vs. 67.0%; P = 0.032). The multivariate logistic regression model revealed that shorter stone length, lower stone density, and the group 2 SSD were positive predictors for successful outcomes in ESWL. Using the Bayesian model-averaging OPEN ACCESS
Citation:Cho KS, Jung HD, Ham WS, Chung DY, Kang YJ, Jang WS, et al. (2015) Optimal Skin-to-Stone Distance Is a Positive Predictor for Successful Outcomes in Upper Ureter Calculi following Extracorporeal Shock Wave Lithotripsy: A Bayesian Model Averaging Approach. PLoS ONE 10(12): e0144912. doi:10.1371/journal.pone.0144912
Editor:Xin Gao, Sun Yat-sen University, CHINA
Received:July 13, 2015
Accepted:November 25, 2015
Published:December 14, 2015
Copyright:© 2015 Cho et al. This is an open access article distributed under the terms of theCreative Commons Attribution License, which permits unrestricted use, distribution, and reproduction in any medium, provided the original author and source are credited.
Data Availability Statement:Data are available from the Severance Hospital and Urological Science Institutional Data Access and Ethics Committee due to patients’privacy and research ethics. Readers can send requests for data to the corresponding author ([email protected]).
Funding:This study was supported by a faculty research grant from the Yonsei University College of Medicine for 2014 (6-2014-0156).
approach, longer stone length, lower stone density, and group 2 SSD can be also positive predictors for successful outcomes following ESWL.
Conclusions
Our data indicate that a group 2 SSD of approximately 10 cm is a positive predictor for suc-cess following ESWL.
Introduction
Several parameters can be used to optimize extracorporeal shock wave lithotripsy (ESWL) out-comes, including stone characterization, acoustic coupling, and shock wave rate and sequence [1]. Of these, patient factors, such as stone characterization, can be pretreatment positive pre-dictors for successful ESWL outcomes regardless of procedural factors. In most ESWL cases, stone analyses were not performed; therefore, patient factors should have an important role in pretreatment prediction of stone characteristics and treatment outcomes. In particular, due to the popularity of non-contrast computed tomography (NCCT), patient factors have been accu-rate predictors in such cases. Several studies have demonstaccu-rated that the consistency, size, shape, location, and Hounsfield units (HU) of the ureteral stone, as well as the body mass index (BMI) and skin-to-stone distance (SSD) of patients are significant factors that predict the successful outcome in ESWL [2,3].
Notably, since NCCT replaced intravenous urography as a confirmative tool for urinary stone disease, SSD has been a stronger factor than BMI for predicting the success of ESWL in patients with renal calculi [4]. SSD appears to increase in response to localization of the stone, increased subcutaneous and visceral adipose tissue, and renal parenchyma thickness [5]. How-ever, SSD as predictor of ESWL success remains controversial in patients with ureter stones. Until recently, SSD was a significant factor in half of all published studies. However, in the remaining studies, there was no significant difference in SSD for success or stone-free rate after ESWL [6–11]. Thus, we investigated why SSD was not a predicting factor for successful out-come following ESWL in previous studies. We also determined the optimal SSD, which can be used as a new positive predictor for successful ESWL outcomes in patients with upper ureter stones.
Materials and Methods
Patient cohort
Good clinical practice protocols
The study was performed in accordance with applicable laws and regulations, good clinical practices, and the ethical principles described in the Declaration of Helsinki. The Institutional Review Board of Severance Hospital approved this study protocol (Approval No. 4-2015-0398). Written informed consent given by participants was exempted because of the retrospec-tive study design and patients records and information was anonymized and de-identified prior to analysis.
Extracorporeal shock wave lithotripsy
ESWL was performed using the electroconductive lithotripter (EDAP Sonolith Praktis, Tech-nomed, Lyon, France) until 2011. Since, 2012, it was replaced by the electromagnetic generative lithotriptor (Dornier Compact Delta II lithotripter, Dornier Medtech, Wessling, Germany). All patients were treated under fluoroscopic guidance. The number of shock waves per ESWL ses-sion varied from 2500 to 4000 at a rate of 60–90 shock waves per minute. We prematurely ter-minated the session if the stone became difficult to visualize during the session. The launch intensity was conducted when the focal peak pressure ranged from 16 to 55 MPa as determined by the pain reported by patients while ESWL was being performed.
Stone characteristics on NCCT
Stone characteristics include location, size, SSD, and mean stone density. The SSD was mea-sured in the axial plane, 45° from the vertical axis. The longest stone length meamea-sured on NCCT was used. We used the GE Centricity system (GE Healthcare Bio-Sciences Corp., Piscat-away, NJ) during the measurement procedure. The mean stone density was measured using bone windows on the magnified, axial NCCT image of the stone in the maximal diameter, where the elliptical region of interest incorporated the largest cross-sectional area of stone without including adjacent soft tissue. Successful ESWL treatment of ureter and renal calculi was defined as those patients who were rendered stone free or had asymptomatic, clinically insignificant residual fragments3 mm in maximal diameter two weeks after a single ESWL treatment [13] as measured by simple X-ray and did not require auxiliary measures within a 3-month follow-up period.
Statistical analyses
For subgroup analyses, patients were divided into four groups based on the first, second and third quartiles. Group 1 consisted of patients with SSD<25thpercentile, group 2 included patients with SSD in the 25thto 50thpercentile, group 3 patients had SSD in the 50thto 75th per-centile, and group 4 patients were75thpercentile. Statistical comparisons of continuous vari-ables from patient demographic information were performed using Student’s or Welch’s two-sample t-tests. In subgroup analyses, one-way analyses of variance (ANOVA) were used. After ANOVA, Tukey–Kramer’s post hoc tests were used for comparisons between groups. Categori-cal variables were compared using Pearson's chi-squared tests. Univariate and multivariate logistic regression analyses with a binomial were carried out to define predicting factors follow-ing ESWL.
averaged results over multiple models and used the posterior probabilities of these models to perform all inferences and predictions [16]. From these averaged estimates, the posterior prob-ability that a coefficient was nonzero was calculated. The posterior probprob-ability, P(B6¼0), was interpreted as the probability that a predictor has an effect. The interpretation of P(B6¼0) was categorized as follows:<50%, evidence against an effect; 50%–75%, weak evidence of an effect; 75%–95%, positive evidence; 95%–99%, strong evidence; and>99%, very strong evidence [17]. Statistical analyses were performed using R software (version 3.0.3, R Foundation for Statis-tical Computing, Vienna, Austria;http://www.r-project.org) and its BMA package for the Bayesian model-averaging approach.
Results
Demographic analysis in all patients with upper ureter stones and the
four groups
The mean age of the 492 patients with upper ureter stones was 51.29±14.32 years. The mean maximal stone length was 9.33±3.85 mm and the mean stone density was 719.70±272.81 HU. The mean HU ratio was 14.20±8.82 HU/mm and the mean SSD was 108.78±19.23. The median SSD (interquartile range) was 108.80 (97.53–121.60) mm. The number of cases with one ses-sion success was 343 (69.7%) (Table 1).
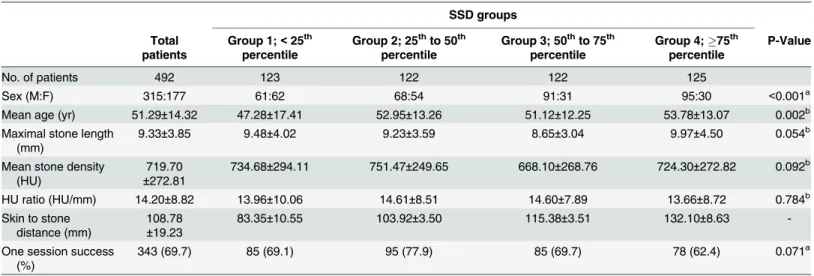
In subgroup analyses, the sex ratio distribution consisted of 61:62 in group 1, 68:54 in group 2, 91:31 in group 3, and 95:30 in group 4 (P<0.001). In groups 1 and 2, percentage of female patients was higher compared to groups 3 and 4. The mean ages in each group were 47.28 ±17.41 years, 52.95±13.26 years, 51.12±12.25 years, and 53.78±13.07 years, respectively (P = 0.002). Based on post hoc tests, patients in group 1 were younger than those in groups 2 and 4 (Fig 1A). Maximal stone length was not significantly different; however, post hoc tests showed that the maximal stone length in group 3 was shorter than in group 4 (Fig 1B). For mean stone density and HU ratio, there were no differences among the four groups (Fig 1C and 1D). The number of one session success cases in group 2 was higher than other groups. However, there were no significant differences among the groups (Table 1).
Group 2 versus other groups
The sex ratio distribution in other groups consisted of 247:123, which was significantly differ-ent compared to group 2 (P = 0.037). However, there were no statistical differences in mean age, maximal stone length, mean stone density, and HU ratio. The one session success rate in group 2 was higher compared to the other groups (77.9% in group 2 vs. 67.0% in the other groups; P = 0.032) (Table 2).
Discussion
In 2005, Pareek et al. reported that SSD measured by NCCT is a predicting factor for stone-free status of a patient with a lower pole renal stone following ESWL [18]. After distribution of ESWL to treat urinary stone disease, their study was the first to evaluate SSD. Their study mea-sured 64 patients and concluded that SSD is a significant predictor for ESWL outcome (OR 0.32, 95% CI 0.29–0.35; P<0.01).
However, compared with other patient factors, SSD had two basic problems. The first issue regarded race. Because Asian populations have thin body volumes compared to Western pop-ulations, it was argued that it could not be applied to Asian patients [19]. Recently, ESWL research conducted in Asia showed that SSD was not a meaningful factor. Ng et al. investi-gated that the role of NCCT in predicting treatment outcomes of ESWL in patients with upper ureteral stones from Hong Kong [20]. In their demographic data, the mean SSD was 10.23 cm in patients with successful outcomes and 10.44 cm in those with unsuccessful out-comes (P = 0.456). Choi et al. reported predictive factors for failure of ESWL for treating Korean patients with ureteral stones [10]. Using a multivariate logistic regression model, these authors also found that SSD was not a significant predicting factor for failure of ESWL in both groups (stone size10 mm and>10 mm). Tanaka et al. identified the NCCT parameters that best predict the success of ESWL in patients from Japan [11]. They demonstrated that there was no significant difference of SSD between patients with successful and unsuccessful out-comes, and SSD was not a significant predictor for success after ESWL using multivariate logistic regression models. Thus, in Asian populations, SSD may not be a significant predictor for ESWL success or stone-free status.
The second issue was whether SSD could be a predicting factor in ureter stones, which differ from renal stones. Wiesenthal et al. analyzed predicting factors of ESWL success for 422 renal and ureter stone patients and developed a nomogram [21]. They reported that SSD in ureter stones was not an independent predicting factor, and moreover, SSD for ureter stones was lon-ger than for renal stones. Furthermore, the theoretical background that SSD was a predicting factor of ESWL was because as SSD became longer, the shockwave force would be attenuated Table 1. Demographic data on all patients, including patients who were divided into four groups according to SSD percentile.
SSD groups
Total patients
Group 1;<25th percentile
Group 2; 25thto 50th percentile
Group 3; 50thto 75th percentile
Group 4;75th percentile
P-Value
No. of patients 492 123 122 122 125
Sex (M:F) 315:177 61:62 68:54 91:31 95:30 <0.001a
Mean age (yr) 51.29±14.32 47.28±17.41 52.95±13.26 51.12±12.25 53.78±13.07 0.002b
Maximal stone length (mm)
9.33±3.85 9.48±4.02 9.23±3.59 8.65±3.04 9.97±4.50 0.054b
Mean stone density (HU)
719.70 ±272.81
734.68±294.11 751.47±249.65 668.10±268.76 724.30±272.82 0.092b
HU ratio (HU/mm) 14.20±8.82 13.96±10.06 14.61±8.51 14.60±7.89 13.66±8.72 0.784b
Skin to stone distance (mm)
108.78 ±19.23
83.35±10.55 103.92±3.50 115.38±3.51 132.10±8.63
-One session success (%)
343 (69.7) 85 (69.1) 95 (77.9) 85 (69.7) 78 (62.4) 0.071a
a
. Based on Pearson's chi-squared tests with Yates' continuity correction
b
. Based on one-way ANOVA
Fig 1. Based on post hoc tests, patients in group 1 were younger than those in groups 2 and 4 (A). Maximal stone lengths were not significantly different; however, post hoc tests showed that the maximal stone length in group 3 was shorter than in group 4 (B). For mean stone density and HU ratio, there were no differences in the four groups (C and D). 1; group 1, 2; group 2, 3; group 3, 4; group 4.
[22]. Because ureter stones have relatively long SSD compared to renal stones and are located around larger amount of intra-abdominal fat tissue, the prediction power would be decreased [23]. Additionally, in previous studies, one reason that SSD on ESWL successful outcome of ureter stone is a reasonable factor is setting upper ureter stones as well as lower ureter stones as subjects of analyses [8,9,11,24–26]. For lower ureter stones, because SSD should be measured in the anterior abdomen, they had longer SSD than upper ureter stones. Our study analyzed upper ureter calculi because the location of ureter stones could add confusion or bias.
In the current study, patients in group 2 showed statistically better success rates compared to other groups. The reason for this is likely not due to BMI differences according to racial or SSD differences in the calculi. An optimal SSD can be significant, as focusing distance in shock wave energy delivery and stone fragmentation were fixed. In relatively thin patients (e.g. Asian patients), shock wave energy delivery could be interrupted, similar to group 1 (83.35±10.55 mm), which showed the shortest SSD. By focusing the shock waves on a single focal point (F2), the lithotripter concentrates energy at the site where the stone is located [27]. However, a shockwave can easily transfer nonlinear waves [28]. If the SSD is too short for the target stone, it can interrupt focusing through shock wave propagation and induce dispersion. Longitudinal (P) and transverse (S) waves, which have different frequencies and rates, reach the shock wave Table 2. Demographic data on all patients, including patients in group 2 and others.
Group 2; 25thto 50thpercentile Groups 1, 3, and 4 P-value
No. of patients 122 370
Sex (M:F) 68:54 247:123 0.037a
Mean age (yr) 52.95±13.26 50.74±14.63 0.123b
Maximal stone length (mm) 9.23±3.59 9.37±3.94 0.711b
Mean stone density (HU) 751.47±249.65 709.22±279.55 0.117b
HU ratio (HU/mm) 14.61±8.51 14.07±8.92 0.544b
SSD (mm) 103.92±3.50 110.38±21.85
-One session success (%) 95 (77.9) 248 (67.0) 0.032a
a. Based on Pearson's chi-squared tests with Yates' continuity correction b. Based on student's or Welch's two sample t-tests
doi:10.1371/journal.pone.0144912.t002
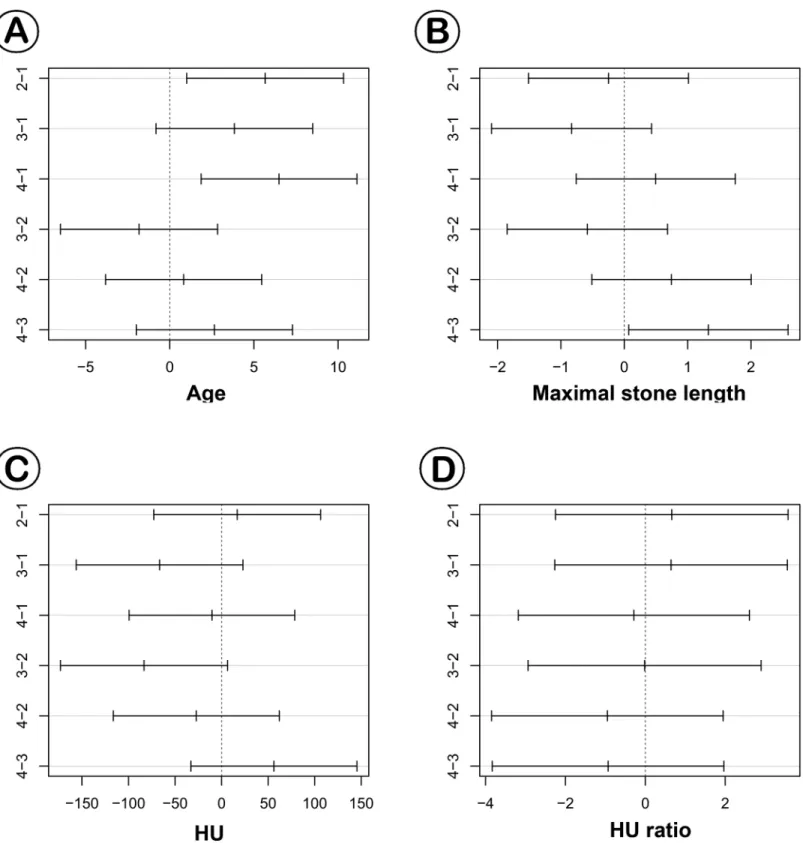
Table 3. Univariate and multivariate logistic regression model for one session success rate.
Odds ratio 95% confidential interval P-value
Univariate
Age 0.992 0.979–1.005 0.259
Male (vs. female) 0.722 0.476–1.085 0.121
Maximal stone length 0.803 0.755–0.851 <0.001
Mean stone density 0.997 0.996–0.997 <0.001
SSD 0.998 0.988–1.008 0.633
Group 2 (vs. others) 0.578 0.353–0.922 0.025
Multivariate
Age 0.997 0.981–1.012 0.692
Male (vs. female) 0.729 0.452–1.164 0.189
Maximal stone length 0.847 0.795–0.899 <0.001
Mean stone density 0.997 0.996–0.998 <0.001
Group 2 (vs. others) 0.470 0.267–0.803 0.007
in F2 repeatedly [29]. Effective stone fragmentation thus begins at the stone surface due to mul-tiple sources of stress.
Given that P and S waves have different frequencies and rates, if the distance to F2 is rela-tively short, the lithotripter’s focusing of the two waves on F2 could be erroneous. In the electromagnetic shock wave generator, the cylindrical coil surrounded by the cylindrical membrane is designed to focus on F2. However, if the target distance is too short, the shock wave will erroneously focus on the acoustic lens or reflector. This is the primary reason for error in F2. In cases that use an electrohydraulic shock wave generator and are at a short dis-tance from F2, the focus of the ellipsoid reflector on the electrohydraulic lithotripter could be inaccurate. While attempting to maintain the distance to F2 as the water cushion distance expanded, it was difficult to retain patient posture, and focusing became inaccurate. In addi-tion, it decreased the coupling of the shock wave, which could be one reason for the lower suc-cess rate. Thus, in contrast to SSD alone, group 2 SSD can be a positive predictor for sucsuc-cess following ESWL.
In addition, the SSD in group 2 (mean; 103.92±3.50 mm, range; 97.53–109.70 mm) was con-sistent with the cutoff values (10–11 cm) used in previous studies [18,24]. However, we pro-posed that the group 2 SSD of the ureter stone was a predicting factor in ESWL outcome rather than cutoff value. We also confirmed that if the SSD was approximately 10 cm (range; 97.53–
109.70 mm), the success rate was higher than other groups. This is likely because as the SSD becomes greater, the shock wave decreases. In relatively thin patients in group 1, the success rate after ESWL may be lower than in patients who have an SSD of approximately 10 cm. Therefore, the SSD for Asian or thin patients in a cohort study could not be considered statisti-cally reasonable.
Our study had some inherent limitations. Its retrospective design may have introduced sam-pling bias. To overcome its retrospective nature and small sample size, we applied a Bayesian mode-averaging approach, which can reduce bias from standard non-Bayesian approaches. The Bayesian approach is ideally suited for assessing information that accrues during a trial, potentially allowing for smaller yet more informative trials in which patients may receive better treatment [30]. In addition, as a continuous value, SSD was not significant in the logistic regression model, as the optimal distance could be settled. Thus, we suggested that the optimal distance may be the group 2 SSD, which was a significant categorical value in the logistic regression model. The use of two different generating machines may have also resulted in bias; however, there were no statistical difference in successful outcomes for each period. Thus, we suggest that the optimal distance should be approximately 10 cm due to variations in shock wave lithotripters from different companies used at each institute.
Despite these limitations, we are confident in our novel findings regarding the clinical utility of optimal SSD as a predictive factor for successful outcome after patients undergo ESWL for ureteral stones.
Table 4. Logistic regression model coefficient estimates derived using Bayesian model averaging.
Predictors Coefficient P (B6¼0)
Maximal stone length -0.168 100.0
Mean stone density -0.003 100.0
SSD -0.001 4.2
Group 2 (vs. others) -0.573 74.6
P (B6¼0): the posterior probability that a coefficient is non-zero
Conclusions
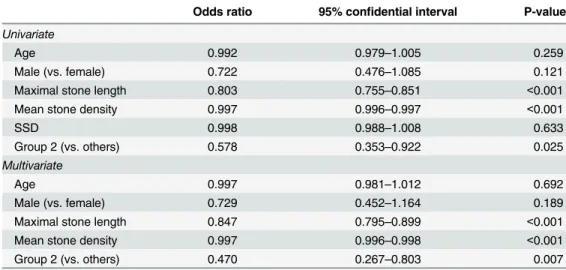
It was previously controversial whether SSD was a predicting factor in the outcome of ESWL in patients with ureteral stones. In our study, we found that group 2 SSD (approximately 10 cm) was a positive predictor for a successful ESWL outcome. A SSD of 8 cm had a decreased Fig 2. Posterior distribution plots of (A) maximal stone length (MSL), (B) mean stone density, (C) SSD, and (D) group 2 (versus others) in one session success.Shorter maximal stone length, lower mean stone density, and group 2 were also primarily distributed over the zero point for posterior probabilities.
one session success rate because once the distance to F2 is too short, the focusing is not optimal.
Acknowledgments
This study was supported by a faculty research grant from the Yonsei University College of Medicine for 2014 (6-2014-0156).
Author Contributions
Conceived and designed the experiments: KSC HDJ JYL. Performed the experiments: KSC HDJ JYL. Analyzed the data: KSC HDJ JYL DYC. Contributed reagents/materials/analysis tools: KSC HDJ JYL. Wrote the paper: KSC HDJ JYL DYC YJK WSJ JKK WSH YDC.
References
1. Bhojani N, Lingeman JE (2013) Shockwave lithotripsy-new concepts and optimizing treatment parame-ters. Urol Clin North Am 40: 59–66. doi:10.1016/j.ucl.2012.09.001PMID:23177635
2. Erturk E, Herrman E, Cockett AT (1993) Extracorporeal shock wave lithotripsy for distal ureteral stones. J Urol 149: 1425–1426. PMID:8501780
3. Pareek G, Armenakas NA, Fracchia JA (2003) Hounsfield units on computerized tomography predict stone-free rates after extracorporeal shock wave lithotripsy. J Urol 169: 1679–1681. PMID:12686807 4. Galvin DJ, Pearle MS (2006) The contemporary management of renal and ureteric calculi. BJU Int 98:
1283–1288. PMID:17125486
5. Gonulalan U, Akand M, Coban G, Cicek T, Kosan M, Goktas S, et al. (2014) Skin-to-stone distance has no impact on outcomes of percutaneous nephrolithotomy. Urol Int 92: 444–448. doi:10.1159/
000356562PMID:24481206
6. El-Nahas AR, El-Assmy AM, Mansour O, Sheir KZ (2007) A prospective multivariate analysis of factors predicting stone disintegration by extracorporeal shock wave lithotripsy: the value of high-resolution noncontrast computed tomography. Eur Urol 51: 1688–1693; discussion 1693–1684. PMID:17161522 7. Weld KJ, Montiglio C, Morris MS, Bush AC, Cespedes RD (2007) Shock wave lithotripsy success for
renal stones based on patient and stone computed tomography characteristics. Urology 70: 1043–
1046; discussion 1046–1047. PMID:18158009
8. Jacobs BL, Smaldone MC, Smaldone AM, Ricchiuti DJ, Averch TD (2008) Effect of skin-to-stone dis-tance on shockwave lithotripsy success. J Endourol 22: 1623–1627. doi:10.1089/end.2008.0169
PMID:18721043
9. Bandi G, Meiners RJ, Pickhardt PJ, Nakada SY (2009) Stone measurement by volumetric three-dimen-sional computed tomography for predicting the outcome after extracorporeal shock wave lithotripsy. BJU Int 103: 524–528. doi:10.1111/j.1464-410X.2008.08069.xPMID:19007365
10. Choi JW, Song PH, Kim HT (2012) Predictive factors of the outcome of extracorporeal shockwave litho-tripsy for ureteral stones. Korean J Urol 53: 424–430. doi:10.4111/kju.2012.53.6.424PMID:22741053 11. Tanaka M, Yokota E, Toyonaga Y, Shimizu F, Ishii Y, Fujime M, et al. (2013) Stone attenuation value
and cross-sectional area on computed tomography predict the success of shock wave lithotripsy. Korean J Urol 54: 454–459. doi:10.4111/kju.2013.54.7.454PMID:23878688
12. Kwon SY, Choi JY, Kim BS, Kim HT, Yoo ES, Park YK (2013) Efficacy of percutaneous nephrostomy tube during ureteroscopy for upper ureter stone management. J Endourol 27: 1209–1212. doi:10.
1089/end.2013.0347PMID:23895550
13. Seitz C, Tanovic E, Kikic Z, Memarsadeghi M, Fajkovic H (2007) Rapid extracorporeal shock wave lith-otripsy for proximal ureteral calculi in colic versus noncolic patients. Eur Urol 52: 1223–1227. PMID:
17321666
14. Yeung KY, Bumgarner RE, Raftery AE (2005) Bayesian model averaging: development of an improved multi-class, gene selection and classification tool for microarray data. Bioinformatics 21: 2394–2402.
PMID:15713736
15. Lee AS, Pan A, Harbarth S, Patroni A, Chalfine A, Daikos GL, et al. (2015) Variable performance of models for predicting methicillin-resistant Staphylococcus aureus carriage in European surgical wards. BMC Infect Dis 15: 105. doi:10.1186/s12879-015-0834-yPMID:25880328
17. Kim IK, Lee JY, Kwon JK, Park JJ, Cho KS, Ham WS, et al. (2014) Prognostic factors for urachal can-cer: a bayesian model-averaging approach. Korean J Urol 55: 574–580. doi:10.4111/kju.2014.55.9.
574PMID:25237458
18. Pareek G, Hedican SP, Lee FT Jr, Nakada SY (2005) Shock wave lithotripsy success determined by skin-to-stone distance on computed tomography. Urology 66: 941–944. PMID:16286099
19. Rush E, Plank L, Chandu V, Laulu M, Simmons D, Swinburn B, et al. (2004) Body size, body composi-tion, and fat distribution: a comparison of young New Zealand men of European, Pacific Island, and Asian Indian ethnicities. N Z Med J 117: U1203. PMID:15608799
20. Ng CF, Siu DY, Wong A, Goggins W, Chan ES, Wong KT (2009) Development of a scoring system from noncontrast computerized tomography measurements to improve the selection of upper ureteral stone for extracorporeal shock wave lithotripsy. J Urol 181: 1151–1157. doi:10.1016/j.juro.2008.10.
161PMID:19152949
21. Wiesenthal JD, Ghiculete D, Ray AA, Honey RJ, Pace KT (2011) A clinical nomogram to predict the successful shock wave lithotripsy of renal and ureteral calculi. J Urol 186: 556–562. doi:10.1016/j.juro.
2011.03.109PMID:21684557
22. Tran TY, McGillen K, Cone EB, Pareek G (2015) Triple D Score is a reportable predictor of shockwave lithotripsy stone-free rates. J Endourol 29: 226–230. doi:10.1089/end.2014.0212PMID:25046472 23. Geng JH, Tu HP, Shih PM, Shen JT, Jang MY, Wu WJ, et al. (2015) Noncontrast computed
tomogra-phy can predict the outcome of shockwave lithotripsy via accurate stone measurement and abdominal fat distribution determination. Kaohsiung J Med Sci 31: 34–41. doi:10.1016/j.kjms.2014.10.001PMID:
25600918
24. Wiesenthal JD, Ghiculete D, D'A Honey RJ, Pace KT (2010) Evaluating the importance of mean stone density and skin-to-stone distance in predicting successful shock wave lithotripsy of renal and ureteric calculi. Urol Res 38: 307–313. doi:10.1007/s00240-010-0295-0PMID:20625891
25. Perks AE, Gotto G, Teichman JM (2007) Shock wave lithotripsy correlates with stone density on preop-erative computerized tomography. J Urol 178: 912–915. PMID:17632139
26. Kacker R, Zhao L, Macejko A, Thaxton CS, Stern J, Liu JJ, et al. (2008) Radiographic parameters on noncontrast computerized tomography predictive of shock wave lithotripsy success. J Urol 179: 1866–
1871. doi:10.1016/j.juro.2008.01.038PMID:18353389
27. Pearle MS (2012) Shock-wave lithotripsy for renal calculi. N Engl J Med 367: 50–57. doi:10.1056/
NEJMct1103074PMID:22762318
28. Cleveland RO, Lifshitz DA, Connors BA, Evan AP, Willis LR, Crum LA (1998) In vivo pressure measure-ments of lithotripsy shock waves in pigs. Ultrasound Med Biol 24: 293–306. PMID:9550188