Sao Paulo Med J. 2017; 135(2):89-91 89
EDITORIAL
DOI: 10.1590/1516-3180.2017.1352010217How to grade child health in Brazil? Comparison of
the results from the Global Burden of Diseases 2015
in Latin America. A call for papers
Como classiicar a saúde da criança no Brasil? Comparação dos resultados do
Global Burden of Diseases 2015 na América Latina. Convocação de estudos
Paulo Andrade Lotufo
IFaculdade de Medicina da Universidade de São Paulo (FMUSP), São Paulo (SP), Brazil
Several papers comparing health indicators around the world, derived from the Global Burden of Diseases (GBD) study 2015, were published in October 2016. One of these, authored by the GBD 2015 Child Mortality Collaborators, addressed global, regional, national and selected subnational levels of stillbirths, neonatal, infant and under-five mor-tality, 1980-2015.1 This article made it possible to compare mortality rates (per 1000 live
births) among Latin American countries in 2015, in terms of neonatal deaths (up to the 27th
day of life), postneonatal deaths (from the 28th day to one year of age), deaths at the ages
of one to four years and deaths at ages of under five years.2 Moreover, it was possible to
compare the pace of change among those rates over the years, by comparing three peri-ods: 1990-2000, 2000-2015 and 1990-2015; and thus, to ascertain which countries reached Millennium Development Goal 4 (MDG-4), i.e. an annualized rate of decrease in the under-five mortality rate of 4.4%. Particularly, our focus relates to Brazil’s performance during the period 1990-2015, among 17 Latin American countries.
Figure 1 shows that Brazil was ranked 14th for neonatal mortality (A) with rates 140% higher
than Chile, which had the lowest rate. For postneonatal mortality, Brazil ranked 13th with rates
120% higher than Chile, which was again the country with the lowest rate. However, the picture for the age stratum from one to four years (B) difered from the traditional infant mortality cat-egory of under one year of age, such that Brazil was in ith place, ater Chile, Uruguay, Costa Rica and Argentina.
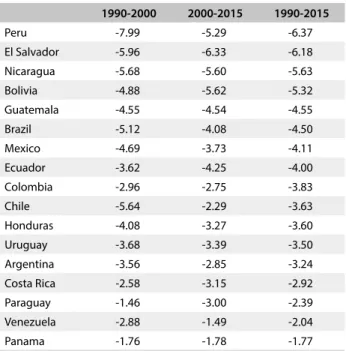
Table 1 shows the annualized reduction in under-ive mortality rates. Peru, El Salvador, Nicaragua, Bolivia, Guatemala and Brazil were the only countries with decreases of 4.4% per year from 1990 to 2015, thus reaching MDG-4. However, the pace of rate reduction was faster over the period 1990-2000 (-5.12%) than in 2000-2015 (-4.08%).
his same article2 enabled comparisons of prespeciied under-ive mortality rates among Latin
American countries and within Brazil, subdivided according to its states (data not shown). None of these countries were classiied in the lowest category of under-ive mortality rates (i.e. fewer than ive deaths per 1000 live births), as observed in Canada, the United States, Western Europe, Australia, Japan and South Korea. Only Chile and Uruguay were ranked in the category of 5-10 deaths per 1000 live births. Almost all Latin American countries were ranked in the third stra-tum (10-20 deaths per 1000) including all Brazilian states located in the South, Southeast and Center-West and some in the North and Northeast. he fourth level (20-30 deaths per 1000) was presented in Bolivia, Guatemala, Honduras and the Brazilian states of Acre, Amapá, Maranhão, Piauí, Ceará, Bahia, Alagoas and Pernambuco.
From this summary, readers can grade the quality of child health in Brazil over recent years. he Journal is calling for more articles discussing “Child Health in Brazil”.
EDITORIAL | Lotufo PA
90 Sao Paulo Med J. 2017; 135(2):89-91
A
C
B
D
3.94 4.89 5.14 5.16 7.11 6.95 6.80 7.57 7.71 8.15 8.32 8.96 9.06 9.38 10.04 11.56 15.361.00 6.00 11.00 16.00
Chile El Salvador Uruguay Argentina Costa Rica Colombia Ecuador Nicaragua Peru Mexico Panama Venezuela Guatemala Paraguay Bolivia Honduras Brazil 2.63 2.95 3.59 3.84 3.97 4.51 4.58 4.75 4.78 4.97 5.09 5.22 5.72 6.02 6.44 8.81 9.62 Chile Uruguay Argentina Costa Rica El Salvador Peru Panama Nicaragua Brazil Ecuador Guatemala Bolivia Honduras Colombia Paraguay Venezuela Mexico
1.00 6.00 11.00 16.00
1.06 1.13 1.67 1.85 1.93 2.33 2.61 2.63 3.00 3.15 3.55 3.71 4.46 4.73 4.77 5.46 7.62 Chile Uruguay Costa Rica Argentina Brazil El Salvador Mexico Nicaragua Paraguay Venezuela Colombia Peru Ecuador Panama Honduras Bolivia Guatemala
2.00 4.00 6.00 8.00 10.00 12.00
0.00 14.00 16.00
7.61 9.58 9.75 11.27 12.57 15.36 15.37 15.79 15.81 16.87 16.94 17.55 17.75 17.91 22.2 25.97 29.37 Chile Uruguay Costa Rica El Salvador Argentina Nicaragua Mexico Peru Colombia Venezuela Brazil Panama Ecuador Paraguay Honduras Guatemala Bolivia
5 10 15 20 25 30
0
Figure 1. Mortality rates (per 1000 live births) in Latin American countries in 2015.
How to grade child health in Brazil? Comparison of the results of the Global Burden of Diseases 2015 in Latin America. A call for papers | EDITORIAL
Sao Paulo Med J. 2017; 135(2):89-91 91 REFERENCES
1. United Nations. The Millennium Development Goals Report 2015.
New York: United Nations; 2015. Available from: http://www.un.org/
millenniumgoals/2015_MDG_Report/pdf/MDG%202015%20rev%20
(July%201).pdf. Accessed in 2017 (Feb 8).
2. GBD 2015 Child Mortality Collaborators. Global, regional, national, and
selected subnational levels of stillbirths, neonatal, infant, and under-5
mortality, 1980-2015: a systematic analysis for the Global Burden of
Disease Study 2015. Lancet. 2016;388(10053):1725-74.
Sources of funding: Not declared
Conlict of interest: Not declared
Address for correspondence: Paulo Andrade Lotufo
Centro de Pesquisa Clínica e Epidemiológica, Hospital Universitário,
Universidade de São Paulo
Av. Prof. Lineu Prestes, 2.565
Butantã — São Paulo (SP) — Brasil
Tel. (+55 11) 3091-9300
E-mail: [email protected]
Table 1. Annual percentage reduction in mortality rates among
children under ive years of age in Latin American countries
1990-2000 2000-2015 1990-2015
Peru -7.99 -5.29 -6.37
El Salvador -5.96 -6.33 -6.18
Nicaragua -5.68 -5.60 -5.63
Bolivia -4.88 -5.62 -5.32
Guatemala -4.55 -4.54 -4.55
Brazil -5.12 -4.08 -4.50
Mexico -4.69 -3.73 -4.11
Ecuador -3.62 -4.25 -4.00
Colombia -2.96 -2.75 -3.83
Chile -5.64 -2.29 -3.63
Honduras -4.08 -3.27 -3.60
Uruguay -3.68 -3.39 -3.50
Argentina -3.56 -2.85 -3.24
Costa Rica -2.58 -3.15 -2.92
Paraguay -1.46 -3.00 -2.39
Venezuela -2.88 -1.49 -2.04