Karina Cardoso MeiraI Gulnar Azevedo e SilvaII Cosme Marcelo Furtado Passos da SilvaIII
Joaquim Gonçalves ValenteIII
I Programa de Epidemiologia em Saúde Pública. Escola Nacional de Saúde Pública Sergio Arouca. Fundação Oswaldo Cruz (Fiocruz). Rio de Janeiro, RJ, Brasil II Departamento de Epidemiologia. Instituto
de Medicina Social. Universidade do Estado do Rio de Janeiro. Rio de Janeiro, RJ, Brasil III Departamento de Epidemiologia e Métodos
Quantitativos em Saúde. Escola Nacional de Saúde Pública Sergio Arouca. Fiocruz. Rio de Janeiro, RJ, Brasil
Correspondence: Karina Cardoso Meira
Universidade do Estado do Rio de Janeiro R. São Francisco Xavier, 524, 7º andar Bloco D Sala 7022 Maracanã
20550-900 Rio de Janeiro, RJ, Brasil E-mail: [email protected] Received: 3/9/2012
Approved: 8/21/2012
Article available from: www.scielo.br/rsp
Age-period-cohort effect on
mortality from cervical cancer
ABSTRACT
OBJECTIVE: To estimate the effect of age, period and birth cohort on mortality
from cancer of the cervix.
METHODS: Mortality data for cervical cancer in women aged over 30,
between1980 and 2009, for the municipalities of Rio de Janeiro and Sao Paulo, Southeastern Brazil,were extracted from the Mortality Information System. The estimated annual percentage change was calculated for the periods 1980-1994 and 1995-2009. Age, period and cohort effects were assessed employing the Poisson regression model, using estimated functions, deviations, curvatures and drift through the library Epi statistical program R version 2.7.2.
RESULTS: The average mortality rate per 100,000 women for the period in Rio
de Janeiro was 15.90 and 15.87 in Sao Paulo. There was a signifi cant reduction in mortality from cervical cancer in the two periods (1980-1994 and 1995-2009) in both Rio de Janeiro, -1.20% (95%CI -2.20;-0.09) -1.46% (95%CI -2.30;0.61) and in Sao Paulo, -2.58% (95%CI -3.41;1.76) and -3.30% (95%CI -4.30;2.29). The analysis of effects of curvature indicated reduction in deaths in successive cohorts (RR < 1 in women born after the 1960s). There was marked reduction in relative risk (RR) from the 2000s onwards.
CONCLUSIONS: The study showed that, in the time period analyzed, the
period had an effect on the reduction in mortality rates for cervical cancer, bearing in mind that there was a protective effect (RR < 1) from the year 2000 onwards and in women born after the 1960s
DESCRIPTORS: Uterine Cervical Neoplasms, mortality. Cohort Effect.
Cervical cancer is a preventable neoplasia. It is a disease with a well-documented natural history, with well-defi ned stages and slow progression of lesions. These characteristics mean it can be detected at an early, treatable stage through Pap smear testing. In the last ten years, vaccinations against the HPV virus, a cause of this type of cancer, have become available.12,17,19
Although measures are taken for its prevention and early detection, cervical cancer is the third most common cancer in women and the fourth most common cause of mortality worldwide. It is the fourth most common cause of death in Brazil, moving to second place in less developed regions.3,9,14,18
In Brazil, the first preventative measures for this neoplasia, using the Pap smear, occurred in the state of Sao Paulo in the second half of the 1980s. Public cyto-pathology laboratories and a referral system to care for positive or suspected cases were set up in municipalities and regions of the state.21 Cervical cancer screening
campaigns also became part of the Ministry of Health’s Comprehensive Women’s Health Care Program (PAISM) in this decade. There preventative actions were expanded to cover the whole country in 1998, through the National Cervical Cancer Control Program (NCCCP), known as the Life-Woman Program.13,20,21
Analyses of mortality trends for this type of cancer show a reduction over the last three decades.18 However,
these analyses made use of rates which summarized age and period of death, without considering the effect of the birth cohort, an important factor in understanding the evolution of diseases.4,6,15
The age effect represents changes in rates associated with age. The incidence and mortality from chronic illness increase with age.4,6,7,15
Period effect refers to changes in incidence and mortality due to events occurring at specifi c periods, simultaneously affecting all age groups. Cohort effect is provoked by factors which affect a generation and promote changes of different rates of magnitude in successive age groups and successive periods. Allowing us to evaluate the risk associated with habits and expo-sures of long duration.4,6,7,15
Using age-period-cohort(APC) models enables period and cohort effects to be separated4,6,7,15 and to identify
whether changes in mortality rates are correlated with alterations in the level of exposure to the HPV virus (cohort effect) and to co-factors associated with the persistence of lesions caused by the virus or to changes in specifi c preventative measures (period effect). This study aimed to estimate the age, period and birth cohort effect (APC) on mortality from cervical cancer.
INTRODUCTION
METHODS
Information on deaths from cervical cancer, cancer of the uterine body and cancer of the uterus, part unspecifi ed, in women aged ≥ 30 in Rio de Janeiro, and Sao Paulo, in Southeastern, Brazil, were included in this study. The data were taken from the Mortality Information System (SIM/DATASUS). The popula-tion data were obtained from DATASUS, based on population censuses from 1980, 1991, 2000 and 2010. Projections for intercensal populations for 1st July of the
census years were estimated by the Instituto Brasileiro de Geografi a e Estatística (IBGE).
The city of Sao Paulo was chosen as the state of Sao Paulo was the fi rst place in Brazil where screening using Pap smears was implemented. The city of Rio de Janeiro was chosen as it is the second largest city in the country, it is located in the Southeast and has similar socio-economic conditions to Sao Paulo.
In the period in which the study took place there were two revisions of the International Statistical Classifi cation of Diseases and Related Health Problems (ICD) underway. In the ninth version, the three digit character for cervical cancer was 180; for cancer of the uterus, part unspecifi ed 179; and for cancer of the body of uterus, 182. The codes from the tenth revision were C53, C55 and C54 respectively. Deaths classifi ed as cancer of the uterus, part unspecifi ed, were redistributed as cervical cancer and cancer of the uterine body according to the proportions of death certifi cates originally registered for each category for cause, year and age group. Specifi c mortality rates were calculated according to age groups and mortality rates standardized by the direct method after redistribution using the world standard population as proposed by Segi.5 The redistribution was carried out by correcting
cervical cancer mortality rates, considering the large proportion of deaths classifi ed as cancer of the uterus, part unspecifi ed.
The Estimated Annual Percent Change (EAPC) was calculated based on the equation:. in which m was estimated based on the regression model in which the logarithm of mortality rates was the dependent variable and the calendar year the independent variable. This calculation assumes that the rate increases or decre-ases in a linear fashion year on year, during the entire interval in question. The EAPC was calculated for two consecutive periods: 1980-1994 and 1995-2009.
value of the logarithm of the ratio is a linear function of the age, period and cohort effect:4,6,7,15
in which denotes the expected mortality rate at age iin the period j, the expected number of deaths at age iin period j, and denotes the population at risk of death at age i in period j: μ represents the mean effect, repre-sents the age group effect i, represents the period effect jand the cohort effect k.
The age groups used were grouped by fi ve year inter-vals, starting at 30-34 and ending at 75 and over, making a total of ten age groups. The period were also grouped by fi ve year intervals, making six periods (1980 to 1984, 1985 to 1989, 1990 to 1994, 1995 to 1999, 2000 to 2004 and 2005 to 2009) and the birth cohorts started at 1900 and fi nished in 1979, making a total of 15 cohorts. The main problem with estimating the parameters of the APC affect is the exact linear relationship between
the age, period and cohort factors, which impedes esti-mation of the complete model. Various methodologies have been proposed to resolve this problem; however, no consensus exists in the literature. It was decided to estimate the parameters of the APC effect using estimable functions: deviations, curves and drift.4,6,7,15
The estimable functions limit the analysis of the effects to their linear combinations and curves. The curves are estimable functions of the parameters and remain constant regardless of the parameterization used.4,6,7,15
The linear trend of the effects is divided into two components: the fi rst is the linear effect of age and the other is the so-called drift, the linear effect of the cohort period.4,6,7,15 The longitudinal tendency of age is equal
to the sum of age and the gradient of period. in which and are the linear trend of age and of period respecti-vely. Drift represents the linear trend of the logarithm of the rates specifi c to age. It is equal to the sum of the gradients of period and cohort.in which and are the linear trends for period and cohort, respectively.4,6,7,15
Birth cohort
Municipality of Rio de Janeiro
Municipality of Sao Paulo
Mortality r
ate
Age group
75 e + 70-74 65-69 60-64 55-59 50-54 45-49 40-44 60.00
50.00
40.00
30.00
20.00
10.00
0.00
1905-19091910-19141915-19191920-19241925-19291930-19341935-19391940-19441945-19491950-19541955-19591960-19641965-19691970-19741975-1979
1905-19091910-19141915-19191920-19241925-19291930-19341935-19391940-19441945-19491950-19541955-19591960-19641965-19691970-19741975-1979
Mortality r
ate
35-39 30-34
Age group 75 e + 70-74 60.00
50.00
40.00
30.00
20.00
10.00
0.00
65-69 60-64 55-59 50-54 45-49 40-44 35-39 30-34
Figure 1. Cervical cancer mortality rates by birth cohort and age for deaths in the municipalities of Rio de Janeiro, and Sao
For this methodology, a cohort and a period were chosen as reference. The specifi c rates for age and cohort/ period of reference will be the RR (relative risk) of each cohort compared to the reference cohort and of each period compared to the reference period. It is advisable to choose central cohorts, as they was more complete than the fi rst and last birth cohorts.4,6,7,15 In this article,
the 196-1964 cohort was used as the reference. The RR of the birth cohorts were adjusted for age and period effect and the RR of the period for birth cohort and age effect. These measures of association and their respec-tive confi dence intervals (95%CI) were calculated using Epi 1.1.18a (R statistic program, version 2.7.2).
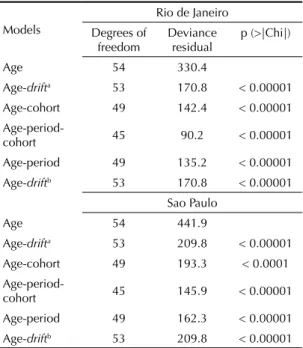
The quality of fi t was assessed using deviance statistics, defi ned as two times the logarithm of the estimated like-lihood function of the model. The contribution of the effects was assessed by comparing the deviance of the model with the specifi c effect compared to the complete model (age-period-cohort). Results with p ≤ 0.05 were considered signifi cant. The tests were carried out using the R statistic program version 2.7.2, through the Epi 1.1.18 library,a as shown in Figures 1 and 2.
Figure 1 shows mortality rates by birth cohort for each age group. Figure 2 shows the effects of age, period and birth cohort based on the complete model. To the left, the mortality rates per 100,000 women by age are shown. The fi gure to the right of that shows the RR of the periods, adjusted for birth cohort and age effect and RR of birth cohorts adjusted for age and period in which death occurred.
RESULTS
Between 1980 and 2009 there were 9,995 deaths from cancer of the uterus in women aged over 30 in the municipality of Rio de Janeiro (MRJ), and 14,158 in the municipality of Sao Paulo (MSP). Deaths from cervical cancer were predominant in both cities (49.7% in MRJ and 51.9% in MSP).
The mortality rate from cervical cancer in MRJ was 10.76/100,000 women, and from cancer of the uterine body, 2.93/100,000 and for cancer of the uterus, part unspecifi ed, 6.98/100,000 women. In MSP these fi gures were 11.45/100,000, 3.92/100,000 and 2.98/100,000 women respectively.
After redistributing the deaths classifi ed as being from cancer of the uterus, part unspecifi ed, mean mortality rates of 15.90/100,000 women from cervical cancer and 5.13/100,000 from cancer of the uterine body in MRJ and 15.87/100,000 and 5.75/100,000 women, respectively, in MSP.
The highest mortality rates in the two cities from this neoplasia were observed between 1980 and 1984, the rates declined between 1985 and 1989, although they rose again in the period 1990 and 1994. From 1995 to 1999 onwards there was a decrease in the mortality rates, a trend which continued until 2005 to 2009. This fi ve-year-period had the lowest levels in the series studied (Table 1).
20
10
5
2
1
20
10
5
2
1 10
5
2
1
30 40 50 60 70 80 1920 1940 1960 1980 2000 2020 30
Age
Mortality r
ate
RR
Birth cohort Period Age Birth cohort Municipality of Sao Paulo Municipality of Rio de Janeiro
Period 40 50 60 70 80 1920 1940 1960 1980 2000 2020
10
5
2
1
Figure 2. Results of the Age-period-cohort model, adjusted for cervical cancer mortality in the municipalities of Rio de Janeiro,
and Sao Paulo, in Southeastern Brazil, 1980 to 2009.
The highest mortality rates were in women born between 1900 and 1940, over 20.0 deaths per 100,000 women aged up to 50-54 years old, in both cities. The mortality rates decreased in the younger age groups in each birth cohort, these being under 10.0 deaths per 100,000 in women born after the 1950s and in the age group 40 to 44 (Figure 1).
There was an overall decrease in cervical cancer morta-lity rates in both cities in the EAPC. The EAPC between 1980 and 1994 was -1.20% (95%CI -2.20;-0.09) and -2.58% (95%CI -3.41;-1.76) in MRJ between 1995 and 2009. In Sao Paulo, this was -1.46% (95%CI -2.30;-0.61) and -3.30% (95%CI -4.30;-2.29), respecti-vely. Variations in the age groups showed that the MSP had a greater number of age groups with a statistically signifi cant decrease, compared with MRJ (Table 2). Both age-cohort and age-period models showed better fi t to the data than the models containing just age and
age-drift. The complete model was signifi cantly better than that with only two factors AP (p < 0.0001) and AC (p < 0.0001). The AC model had as null hypothesis the lack of infl uence of period effect on mortality rates. And the AP model had as null hypothesis the lack of infl uence of the birth cohort effect (Table 3)
In both cities, there was a progressive increase in cervical cancer mortality rates with age (Figure 2).
In MRJ, a reduced risk of death compared to the refe-rence period (1990 to 1994) was observed between 1985 and 1989 (RR = 0.93; 95%CI 0.89;0.97). There was an increased risk in the 1990s, with the highest value between 1995 and 1999 (RR = 1.12; 95%CI 1.04;1.20), which again decreased in the 2000s, and the lowest value was between 2005 and 2009 (RR = 0.86; 95%CI 0.83;0.92). The period between 1985 and 1989 had RR = 1.04 (95%CI 1.01;1.08) in MSP; there was increased risk in the 1990s, reaching a peak between
Table 1. Mortality from cervical cancer (per 100,000 women), in the municipalities of Rio de Janeiro and Sao Paulo, Southeastern
Brazil, 1980 to 2009.
Age group (years) Rio de Janeiro
1980 to 1984 1985 to 1989 1990 to 1994 1995 to 1999 2000 to 2004 2005 to 2009
30 to 34 3.60 4.24 3.60 3.31 3.46 3.21
35 to 39 6.91 6.21 9.29 7.40 5.00 6.02
40 to 44 11.20 8.37 9.31 10.40 9.54 9.64 45 to 49 17.99 13.05 16.51 14.14 16.15 12.78 50 to 54 19.53 21.63 22.25 18.40 17.87 12.78 55 to 59 20.40 26.02 23.66 21.13 17.57 15.09 60 to 64 29.38 22.14 25.25 29.05 21.82 17.28
65 to 69 34.64 28.57 31.99 24.60 25.43 22.03 70 to 74 26.76 18.51 18.37 16.70 17.01 17.62 75 + 31.25 23.41 21.05 30.71 22.02 15.21 Ratea 17.16 15.03 16.23 15.29 13.78 11.70
Age group (years) Sao Paulo
1980 to 1984 1985 to 1989 1990 to 1994 1995 to 1999 2000 to 2004 2005 to 2009
30 to 34 2.98 3.18 2.58 2.38 2.25 2.37
35 to 39 6.43 5.27 4.69 5.21 4.58 3.79
40 to 44 12.80 9.54 9.03 9.77 7.93 8.10
45 to 49 15.32 14.33 17.45 14.44 12.65 10.32 50 to 54 22.61 18.80 21.05 19.67 16.46 12.23 55 to 59 30.55 23.43 25.04 23.20 21.54 16.94 60 to 64 35.26 28.26 22.88 20.83 22.84 16.31
65 to 69 36.41 30.51 30.76 31.25 25.56 20.21 70 to 74 25.78 24.80 24.67 28.65 22.41 25.55 75 + 24.45 24.87 24.68 29.74 22.83 20.30 Ratea 18,43 15,58 15,69 15,36 13,44 11,68
Source: Mortality Information System (SIM/DATASUS), Ministério da Saúde
Rate standardized using the direct method, with a reference population of the world population proposed by Segi and each modifi ed by Doll et al5 and corrected using proportional redistribution of the deaths classifi ed as from cancer of the uterus,
1995 and 1999 (RR = 1.22; 95%CI 1.15;1.31), which then fell and continued to do so until 2009 (RR =1.02; 95%CI 0.97;1.07) (Figure 2).
Analysis of mortality in birth cohorts shows an accentu-ated tendency for risk of death to decrease in successive birth cohorts. There was a high risk of death from this neoplasia for women in both cities between 1900 and 1940. The 1900-1940 birth cohort had an RR = 3.30 (95%CI 2.78;3.86) in MRJ and RR = 2.40 (95%CI 2.05;2.80) in MSP. In both cities, there was a reduction in the rate for the 1930 to 1934 cohort (RR = 1.47; 95%CI 1.33;1.62) in MRJ and in MSP (RR = 1.57; 95%CI 1.45;1.72). After this decade, there was a progressive decrease in the risk of death, becoming < 1 in women born after the reference birth cohort (1960 to 1964); the lowest value was seen in women born in the 1975 to 1979 cohort. In MRJ, the RR was 0.89 (95%CI 0.81;0.96) and in MSP, was 0.85 (95%CI 0.78;0.95) (Figure 2).
DISCUSSION
This study showed a signifi cant difference in mortality from cervical cancer in both cities during the period in question, a signifi cant period effect (national program for controlling cervical cancer) in reducing the risk of death. Lower RRs were observed after the 2000s, above all in women born after the 1960s.
Evaluating the risk of death from cervical cancer according to birth cohort showed that women born between 190 and 1920 had a high risk of death from this neoplasia. Birth cohorts after 1930 a progressively reduced risk of death, with a protective effect (RR < 1) for women born after 1960.
Between 1900 and 1920, cancer was seen as an incu-rable disease and there were no secondary preventative practices. This may explain the higher risk of death when compared with more recent birth cohorts.1,20
Among women in the 1930 to 1940 birth cohort, the introduction of measures to care for and prevent cancer may have had some infl uence on mortality rates. In the 1940s, pioneering work among health care profes-sionals started to bring the practice of cytology and
Table 2. Estimated annual percentage variation (EAPC) of
cervical cancer mortality rates, in the municipalities of Rio de Janeiro, and Sao Paulo, in Southeastern Brazil, 1980 to 2009.
Age group (years)
Rio de Janeiro
1980 to 1994 1995 to 2009
EAPC% 95%CI EAPC% 95%CI 30 to 34 1.73 -3.90;7.70 -0.29 -3.98;3.54 35 to 39 1.55 -3.00;6.30 -4.85 -9.76;0.33 40 to 44 -14.09 -54.34;61.64 -1.08 -3.07;0.96 45 to 49 -0.99 -4.77;2.93 0.46 -1.74;2.70 50 to 54 0.12 -2.46;2.77 -0.30 -3.82;3.35 55 to 59 1.44 -1.69;4.67 -0.82 -2.80;1.20 60 to 64 -1.82 -3.90;0.30 -5.39a -7.15;-3.60
65 to 69 -1.58 -5.41;2.41 -1.67 -5.16;1.95 70 to 74 -2.85 -6.69;1.14 -3.10 -6.19;0.09 75 + -3.60a -5.13;-2.05- -7.36a -9.21;-5.48
Annual -1.20a -2.29;-0.09 -2.58a -3.41;-1.76
Age group (years)
Sao Paulo
1980 to 1994 1995 to 2009
EAPC% 95%CI EAPC% 95%CI 30 to 34 -1.03 -4.48;2.55 0.51 -2.78;3.90 35 to 39 -3.19 -7.34;1.14 -3.51a -6.62;-0.29
40 to 44 -3.40a -5.21;-1.55 -1.64 -3.67;0.43
45 to 49 2.24 -1.68;6.33 -2.87a -5.33;-0.35
50 to 54 -0.81 -3.53;1.99 -4.14a -5.67;-2.59
55 to 59 -2.39a -4.60;-0.13 -2.11 -4.33;0.16
60 to 64 -3.86a -5.77;-1.91 -2.12 -4.40;0.22
65 to 69 -1.76 -3.57;0.08 -3.83a -6.12;-1.48
70 to 74 -0.66 -3.36;2.11 -4.83a -7.41;-2.19
75 + 0.15 -2.80;3.19 -4.61a -7.09;-2.06
Annual -1.46a 2.30;-0.61 -3.30a -4.30;-2.29 a EAPC: Statistically different from zero (two-tailed Student
t test p 0.05)
Table 3. Adjustments to the models of age-period-cohort
effects, for mortality from cervical cancer in the municipalities of Rio de Janeiro, and Sao Paulo, in Southeastern Brazil, 1980 to 2009.
Models
Rio de Janeiro
Degrees of freedom
Deviance residual
p (>|Chi|)
Age 54 330.4
Age-drifta 53 170.8 < 0.00001
Age-cohort 49 142.4 < 0.00001
Age-period-cohort 45 90.2 < 0.00001
Age-period 49 135.2 < 0.00001 Age-driftb 53 170.8 < 0.00001
Sao Paulo
Age 54 441.9
Age-drifta 53 209.8 < 0.00001
Age-cohort 49 193.3 < 0.0001
Age-period-cohort 45 145.9 < 0.00001 Age-period 49 162.3 < 0.00001 Age-driftb 53 209.8 < 0.00001 a Linear trend of the logarithm of the specifi c rates for Age
over time is equal to the sum of the gradients for do tempo period and cohort , when and are the linear trend for period and cohort, respectively.
b Longitudinal trend of Age is equal to the sum of Age and
low mortality rates found there were associated with becoming sexually active at a later age, a reduced number of sexual partners, delayed widespread use of hormonal contraceptives as well as the fact that adultery was criminalized until 1976. Campaigns to combat cervical cancer were regionalized and, in the period studied, only covered a small part of the female population.10,11
One of the limitations of this study was the quality of information, bearing in mind the large number of deaths classifi ed as “cancer of the uterus, part unspecifi ed”, especially in the fi rst years of the series studied. An attempt was made to correct this problem by redis-tributing these deaths according to the proportion of certifi cates registered for each category by age and year of death.
Another limitation concerns the APC models, which are still in development. The results obtained vary according to the assumptions used in constructing the models. In the last decade, articles have been published discussing methodological aspects in the specifi cations of the models and in resolving the problem of not iden-tifying the complete model.8,a
The Poisson model assumes the equality of mean and variance, diffi cult to achieve in practice, and variance is generally greater than the mean. This phenomenon is known as overdispersion and, when not detected and corrected, leads to an incorrect estimation of standard deviation and, consequently, an incorrect assessment of the signifi cance of the parameters. In the analyses in this study, the Poisson models were adjusted because the adjusted results for this distribution did not differ from those obtained from the negative binomial.
This study showed the importance of establishing and consolidating the NCCC Pin reducing the risk of death from cervical cancer, even in women with greater expo-sure to risk factors for this neoplasia. There was a protec-tive effect (RR < 1) for women born after the 1960s, who were infl uenced by the sexual and cultural revolution which began in this decade (cohort effect) and underwent changes in lifestyle which increased their exposure to risk factors associated with this type of cancer.20,21 The
possible increased risk of infection with the HPV virus did not have a greater repercussion on mortality due to the existence of effective protective measures.
colposcopy to Brazil. These preventative and curative measures only reached a small group of the population, as at that time public health care resources prioritized the prevention and treatment of infectious diseases.1,20
The protective effect observed in women born after the 1960s may be related to intensifi ed efforts to prevent and control this neoplasia with the establishing of the PNCCC at the end of the 1990s. This program incre-ased the number of screening tests carried out annually by the Brazilian Unifi ed Health System (SUS) by 81% between 1995 and 2003.20
There was an increase in the risk of death from this neoplasia during the 1990s, peaking between 1995 and 1999 in both MRJ and MSP, which then declined after 2000 and continued to decline until 2009.
The increased cervical cancer mortality rate in the 1990s may be related to low levels of coverage for the cytology tests at the beginning of the decade. In 1994, 37% of Brazilian women aged 35 to 49 had never had a smear test, in the Southeast the fi gure was 32%.b After the
NCCCP was established in 1998, availability and access to these tests increased. Data from the National Research by Household Survey (PNAD) between 2003c and 2008d
estimated coverage of 68.7% and 84.5% for protective gynecology in women aged over 25, respectively.
Decreasing mortality rates for this neoplasia related to the effect of the program for prevention and control of cervical cancer (period effect), indicated in this study, are similar to those of other studies carried out in the United Kingdom (1950-1997),16 Switzerland
(1953-1995)2 and in the state to Minas Gerais,
Southeast, (1980-2005).1 The authors of these studies
unanimously interpret the results of these studies as best explained by the establishment of a program of screening for cancer than as a birth cohort effect.
These results do not agree with those observed in Shandong, China (1970-1992),10 and in Spain
(1951-1991),11 as the reduction in mortality rates was related
to cohort effect in function of lowered exposure to risk factors related to this type of cancer. This hypothesis is coherent, considering that in China, brothels were closed, prostitution banned and the single child per couple policy instituted. In the same way, in Spain, before 1975 the
b Ministério da Saúde. Instituto Nacional de Câncer. Viva Mulher – Programa Nacional de Controle do Câncer do Colo Uterino. Brasília (DF); 1996.
c Instituto Brasileiro de Geografi a e Estatística. Pesquisa Nacional por Amostra de Domicílios (PNAD) 2003 – Acesso e utilização dos serviços de saúde. Brasília (DF); 2011 [cited 2010 Oct 20]. Available from: http://www.ibge.gov.br/home/estatistica/populacao/trabalhoerendimento/ pnad2003/saude/saude2003.pdf
1. Alves CMM, Bastos RR, Guerra MR. Mortality due to cancer of the uterine cervix in the state of Minas Gerais, Brazil, 1980-2005: period and cohort analysis.
Cad Saude Publica. 2010;26(7):1446-56. DOI: http:// dx.doi.org/10.1590/S0102-311X2010000700024
2. Bergström R, Sparén P, Adami HO. Trends in cancer of the cervix uteri in Sweden following cytological screening. Br J Cancer.1999;81(1):159-66. DOI: http://dx.doi.org/10.1038/sj.bjc.6690666
3. Bosseti C, Malvezzi M, Chatenoud L, Negri E, Levi F, La Veccia C. Trends in cancer mortality in Americas, 1970 a 2000. Ann Oncol. 2005;16(3):489-511. DOI: http://dx.doi.org/10.1093/annonc/mdi086
4. Clayton D. Schiffl ers E. Models for temporal variation in cancer rates I: period and Age-Cohort models. Stat Med. 1987;6(4):449-67. DOI: http://dx.doi.org/10.1002/sim.4780060405
5. DOLL R, Payne P, Waterhouse JAH. Cancer incidence in fi ve continents: a technical report. Berlin: Springer-Verlarg; 1966.
6. Holford TR. The estimation of age, period and cohort effects for vital rates. Biometrics.1983; 39(2):311-324. DOI: http://dx.doi.org/10.2307/2531004
7. Holford TR. Undestranding the effects of age, period, and cohort on incidence and mortality rates. Annu Rev Public Health. 1991;12(1):425-57. DOI: http://dx.doi. org/10.1146/annurev.pu.12.050191.002233
8. Holford TR. Approaches to fi tting age-period-cohort models for the Lexis diagram. Stat Med.
2006;26(1):3018-45.
9. Levi F, Boffetta P, Lucchini F, Negri E, La Vecchia C. Cervical Cancer mortality in young women in Europe: patterny and trends. Eur J Cancer. 2000;36(17):2266-71. DOI:
http://dx.doi.org/10.1016/S0959-8049(00)00346-4
10. Li H, J S, Xu H, Thomas B. The decline in the mortality rates of cervical cancer and plausible explanation in Shandong, China. Int J Epidemiol. 2000;29(3):398-404. DOI: http://dx.doi.org/10.1093/ije/29.3.398
11. Llorca J, Prieto M D, Delgado-Rodriguez M. Increase in cervical cancer mortalility in Spain 1951-1991. J Epidemiol Community Health. 1999;53(7):408-11. DOI: http://dx.doi.org/10.1136/jech.53.7.408
12. Martins LFL, Thuler LC, Valente JG. Cobertura do exame de Papanicolauo no Brasil e seus fatores determinantes: uma revisão da literatura. Rev Bras Ginecol Obstet. 2005;27(8):485-92. DOI: http://dx.doi. org/10.1590/S0100-72032005000800009
13. Osis MJMD. Paism: um marco na abordagem da saúde reprodutiva no Brasil. Cad Saude Publica.
1998;14Suppl 1:25-32. DOI: http://dx.doi.org/10.1590/ S0102-311X1998000500011
14. Parkin DM, Bray F, Ferlay J, Pisani P. Global cancer statiscs, 2002. CA CancerJ Clin. 2005;55(1):74-108. DOI: http://dx.doi.org/10.3322/canjclin.55.2.74
15. Robertson B, Boyle P. Age period-cohort analysis of chronic disease rates I: Modelling approach. J Start Med. 1998;17(12):1305-23. DOI: http://dx.doi. org/10.1016/S0895-4356(99)00033-5
16. Sasiene P, Adams J. Effect of screening on cervical cancer mortality in England and Wales: analysis of trend with an age, period and cohort model.
BMJ.1999;318(7193):1244-5. DOI: http://dx.doi. org/10.1136/bmj.318.7193.1244
17. Saslow D, Castle PE, Cox JT, Davey DD, Einstein MH, Ferris DG, et al. American Cancer Society Guideline for Human Papillomavirus (HPV) Vaccine Use to Prevent Cervical Cancer and Its Precursors. CA Cancer J Clin. 2007;57(1):7-28. DOI: http://dx.doi.org/10.3322/canjclin.57.1.7
18. Silva AG, Girianelli VR, Guamarra CJ, Bustamante-Teixeira MT. Cervical cancer mortality trends in Brazil, 1981-2006. Cad Saude Publica.
2010;26(12):2339-407. DOI: http://dx.doi. org/10.1590/S0102-311X2010001200018
19. Taplin SH, Ichikawa L, Yood MU, Manos MM, Geiger AM, Weinmann S, et al. Cervical cancer in women with comprehensive health care acess: attributable factors in screening process. J Natl Cancer Inst. 2005;97(9):675-83. DOI: http://dx.doi.org/10.1093/jnci/dji115
20. Teixeira AL, Löwy I. Imperfect tools for a diffi cult job: Colposcopy, “colpocytogy” and screening for cervical cancer in Brazil. Soc Stud Sci. 2011;41(4):586-608. DOI: http://dx.doi.org/10.1177/0306312711408380
21. Zeferino LC, Costa AM, Panetta K, Neves-Jorge J. Screening da neoplasia cervical. J Bras Ginecol.1996;106(11/12):415-9.
REFERENCES