DOI: 10.5935/2359-4802.20170060 Mailing Address: Helen Hermana Miranda Hermsdorff
Universidade Federal de Viçosa, Departamento de Nutrição e Saúde. Avenida PH Rolfs s/n Campus Universitário. Postal Code: 36570-900, Viçosa, MG – Brazil E-mail: [email protected]
Are Body Fat and Uric Acid associated with Cardiovascular Risk Scores? Cross-Sectional
Analysis in the PROCARDIO-UFV Trial
Juliane Soares Rodrigues, Alinne Paula de Almeida, Carla de Oliveira Barbosa Rosa, Helen Hermana Miranda Hermsdorff Universidade Federal de Viçosa, Viçosa, MG – Brazil
Manuscript received October 31, 2016; revised manuscript February 24, 2017; accepted March 01, 2017.
Abstract
Background: Risk scores are tools used to indicate the probability of occurrence of a certain cardiovascular event and to previously identify individuals at low, medium, and high risk for the development of cardiovascular diseases.
Objective: To establish the cardiovascular risk of users of a cardiovascular health attention program of a university, and assess its association with lifestyle, clinical, sociodemographic data, and other cardiometabolic risk markers.
Methods: Cross-sectional study with a sample of 197 participants. Demographic, anthropometric, clinical, and metabolic data, eating habits and lifestyle information were collected using the Global Risk Score and the Framingham Risk Score. P-value < 0,05 was considered statistically significant.
Results: According to the Framingham Risk Score, 84% of the assessed population was considered low risk and 16% as intermediate/high risk. However, according to the Global Risk Score, 18% of the participants were low risk, 45% were intermediate risk and 37% were high risk for infarction or death from coronary heart disease in 10 years.
Conclusion: Excess body weight and uric acid serum levels showed to be significant cardiovascular risk markers in addition to those of the score and, consequently, they should be considered in clinical practice. (Int J Cardiovasc Sci. 2017;30(4):313-324)
Keywords: Cardiovascular Diseases/mortality; Obesity; Uric Acid; Life Style; Risk Factors.
Introduction
According to the World Health Organization (WHO), cardiovascular diseases (CVD) accounted for 33% of deaths in Brazil in 2011.1 In Brazil, the cost of treating
chronic arterial diseases has a large budgetary impact on the health sector. Moreover, it is known that Risk Factors (RF) have great influence on CVD onset.2
Therefore, over the years, several studies were carried out and, based on them, different Risk Scores (RS) were created. To prevent underestimation or overestimation of the individual’s risk, some algorithms, based on regression analyses of population studies, have been created to identify individuals at low, medium, and high risk in advance.3 In 1948, the Framingham
Heart Study, of which objective was to identify the common factors or characteristics that contribute to CVD, led to the identification of the main RF for CVD: age, gender, systemic arterial hypertension (SAH), hypercholesterolemia, smoking, obesity, diabetes, and sedentary lifestyle.4
Another score used and recommended by the V B r a z i l i a n G u i d e l i n e o n D y s l i p i d e m i a a n d Atherosclerosis Prevention of 2013 is the Global Risk Score (GRS), which estimates the risk of myocardial infarction, cerebrovascular accident, peripheral vascular failure, or heart failure in 10 years.5 RS are low-cost and
From the nutritional point of view, it is important to identify the RF that influence CVD, to help with adequate diet intervention, both to prevent and treat them, whereas the RS allows an adequate intervention to improve the individual’s metabolism, lipid profile, and lifestyle, which associated with dietary therapy, may reduce the incidence and prevalence of new cardiovascular events.5
The present study aimed to establish the cardiovascular risk of the users of a cardiovascular health care program of a university, as well as to evaluate their association with lifestyle, clinical, and sociodemographic factors and other cardiometabolic risk markers.
Methods
Subjects
This is a cross-sectional study, with data collection between November 2012 and March 2016, based on a subsample of the Cardiovascular Health Care Program of Universidade Federal de Viçosa (PROCARDIO-UFV). PROCARDIO-UFV is a program that promotes nutritional and cardiovascular health intervention and education to the UFV community. The program’s inclusion criteria are: patients of both genders, age ≥ 20 years, being an UFV employee/employee’s spouse or offspring or UFV student, having been diagnosed with CVD or occurrence of cardiometabolic RF, such as excess weight (Body Mass Index - BMI ≥ 25 kg / m2); hypertriglyceridemia
(≥ 150 mg / dL); hypercholesterolemia (≥ 200 mg / dL), low HDL (men < 40 mg / dL and women < 50 mg / dL), blood pressure ≥ 130 / ≥ 85 mmHg or SAH diagnosis (systolic blood pressure - SBP ≥ 140 and / or Diastolic Blood Pressure - DBP ≥ 90 mmHg), fasting blood glucose ≥ 100 mg/dL or diagnosis of Diabetes Mellitus (DM) (fasting blood glucose ≥ 126 mg / dL) and / or medical referral. The program is registered in the Brazilian Registry of Clinical Trials (ReBEC) under the primary identifier RBR-5n4y2g.7
The data used were related to the first consultation. Of the 417 program users, 197 (116 women) were selected for having complete data on SBP, DBP, Total Cholesterol (TC), and fractions (HDL-c, LDL-C), triacylglycerols, age, presence or not of smoking and DM - all factors used in the evaluation of the assessed scores.
The study was approved by the UFV Ethics Committee on Human Research (Of. Ref. 066/2012/CEPH), on June 27, 2012, in accordance with Resolution 466/2012 of the National Health Council on research involving human
beings. All subjects who agreed to participate in the study signed the Free and Informed Consent form, in accordance with the Helsinki Declaration principles.
Sociodemographic and lifestyle variables
Sociodemographic and lifestyle variables were collected through the patients’ self-report and from medical records. Variables such as age, gender, marital status, and professional link with UFV were collected. Lifestyle variables included smoking (smokers or nonsmokers), regular physical activity (yes or no), and hours of sleep a day.
Anthropometric and body composition evaluation
Weight, height, and waist circumference were measured according to a protocol established in PROCARDIO-UFV.8 BMI was calculated by dividing
weight by squared height and classified according to the WHO criteria for adults.9 For the elderly, the classification
was made according to Lipschitz.10 For the classification
of abdominal obesity and cardiovascular risk, the criteria recommended by Alberti et al.11, WC ≥ 80 cm for women
and ≥ 90 cm for men, were used.
Percentage of Body Fat (%BF) (20/30 for men and women, respectively) was obtained through analysis of horizontal tetrapolar electrical bioimpedance (Biodynamics BIA 310 Model, Washington, USA), carried out with a standardized protocol.12
Biochemical and blood pressure evaluation
SBP and DBP levels were measured using a mechanical sphygmomanometer with a mercury column, according to the technique described in the VI Brazilian Hypertension Guidelines. SAH classification was also made according to the criteria of the VI Brazilian Hypertension Guidelines13, with a cutoff point ≥ 140 and
≥ 90 mmHg.13 The diagnosis of DM (fasting glycemia
≥ 126 mg / dL) followed the guidelines of the Report of The Expert Committee on Diagnosis and Classification of Diabetes Mellitus.14
For the metabolic evaluation, the following markers were analyzed: glucose, triacylglycerols, TC and fractions, Uric Acid (UA), platelets and leukocytes. LDL-c was calculated using Friedewald et al.’s equation.15 The criteria of the V Brazilian Guidelines
Adult Treatment Panel III (NCEP-ATP III) were used to classify these variables.5
Food survey assessment
The volunteers answered a questionnaire about food habits, in which they were asked about the consumption of salt (little, normal, too much), fat (type of fat consumed) and alcohol.
Risk stratification
The present study used the Framingham Risk Score (FRS) and the GRS stratification, according to the IV and V Brazilian Guidelines for Dyslipidemias and Prevention of Atherosclerosis, respectively.3,5
The values of TC and HDL-c for the classification of dyslipidemias were defined according to the V Brazilian Guideline on Dyslipidemias and Prevention of Atherosclerosis.5 Individuals were considered smokers
when they self-reported smoking.
Global Risk Score
The variables associated to the risk of developing CVD that were incorporated into the GRS are: SBP, smoking, TC, HDL-c, glucose intolerance, gender, and age. For the classification of PROCARDIO-UFV users according to the GRS, the following criteria were used: age (zero to +15 and zero to +12 points, respectively, for men and women), HDL-c (-2 to +2 points), TC (zero to +4 and zero to +5 points, respectively, for men and women), untreated SBP (-2 to +3 points and -3 to +5 points respectively for men and women), treated SBP (zero to +5 points and -1 to +7, respectively, for men and women), smoking (zero to +4 points and zero to +3 points respectively for men and women) and diabetes (zero to +3 points and zero to +4 points, respectively, for men and women).
According to the sum of the points obtained, each subject was assigned a percentage probability of having cardiovascular events. Individuals whose probability of having major cardiovascular events (coronary artery disease, cerebrovascular disease, peripheral obstructive arterial disease, or heart failure) in 10 years was less than 5% were considered as low risk. Those who were classified in this category and who reported a family history of premature CVD were reclassified to intermediate risk. Men with a calculated risk ≥ 5% and ≤ 20% and women with calculated risk ≥ 5% and ≤ 10%
of occurrence of any of the aforementioned events were considered as intermediate risk. Those with a calculated risk > 20% for men and > 10% for women over a 10-year period were considered as high risk.5
Framingham Risk Score
The assignment of points according to the FRS occurred according to the criteria of the Brazilian Society of Cardiology (SBC).3
For the classification of users of PROCARDIO-UFV using the FRS, age (-9 to +13 and -7 to +16 points, respectively, for men and women), TC (zero to +11 and zero to +13 for men and women, respectively), smoking (zero to +8 and zero to +9 points, for men and women respectively), HDL-c (-1 to 2 points for men and women) and untreated SBP (zero to 2 and zero to +4 points, respectively, for men and women) and treated SBP (zero to +3 and zero to +6 points, respectively, for men and women).
In the second phase of the calculation, after these steps, the points acquired were added up and the absolute risk in 10 years was obtained. Men who scored < 0 to 12 points were classified as low risk (< 10%); as intermediate risk (≥ 10% ≤ 20%) those who scored 13 to 15 points; and high risk (> 20%) those who scored more than 16 points. Women who scored < 9 to 19 points were classified as low risk (< 10%); as intermediate risk (≥ 10% ≤ 20%) those who scored 20 to 22 points; and high risk (> 20%) those who scored more than 23 points.
Statistical analysis
Data were shown as mean ± standard deviation, or as median (25th and 75th percentiles), according to the
normality of each variable, which was evaluated by the Kolmogorov-Smirnov normality test. The unpaired Student’s t tests and Analysis of Variance (ANOVA) followed by Tukey’s post hoc were used to compare the variables between the groups according to normality and the number of comparison groups. The chi-square test was used for comparison of frequencies. Statistical analyses were performed using the Statistical Package for Social Sciences (SSPS), version 20.0, and the level of statistical significance was set at 5%.
≥ 200 mg / dL (yes or no); hypertriglyceridemia if TG ≥ 150 mg/dL (yes or no); diabetes if fasting glycemia ≥ 126 mg / dL (yes or no); SAH if blood pressure ≥ 130 and ≥ 85 mmHg (yes or no); physical activity (yes or no); smoking (never smoked, used to smoke, yes); alcohol (never drink, drink occasionally, drink every day, others); salt consumption (normal, little, a lot, not reported); use of fat (lard, vegetable oil, all options); and hours of sleep (not reported, ≤ 4 hours, 4 to 6 hours, 6 to 8 hours, ≥ 8 hours).
Results
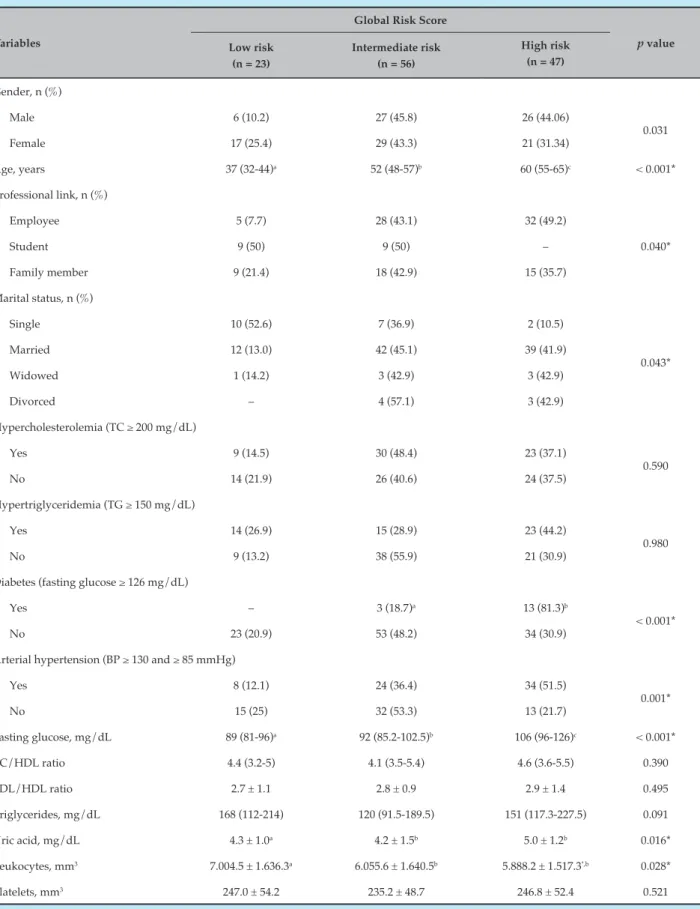
In our sample, 58.9% of the subjects were females (Tables 1 and 2). According to the calculated FRS, 16% of the population was of intermediate/high risk. However, according to the FRS, 37% of the population was at high risk of infarction or death from coronary disease in 10 years.
The median age for individuals with low risk at the FRS was 38 years (25-53) and for intermediate /high risk, 60 years (56.2-67.7) with p < 0.001. In the GRS, the low risk group was 37 years (32 to 44); intermediate risk, 52 years (48 to 57); and high risk, 60 years (55 to 65), with p < 0.001. As for the professional link with the university, in the FRS 100% of the students were classified as low risk (p < 0.05), but the GRS showed that 50% were in the high-risk group (p < 0.05). Regarding university employees, 39.1% were classified as intermediate / high risk according to the FRS and 49.2% as high risk according to the GRS. Regarding SAH, according to the FRS, 25.9% of the individuals who were hypertensive were classified as intermediate/ high risk, and according to the GRS, 51.5% were classified as high risk (p < 0.05).
The median fasting glycemia (mg/dL), according to the FRS for the individuals classified as intermediate / high risk, was 99.5 (91 to 115) and in the GRS, 106 (96 to 126) for high risk (p < 0.05). As for triglycerides (mg/dL), according to the FRS, the median values were 156.5 (119.3 to 252.7) for individuals at intermediate/high risk and, in the GRS, 151 (117.3 to 227.5) for individuals at high risk (p < 0.05). UA values were significantly high in the intermediate/high risk groups in both scores. The mean and standard deviation of the UA values (mg / dL) in the intermediate / high risk group according to the FRS were 5.4 ± 1.4 and according to the GRS, they were 5.0 ± 1.2 for the high group. In the GRS, 81.3% of diabetics were classified as high risk (p <0.05) (p < 0,05) (Tables 1 and 2).
Tables 3 and 4 are related to lifestyle and show that, according to the FRS, 30% of the smokers were classified as intermediate / high risk, and among those who smoked, 33.3% were also included in this risk group (p < 0.05). According to the GRS, 80% of the individuals who smoked were classified as high risk, and among those who used to smoke, 47.1% were classified as high risk (p < 0.05). Regarding the use of fats in FRS, 86% of the individuals using vegetable oil were classified as low risk (p < 0.05).
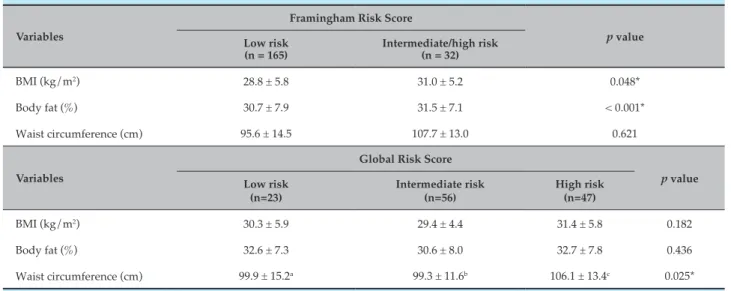
Regarding the nutritional status, among those classified according to the FRS as intermediate/high risk, 72.1% had excess weight (BMI ≥ 25 kg/m²), whereas in the GRS, 80.9% of individuals with excess weight were classified as high risk. Regarding abdominal obesity (WC ≥ 88/102 cm for women and men, respectively), in the FRS, 96.9% of the subjects were classified as intermediate/high risk, whereas in the GRS, 95.7% of those classified as high risk had abdominal obesity. Considering the excess body fat (BF% > 20/30 for men and women, respectively), a prevalence of 76.9% was found in the individuals in the intermediate / high risk group of the FRS and 71.4% in the GRS.
In the intermediate / high risk group of the FRS, the mean and standard deviation of the BMI (kg/m²) were higher when compared with the low-risk group (p < 0.05). According to this same score, BF% was also higher in the intermediate/high risk group, when compared to the low risk group (p < 0.05). In the high-risk group of the GRS, the mean WC was higher when compared to the other groups (p < 0.05). (Table 5)
Discussion
To know the prevalence of RF and assess the overall risk of developing CVD are crucial for effective prevention with the correct definition of therapeutic goals, aiming to minimize risks and maximize benefits.16
When comparing the risk stratification between the scores, it was observed that the risk distribution was higher in the GRS, whereas in the FRS, the number of individuals classified as low risk was very high, a fact that was also identified in the study by Oliveira et al.17
Table 1 – Demographic, clinical, and lifestyle characteristics, according to the Framingham Risk Score
Variables
Framingham Risk Score
p value Low risk
(n = 165)
Intermediate/high risk (n = 32)
Gender, n (%)
Male 56 (69.3) 25 (30.7)
< 0.001*
Female 109 (93.9) 7 (6.1)
Age, years 38 (25-53) 60 (56-68) < 0.001*
Professional link, n (%)
Employee 42 (60.9) 27 (39.1)
< 0.001*
Student 79 (100) –
Family member 43 (89.6) 5 (10.4)
Marital status, n (%)
Single 78 (97.5) 2 (2.5)
0.028*
Married 73 (72.3) 28 (27.7)
Widowed 6 (85.7) 1 (14.3)
Divorced 6 (85.7) 1 (14.3)
Hypercholesterolemia (TC ≥ 200 mg/dL)
Yes 86 (81.9) 19 (18.1)
0.453
No 79 (85.9) 13 (14.1)
Hypertriglyceridemia (TG ≥ 150 mg/dL)
Sim 67 (80.7) 16 (19.3)
0.296
Não 89 (86.4) 14 (13.6)
Diabetes (fasting glucose ≥ 126 mg/dL)
Yes 11 (68.7) 5 (31.3)
0.089
No 144 (85.2) 25 (14.8)
Arterial hypertension (BP ≥ 130 and ≥ 85 mmHg)
Yes 57 (74.1) 20 (25.9)
0.003*
No 108 (90) 12 (10)
Fasting glucose, mg/dL 89 (81-100) 99.5 (91-115) 0.004*
TC/HDL ratio 4.1 (3.4-4.9) 5.0 (4.0-6.0) 0.017*
LDL/HDL ratio 2.6 ± 1.0 3.2 ± 1.5 0.021*
Triglycerides, mg/dL 138.5 (100-199.7) 156.5 (119.3-252.7) 0.033*
Uric acid, mg/dL 4.4 ± 1.6 5.4 ± 1.4 0.001*
Leukocytes, mm3 6.382.9 ± 1.673.6 6.201.4 ± 1.661.1 0.601
Platelets, mm3 248.9 ± 51.8 239.72 ± 53.3 0.391
Table 2 – Demographic, clinical and lifestyle characteristics, according to the Global Risk Score
Variables
Global Risk Score
p value Low risk
(n = 23)
Intermediate risk (n = 56)
High risk (n = 47)
Gender, n (%)
Male 6 (10.2) 27 (45.8) 26 (44.06)
0.031
Female 17 (25.4) 29 (43.3) 21 (31.34)
Age, years 37 (32-44)a 52 (48-57)b 60 (55-65)c < 0.001*
Professional link, n (%)
Employee 5 (7.7) 28 (43.1) 32 (49.2)
0.040*
Student 9 (50) 9 (50) –
Family member 9 (21.4) 18 (42.9) 15 (35.7)
Marital status, n (%)
Single 10 (52.6) 7 (36.9) 2 (10.5)
0.043*
Married 12 (13.0) 42 (45.1) 39 (41.9)
Widowed 1 (14.2) 3 (42.9) 3 (42.9)
Divorced – 4 (57.1) 3 (42.9)
Hypercholesterolemia (TC ≥ 200 mg/dL)
Yes 9 (14.5) 30 (48.4) 23 (37.1)
0.590
No 14 (21.9) 26 (40.6) 24 (37.5)
Hypertriglyceridemia (TG ≥ 150 mg/dL)
Yes 14 (26.9) 15 (28.9) 23 (44.2)
0.980
No 9 (13.2) 38 (55.9) 21 (30.9)
Diabetes (fasting glucose ≥ 126 mg/dL)
Yes – 3 (18.7)a 13 (81.3)b
< 0.001*
No 23 (20.9) 53 (48.2) 34 (30.9)
Arterial hypertension (BP ≥ 130 and ≥ 85 mmHg)
Yes 8 (12.1) 24 (36.4) 34 (51.5)
0.001*
No 15 (25) 32 (53.3) 13 (21.7)
Fasting glucose, mg/dL 89 (81-96)a 92 (85.2-102.5)b 106 (96-126)c < 0.001*
TC/HDL ratio 4.4 (3.2-5) 4.1 (3.5-5.4) 4.6 (3.6-5.5) 0.390
LDL/HDL ratio 2.7 ± 1.1 2.8 ± 0.9 2.9 ± 1.4 0.495
Triglycerides, mg/dL 168 (112-214) 120 (91.5-189.5) 151 (117.3-227.5) 0.091
Uric acid, mg/dL 4.3 ± 1.0a 4.2 ± 1.5b 5.0 ± 1.2b 0.016*
Leukocytes, mm3 7.004.5 ± 1.636.3a 6.055.6 ± 1.640.5b 5.888.2 ± 1.517.3ª,b 0.028*
Platelets, mm3 247.0 ± 54.2 235.2 ± 48.7 246.8 ± 52.4 0.521
Table 3 – Lifestyle and food variables according to the Framingham Risk Score
Variable
Framingham Risk Score
p value Low Risk
(n=165)
Intermediate/High risk (n=32)
Physical activity, n (%)
Yes 91 (88.3) 12 (11.7)
0.093
No 74 (79.6) 19 (20.4)
Smoking status, n (%)
Never smoked 120 (92.3) 10 (7.7)
< 0.001*
Ex-smoker 38 (66.7) 19 (33.3)
Smoker 7 (70.0) 3 (30.0)
Alcohol consumption, n (%)
Never drinks alcohol 64 (85.3) 11 (14.7)
0.289
Drinks sporadically 93 (83.8) 18 (16.2)
Drinks everyday 3 (50) 3 (50)
Other 1 (100) –
Salt consumption n (%)
Normal 85 (85) 15 (15)
0.529
Little 52 (82.5) 11 (17.5)
A lot 23 (79.3) 6 (10.7)
Did not report 1 (100) –
Use of fats/oils, n (%)
Lard 1 (100) –
0.001*
Vegetable oil 153 (86.0) 25 (14.0)
All options 7 (50) 7 (50)
Hours of sleep, n (%)
Did not report 1 (50) 1 (50)
0.357
≤ 4 19 (95) 1 (5)
4-6 134 (83.2) 27 (16.8)
6-8 3 (60) 2 (40)
≥ 8 4 (80) 1 (20)
Data shown as frequencies. P value using Student’s t-test or chi-square test.
Both scores showed an evident association between age and coronary risk. The increase in both variables was proportional, which indicates the need to establish earlier and more frequent health promotion and prevention actions for cardiovascular diseases for the at-risk population, considering the trend towards increased
life expectancy and the resulting greater possibility of exposure to RF for CVD.18
The GRS and the FRS allowed a better visualization of variables related to the risk of developing coronary
Table 4 – Lifestyle and food variables, according to the Global Risk Score
Global Risk Score
p value Variable
Low risk (n = 23)
Intermediate risk (n = 56)
High risk (n = 47)
Physical activity, n (%)
Yes 13 (19.7) 31 (47.0) 22 (33.3)
0.436
No 10 (16.9) 25 (42.4) 24 (40.7)
Smoking status, n (%)
Never smoked 18 (25.7) 33 (47.2) 19 (27.1)
0.001*
Ex-smoker 5 (9.8) 22 (43.1) 24 (47.1)
Smoker – 1 (20) 4 (80)
Alcohol consumption. n (%)
Never drinks alcohol 21.7 (13) 41.7 (25) 36.7 (22)
0.360
Drinks sporadically 16.9 (10) 45.8 (27) 37.3 (22)
Drinks everyday – 1 (25) 3 (75)
Other – 1 (100) –
Salt consumption. n (%)
Normal 9 (16.4) 25 (45.4) 21 (38.2)
0.932
Little 10 (20) 24 (48) 16 (32)
A lot 4 (22.2) 5 (27.8) 9 (50)
Not reported – 1 (100) –
Use of oils/fats. n (%)
Lard 100 (1) – –
0.195
Vegetable oil 19 (17.4) 51 (46.8) 39 (35.8)
All options 3 (21.4) 3 (21.4) 8(57.2)
Hours of sleep. n (%)
Not reported – 1 (50) 1 (50)
0.915
≤ 4 1 (8.3) 6 (50) 5 (41.7)
4-6 22 (21.4) 43 (41.7) 38 (36.9)
6-8 – 2 (50) 2 (50)
≥ 8 – 1 (50) 1 (50)
Data shown as frequencies. P value using chi-square test. * p <0.05.
individuals exposed to cardiovascular risk as a target group for preventive cardiovascular actions at the individual and population levels.19
Increased levels of physical activity and specific dietary changes should be encouraged.20 Nutritional interventions
are effective in helping to reduce cardiovascular events
in high-risk individuals. Protective diets are based on
foods of plant origin in abundance (fruits, vegetables, whole grains, legumes, nuts, and others), olive oil and
Table 5 – Nutritional status according to cardiovascular risk scores
Variables
Framingham Risk Score
p value Low risk
(n = 165)
Intermediate/high risk (n = 32)
BMI (kg/m2) 28.8 ± 5.8 31.0 ± 5.2 0.048*
Body fat (%) 30.7 ± 7.9 31.5 ± 7.1 < 0.001*
Waist circumference (cm) 95.6 ± 14.5 107.7 ± 13.0 0.621
Variables
Global Risk Score
p value Low risk
(n=23)
Intermediate risk (n=56)
High risk (n=47)
BMI (kg/m2) 30.3 ± 5.9 29.4 ± 4.4 31.4 ± 5.8 0.182
Body fat (%) 32.6 ± 7.3 30.6 ± 8.0 32.7 ± 7.8 0.436
Waist circumference (cm) 99.9 ± 15.2a 99.3 ± 11.6b 106.1 ± 13.4c 0.025*
Data are shown as mean (standard deviation). P value using Student's t-test and Analysis of Variance (ANOVA). Median / mean followed by the same letter, in the same line, do not differ from each other at Tukey’s test at the 5% probability level. * p < 0.05. BMI: body mass index.
Moreover, higher values of BMI, %BF and WC were found in subjects with intermediate / high risk in both scores. According to Barbosa et al., the increase in morbidity and mortality due to chronic-degenerative diseases is associated with excess weight and fat deposits (mainly abdominal fat), favoring the occurrence of cardiovascular events - particularly coronary events.22
A study by Casanueva et al.23 showed that CVD frequency
increased in parallel with increased adiposity measured by BMI or WC. Moreover, abdominal obesity has been strongly associated with dyslipidemia and SAH.24
Ademais et al.25 found that the occurrence of obesity
due to BMI and %BF was significantly higher in those individuals with a hypertriglyceridemic waist phenotype. Hermsdorff et al.26 found that individuals with higher
WC and waist-to-hip ratio had higher concentrations of C-reactive protein (CRP), complement C3, interleukin 6 (IL6) and retinol-binding protein (p < 0.05).
In another study,27 the individuals with the
highest tertiles of trunk fat and WC had the highest concentrations of CRP and IL6, in addition to higher values of blood pressure, Homeostatic Model Assessment for Insulin Resistance (HOMA-IR) and LDL/HDL-c ratio (p < 0.05) – factors that, when associated, increase the chances for CVD.
In both scores, the presence of high values of fasting glycemia and SAH showed an increase that was proportional to the risk. The so-called “visceral
obesity” is associated with a higher mortality rate than peripheral obesity. This difference is due to the fact that visceral adipose tissue is metabolically more active than subcutaneous adipose tissue, causing, for instance, a high production of glucose and, consequently, type 2 DM and hyperinsulinemia. This higher secretion of insulin causes sodium retention, resulting in SAH.28
Interestingly, we found that in both the FRS and GRS, UA values were increased, as they developed from the RS. The acute increase in UA levels seems to be a protective factor to oxidative stress, and its chronic increase is associated with the risk of chronic noncommunicable diseases.29 Hyperuricemia has been
associated with the occurrence of metabolic syndrome, which is recognized as an important cardiovascular RF. However, the use of UA has been commonly ignored in clinical practice and in the context of RF; its inclusion as a variable for cardiovascular risk stratification may be interesting, since it is an easy-to-perform and low-cost exam that is useful in clinical practice.8,30
1. Soares TS, Piovesan CH, Gustavo Ada S, Macagnan FE, Bodanese LC, Feoli AM. Alimentary habits, physical actitivy, and Framingham global risk score in metabolic syndrome. Arq Bras Cardiol. 2014;102(4):374-82.
2. Andrade JP, Piva e Mattos LA, Carvalho AC, Machado CA, Oliveira GM. National physician qualification program in cardiovascular disease prevention and integral care. Arq Bras Cardiol. 2013;100(3):203-11.
3. Sposito AC, Caramelli B, Fonseca FA, Bertolami MC, Afiune Neto A, Souza AD, et al. [IV Brazilian Guideline for dyslipidemia and atherosclerosis prevention: Department of Atherosclerosis of Brazilian Society of Cardiology]. Arq Bras Cardiol. 2007;88 Suppl 1:2-19.
4. Lotufo PA. O escore de risco de Framingham para doenças cardiovasculares. Rev Med (São Paulo). 2008;87(4):232-7.
5. Xavier HT, Izar MC, Faria Neto JR, Assad MH, Rocha VZ, Sposito AC, et al; Sociedade Brasileira de Cardiologia. [V Brazilian Guidelines on Dyslipidemias and Prevention of Atherosclerosis]. Arq Bras Cardiol. 2013;101(4 Suppl 1):1-20.
6. Sampaio MR, Melo MB, Wanderley MS. Overall Cardiovascular Risk Stratification in Patients Enrolled at a Family Health Unit (USF) Maceió, Alagoas state, Brazil. Rev Bras Cardiol. 2010;23(1):47-56.
7. Registro Brasileiro de Ensaios Clínicos. [Internet]. Aplicação de diferentes estratégias de terapia nutricional no Programa de Atenção à Saúde Cardiovascular – PROCARDIO-UFV. RBR-5n4y2g. [Acesso em 2014 ago 8]. Disponível em: http://www.ensaiosclinicos.gov. br/rg/RBR-5n4y2g
8. Silva HA, Carraro JC, Bressan J, Hermsdorff HH. Relation between uric acid and metabolic syndrome in subjects with cardiometabolic risk. Einstein. 2015;13(2):202-8.
9. World Health Organization.(WHO). BMI Classification. Genéve; 2013.
10. Lipschitz DA. Screening for nutritional status in the elderly. Prim Care. 1994;21(1):55-67.
11. Alberti KG, Eckel RH, Grundy SM, Zimmet PZ, Cleeman JI, Donato KA, et al; International Diabetes Federation Task Force on Epidemiology and
References
Despite the low rate of smoking in the present study, smoking was significantly associated with coronary risk in both scores. It is known that smoking is a significant modifiable cardiovascular RF in the world’s population.29 According to Weiner et al.32, approximately
one in five CVD deaths are caused by smoking, which, alone, doubles the possibility of the disease and, when associated with TC or HAS, this risk is multiplied by four (it becomes eight-fold higher when all three factors are combined).
The present study has limitations. As a cross-sectional study, it is not possible to infer a cause-effect association for the results. Furthermore, to calculate the scores, a group of variables was necessary, which were not always available in the medical records of all users. However, in the literature, few Brazilian studies perform the calculation of these scores to identify risk in patients with cardiometabolic risk.
Conclusion
The scores showed a difference in the risk distribution. Excess body weight and uric acid values were shown to be important markers of cardiovascular risk in addition to those present in the score. The need for further research on the subject and the development of more specific risk scores for each population was evident.
Acknowledgements
We thank the users of PROCARDIO-UFV, who allowed their data to be used in the study, the professionals and
the voluntary trainees of the program. We would also like to thank the Pro-Rectory of Extension and Culture (PEC/UFV), for the university extension grant given to JS Rodrigues, and Coordenação de Aperfeiçoamento de Pessoal de Nível Superior (CAPES), for the grant given to AP Almeida. HHM Hermsdorff is a Research Productivity Fellow of Conselho Nacional de Desenvolvimento Científico e Tecnológico (CNPq).
Author contributions
Conception and design of the research: Hermsdorff HHM. Acquisition of data: Rodrigues JS, Almeida AP, Hermsdorff HHM. Analysis and interpretation of the data: Rodrigues JS, Almeida AP, Hermsdorff HHM. Statistical analysis: Rodrigues JS, Almeida AP, Hermsdorff HHM. Writing of the manuscript: Rodrigues JS, Almeida AP. Critical revision of the manuscript for intellectual content: Almeida AP, Rosa COB, Hermsdorff HHM.
Potential Conflict of Interest
No potential conflict of interest relevant to this article was reported.
Sources of Funding
There were no external funding sources for this study.
Study Association
Prevention; Hational Heart, Lung, and Blood Institute; American Heart Association; World Heart Federation.; International Atherosclerosis Society; International Association for the Study of Obesity. Harmonizing the metabolic syndrome: a joint interim statement of the International Diabetes Federation Task Force on Epidemiology and Prevention; National Heart, Lung, and Blood Institute; American Heart Association; World Heart Federation; International Atherosclerosis Society; and International Association for the Study of Obesity. Circulation. 2009;120(16):1640-5.
12. Vasquez AC, Rosado LE, Rosado GP, Ribeiro RC, Franceschini SC, Geloneze B, et al. Predictive ability of anthropometric and body composition indicators in the identification of insulin resistance. Arq Bras Endocrinol Metab. 2009;53(1):72-9.
13. Sociedade Brasileira de Cardiologia, Sociedade Brasileira de Hipertensão, Sociedade Brasileira de Nefrologia. [VI Brazilian Guidelines on Hypertension]. Arq Bras Cardiol. 2010;95(1 Suppl):1-51. Erratum in: Arq Bras Cardiol. 2010;95(4):553.
14. Report of the Expert Committee on the Diagnosis and Classification of Diabetes Mellitus. Diabetes Care. 1997;20(7):1183-97.
15. Friedewald WT, Levy RI, Fredrickson DS. Estimation of the concentration of low-density lipoprotein cholesterol in plasma, without use of the preparative ultracentrifuge. Clin Chem. 1972;18(6):499-502.
16. Mascarenhas CH, Reis LA, Souza MS. Avaliação do risco de doença coronariana em adultos e idosos no município de Lagêdo do Tabocal / BA. Arq Ciênc Saúde Unipar. 2009;13(1):15-20.
17. Oliveira AC, Ferreira RC, Santos AA. Cardiovascular risk assessment according to the Framingham score and abdominal obesity in individuals seen by a clinical school of nutrition. Rev Assoc Med Bras (1992). 2016;62(2):138-44.
18. Silva VR, Cade NV, Molina MC. Risco coronariano e fatores associados em hipertensos de uma Unidade de Saúde da Família. Rev Enferm UERJ. 2012;20(4):439-44.
19. Schaan BD, Harzheim E, Gus I. Cardiac risk profile in diabetes mellitus and impaired fasting glucose. Rev Saude Publica. 2004;38(4):529-36.
20. Block G, Azar KM, Romanelli RJ, Block TJ, Hopkins D, Carpenter HA, et al. Diabetes prevention and weight loss with a fully automated behavioral intervention by email, Web, and mobile phone: a randomized controlled trial among persons with prediabetes. J Med Internet Res. 2015;17(10):e240.
21. Ministério da Saúde. Secretaria de Atenção à Saúde. Departamento de Atenção Básica. Prevenção clínica de doenças cardiovasculares, cerebrovasculares e renais. Brasília;2006.
22. Barbosa LS, Scala LC, Ferreira MG. Association between anthropometric markers of body adiposity and hypertension in an adult population of Cuiabá, Mato Grosso. Rev Bras Epidemiol. 2009;12(2):237-47.
23. Casanueva FF, Moreno B, Rodríguez-Azeredo R, Massien C, Conthe P, Formiguera X, et al. Relationship of abdominal obesity with cardiovascular disease, diabetes and hyperlipidaemia in Spain. Clin Endocrinol (Oxf). 2010;73(1):35-40.
24. Oliveira AC, Ferreira RC, Santos, AA. Cardiovascular risk assessment according to the Framingham score and abdominal obesity in individuals seen by a clinical school of nutrition. Rev Assoc Med Bras (1992). 2016;62(2):138-44.
25. Oliveira JL, Lopes LL, Pelúzio MC, Hermsdorff HH. Hypertriglyceridemic waist phenotype and cardiometabolic risk in dyslipidemic subjects. Rev Bras Cardiol. 2014;27(6):395-402.
26. Hermsdorff HH, Zulet MA, Puchau B, Martinez JA. Central adiposity rather than total adiposity measurements are specifically involved in the inflammatory status from healthy young adults. Inflammation. 2011;34(3):161-70.
27. Hermsdorff HHM, Puchau B, Zulet MA, Martinez JA. Association of body fat distribution with proinflammatory gene expression in peripheral blood mononuclear cells from young adult subjects. OMICS. 2010;14(3):297-307.
28. Sugerman HJ. The pathophysiology of severe obesity and the effects of surgically induced weight loss. Surg Obes Relat Dis. 2005;1(2):109-19.
29. Gaffo AL, Edwards NL, Saag KG. Gout. Hyperuricemia and cardiovascular disease: how strong is the evidence for a causal link? Arthritis Res Ther. 2009;11(4):240.
30. de Oliveira A, Miranda Hermsdorff HH, Guedes Cocate P, Bressan J, Azevedo Novello A, Cardoso dos Santos E, et al. The impact of serum uric acid on the diagnostic of metabolic syndrome in apparently healthy Brazilian middle-aged men. Nutr Hosp. 2014;30(3):562-9.
31. Miranzi SS, Ferreira FS, Iwamoto HH, Pereira GA, Miranzi MA. Qualidade de vida de indivíduos com diabetes mellitus e hipertensão acompanhados por uma equipe de saúde da família. Texto Contexto Enferm. 2008;17(4):672-9.