Correspondence:
Thiago Luiz Nogueira da Silva Instituto de Estudos em Saúde Coletiva – UFRJ
Av. Horácio Macedo, s/n
Ilha do Fundão - Cidade Universitária 21941-598 Rio de Janeiro, RJ, Brasil E-mail: [email protected]
Received: 3 Oct 2015 Approved: 16 Nov 2015
How to cite: Silva TLN, Klein CH, Souza AM, Barufaldi LA, Abreu GA, Kuschnir MCC et al. Response rate in the Study of Cardiovascular Risks in Adolescents – ERICA. Rev Saude Publica. 2016;50(suppl 1):3s.
Copyright: This is an open-access article distributed under the terms of the Creative Commons Attribution License, which permits unrestricted use, distribution, and reproduction in any medium, provided that the original author and source are credited.
http://www.rsp.fsp.usp.br/
Response rate in the Study of Cardiovascular
Risks in Adolescents – ERICA
Thiago Luiz Nogueira da SilvaI, Carlos Henrique KleinII, Amanda de Moura SouzaI, Laura Augusta BarufaldiIII, Gabriela de Azevedo AbreuIV, Maria Cristina Caetano KuschnirV, Mauricio Teixeira Leite de VasconcellosVI, Katia Vergetti BlochI
I Instituto de Estudos em Saúde Coletiva. Universidade Federal do Rio de Janeiro. Rio de Janeiro, RJ, Brasil II Departamento de Epidemiologia. Escola Nacional de Saúde Pública Sérgio Arouca. Fundação Oswaldo Cruz.
Rio de Janeiro, RJ, Brasil
III Departamento de Vigilância de Doenças e Agravos Não Transmissíveis e Promoção da Saúde. Secretaria de Vigilância em Saúde. Ministério da Saúde. Brasília, DF, Brasil
IV Programa de Pós-Graduação em Saúde Coletiva. Instituto de Medicina Social. Universidade do Estado do Rio de Janeiro. Rio de Janeiro, RJ, Brasil
V Núcleo de Estudos da Saúde do Adolescente. Faculdade de Ciência Médicas. Universidade do Estado do Rio de Janeiro. Rio de Janeiro, RJ, Brasil
VI Escola Nacional de Ciências Estatísticas. Fundação Instituto Brasileiro de Geografia e Estatística. Rio de Janeiro, RJ, Brasil
ABSTRACT
OBJECTIVE: To describe the response rate and characteristics of people who either took part or not in from the Study of Cardiovascular Risks in Adolescents (ERICA) , according to information subsets.
METHODS: ERICA is a school-based, nation-wide investigation with a representative sample of 12 to 17-year-old adolescents attending public or private schools in municipalities with over 100,000 inhabitants in Brazil. Response rate of eligible subjects were calculated according to macro-regions, sex, age, and type of school (public or private). We also calculated the percentages of replacement schools in comparison with the ones originally selected as per the sample design, according to the types of schools in the macro-regions. he subjects and non-subjects were compared according to sex, age, and average body mass indices (kg/m²).
RESULTS: We had 102,327 eligible adolescents enrolled in the groups drawn. he highest percentage of complete information was obtained for the subset of the questionnaire (72.9%). Complete information regarding anthropometric measurements and the ones from the questionnaire were obtained for 72.0% of the adolescents, and the combination of these data with the 24-hour dietary recall were obtained for 70.3% of the adolescents. Complete information from the questionnaire plus biochemical blood evaluation data were obtained for 52.5% of the morning session adolescents (selected for blood tests). he response percentage in private schools was higher than the one in public schools for most of the combination of information. he ratio of older and male adolescents non-participants was higher than the ratio among participants.
INTRODUCTION
Brazil’s health investigations allow discovering the distribution and magnitude of diseases as well as the social, economic, and environmental factors inluencing them. hey are therefore essential to plan and monitor health care interventions7. Changes in Brazil’s epidemiological
pattern, characterized by the increased prevalence of chronic non-communicable diseases11,
reairm the importance of conducting speciic investigations to study these illnesses and their risk factors.
he Study of Cardiovascular Risks in Adolescents (ERICA) was developed to estimate the prevalence of metabolic syndrome and obesity in Brazilian adolescents and to outline the proile of risk factors for cardiovascular diseases, such as level of lipids, arterial blood pressure, inlammatory, and insulin resistance markers. Its database gathers several sets of information, a questionnaire, anthropometric measurements, dietary recall, and biochemical blood parameters, which serve to various purposes.
he response rate in epidemiological studies, regardless of study designs, has decreased throughout the years. Despite that, studies describing this response percentage and the characteristics of subjects and non-subjects are scarce8,9,14. he higher the response rate in
a study, the lower the probability of results being afected by the compromising of internal validity due to self-selection biases4,8.
his study aimed to describe the response rate and characteristics of people who either took part or not in the ERICA, according to information subsets.
METHODS
he ERICA is a school-based, countrywide investigation. Its sample was designed to be representative of 12 to 17-year-old adolescents attending morning or afternoon session in public or private schools, in municipalities with over 100,000 inhabitants in Brazil.
It is a complex sample with 32 strata composed of Brazilian capital states and the sets comprising municipalities with over 100,000 inhabitants in countryside areas of Brazilian macro-regions. In each stratum, the schools that had the most chances of being selected were the ones with the highest numbers of students enrolled in the seventh, eighth, and ninth grade of elementary school and in the irst, second, and third grade of high school. he ones with the least chances of being selected were the ones located the farthest away from state capitals. In those schools, three combinations of grades and sessions (morning and afternoon) were selected. One group was selected in each combination, and all its students were invited to take part in the study. In total, 1,251 schools in 124 municipalities were selected, from a total of 273 municipalities with over 100,000 inhabitants. he study results are nationally representative of the 32 strata and the ive Brazilian macro-regions. Details on the sampling design can be found in Vasconcellos et al.15
We collected the data in a way to ensure privacy to each student, and the collection was conducted in the following order:
• Adolescent questionnaire: it comprised speciic questions for each of the 11 thematic blocks (sociodemographic characteristics, work and employment, physical activity, eating behavior, smoking, alcohol consumption, reproductive health, oral health, self-reported morbidity, sleep duration, and common mental disorder). he questionnaire was self-illed out by personal digital assistant (PDA) and had around 105 questions (numbers of questions varied according to sex). he system through which the questionnaire was answered did not allow to skip questions – even if an adolescent reported not having a certain habit, they had to answer questions regarding it. his strategy aimed to assess the consistency of answers and to avoid that students could deny a habit to abstain from giving details about it later. Some questions include options such as: “I do not know/I do not remember/I do not want to answer”3.
• Anthropometric measurements (performed by trained observers): he adolescents’ weight was calculated (single measure) by a Líder electronic scale with capacity of
200 kilograms and variation of 50 grams; their height was obtained through the average of two sequential measurements of a portable, retractable stadiometer (Alturexata),
with resolution in millimeters and maximum range of 213 centimeters; their waist circumference was obtained through the average of two sequential measurements, using a iberglass tape measure with resolution of 1 millimeter and length of 1.5 meters; and their arm circumference was obtained through a single measurement, by placing the measure around the arm at the midpoint between their acromion and their olecranon3.
• Arterial blood pressure and heartbeats: evaluated through three consecutive measurements by trained observers, with a three-minute interval between each measurement through a digital monitor (Omron 705-IT) validated for use in adolescents12. he measurements
were taken from the adolescents’ right arms while they were sitting and their feet were on the floor, with proper cuffs for each arm size. Only the average of the three last measurements was used3.
• 24-hour dietary recall: food intake regarding the last 24 hours before the interview was registered by trained interviewers in laptops with softwares speciically developed for the task.
• Blood collection: blood samples were only collected from morning period students who had fasted for 12 hours. We measured the following items: total cholesterol, HDL-cholesterol, triglycerides, glycated hemoglobin, and insulin. hese parameters were collected at the schools on dates exclusively scheduled for the purpose3.
he information regarding the number of students enrolled in the groups selected to take part in the study was obtained in the selected schools. Updated information was collected concerning the names and birth dates of students efectively attending the groups selected. Data on the frequency of registered students was obtained in the groups by respective teachers and principals.
he general collection strategy was coordinated by the central team of the project. However, each state had a local coordination that was in charge of all aspects involving logistics, recruitment and supervision of all supervisors trained by the central coordination, and also of all steps in the process to obtain the information, which was conducted at the schools by ield researchers that had been hired and trained3.
number of students of target ages (12 to 17 years old), and avoiding embarrassing students who were not in the target age range by excluding them from this step. Students in the eligible age ranges in grades below than the seventh grade were not included. Adolescents outside the age range between 12 and 17 years, pregnant ones, and physically or mentally-challenged adolescents (either temporarily or permanently disabilities that did not allow the adolescents to have their anthropometric measurements taken by the instruments in the research) were excluded from the analysis.
We included the adolescents in subsets according to the set of information obtained to enable the calculation of sample weights. he criteria to include or exclude study subjects who were eligible to be part of the groups with complete sets of information were:
• Questionnaire: included when all the questions in the 11 thematic blocks of the student questionnaire had been answered.
• Anthropometrics: included when at least the measurements regarding weight and height had been recorded.
• Arterial blood pressure: the invalid measurements were excluded (systolic arterial blood pressure less than or equal to diastolic arterial blood pressure).
• 24-hour dietary recall: the ones with energy consumption of less than 100 kcal were excluded.
• Blood: included adolescents with at least one biochemical test result among the all six.
Thus, adolescents might have filled out their questionnaire without having provided information on the dietary recall. Considering this, sample weights were calculated for each combination of these defined subsets, in a way to obtain unbiased estimates of the studied population. This resulted in 11 final subsets: 1) questionnaire; 2) questionnaire and anthropometrics; 3) questionnaire and dietary recall; 4) questionnaire, anthropometrics, and arterial pressure; 5) questionnaire, anthropometrics, and dietary recall; 6) questionnaire, anthropometrics, arterial blood pressure, and dietary recall; 7) questionnaire, and blood collection; 8) questionnaire, anthropometrics, and blood collection; 9) questionnaire, anthropometrics, arterial blood pressure, and blood collection; 10) questionnaire, anthropometrics, dietary recall, and blood collection; 11) questionnaire, anthropometrics, arterial blood pressure, dietary recall, and blood collection (Figure).
Efective response percentages were calculated; that is, the number of subjects with complete information according to the evaluated subset of information divided by the total number of eligible students (adolescents in the eligible age range enrolled in the groups), according to their macro-regions, sex, age (classiied as 12 to 14, and 15 to 17 years), and types of school (public or private). We also calculated the percentage of replacement schools in relation to the ones selected in the original sample, according to types of schools in the macro-regions.
he subjects and non-subjects were compared according to their sex, age, and average body mass index (BMI; kg/m²). Information on sex and age of non-subjects was obtained from school iles. BMI information was obtained from the students who only took part in the anthropometrics step and from the ones who gave information regarding weight and height but refused providing the remaining information of the study.
RESULTS
We started the collection in a public school in Rio de Janeiro, in the Southeast region, on March 18th, 2013, and inished it in a public school in Boa Vista, Roraima, North region, on November 10th, 2014.
Among the 102,327 students registered in the selected groups, 78,004 (76.2%) participated in at least one of the data collection steps of the study. In the total sample, the highest response rate was obtained for the information subset from the questionnaire, with percentages a little lower when anthropometric or dietary recall values were added
ERICA: Study of Cardiovascular Risks in Adolescents; BP: arterial blood pressure
a Younger than 12 and older than 17 years.
b Among the 102,327 eligible students, 23.7% of them (24,284) did not answer any of the information
blocks: questionnaire, anthropometrics, arterial blood pressure, and 24-hour dietary recall.
c Among the 72,508 eligible morning shift students, 22.3% (16,131) did not answer any of the
information blocks: questionnaire, anthropometrics, arterial blood pressure, and 24-hour dietary recall.
d Among the 29,819 eligible afternoon shift students, 27.3% (8,153) did not answer any of the
information blocks: questionnaire, anthropometrics, arterial blood pressure, and 24-hour dietary recall.
Figure. Flowchart of eligible adolescents and sample completeness regarding the information blocks and information subsets. ERICA, Brazil, 2013-2014. (Continue)
Final subset of information
(A) Flowchart of the general sample of eligible students
Students enrolled in the 1,217 schools evaluated by ERICA
n = 114,162
Eligibleb
n = 102,237
Questionnaire and anthropometrics
72.0% n = 73,624
Questionnaire and dietary recall
70.3% n = 71,971
Questionnaire, anthropometrics, BP, and dietary recall
69.9% n = 71,553 Anthropometrics
72.1% n = 73,787
Dietary Recall 71.5% n = 73,160 BP
72.0%
n = 73,637 Anthropometrics and BP 71.9% n = 73,552
Questionnaire, anthropometrics, and dietary recall
70.1% n = 71,740 Non-eligible (10.4%)
· Pregnant: n = 215 · Mentally or physically challenged: n = 364 · Out of age rangea: n = 11,256
Questionnaire, anthropometrics and PA
71.7% n = 73,399
(Figure, A). These percentages relate to information obtained from morning and afternoon session students. The response rate was smaller when blood tests were included, when only morning session students were considered (Figure, B). Generally speaking, these same relationships were observed according to macro-regions, sex, age ranges, and types of school (Table 1).
The highest response percentages of the information subsets that include an isolated questionnaire and anthropometrics or dietary information were obtained in the South region, especially in the oldest age range, from 15 to 17 years, for both sex (Table 1).
ERICA: Study of Cardiovascular Risks in Adolescents; BP: arterial blood pressure
a Younger than 12 and older than 17 years.
b Among the 102,327 eligible students, 23.7% of them (24,284) did not answer any of the information
blocks: questionnaire, anthropometrics, arterial blood pressure, and 24-hour dietary recall.
c Among the 72,508 eligible morning shift students, 22.3% (16,131) did not answer any of the
information blocks: questionnaire, anthropometrics, arterial blood pressure, and 24-hour dietary recall.
d Among the 29,819 eligible afternoon shift students, 27.3% (8,153) did not answer any of the
information blocks: questionnaire, anthropometrics, arterial blood pressure, and 24-hour dietary recall.
Figure. Flowchart of eligible adolescents and sample completeness regarding the information blocks and information subsets. ERICA, Brazil, 2013-2014. (Continuation)
Final subset of information
(B) Flowchart of the sample of eligible morning-shift students
Questionnaire, anthropometrics, BP, dietary recall and blood
51.0% n = 36,956
Questionnaire, enrolled in the 1,247 evaluated schools by ERICA
n = 114,162
Eligibleb n = 102,237
Anthropometrics 72.8% n = 52,802
Questionnaire, anthropometrics, and BP
72.5% n = 52,537
Questionnaire, anthropometrics, BP and blood
52.2% n = 37,815
Questionnaire, anthropometrics, and blood
52.3% n = 37,892
Questionnaire, anthropometrics, and blood
51.2% n = 37,096
Questionnaire, anthropometrics, dietary recall and blood
51.1% n = 37,023 Questionnaire and
anthropometrics 72.7% n = 52,683
Questionnaire and blood
52.5% n = 38,069
Questionnaire and dietary recall
71.1% n = 51,523 Morning session
70.9%
n = 72,508c
Afternoon session 29.1%
n = 29,819d
BP 72.7% n = 52,716
Anthropometrics and BP 72.6% n = 52,648 Non-eligible (10.4%) · Pregnant: n = 215 · Mentally or physically challenged: n = 364 · Out of age rangea: n = 11,256
Questionnaire 73.6% n = 53,353
Blood 56.2% n = 40,732
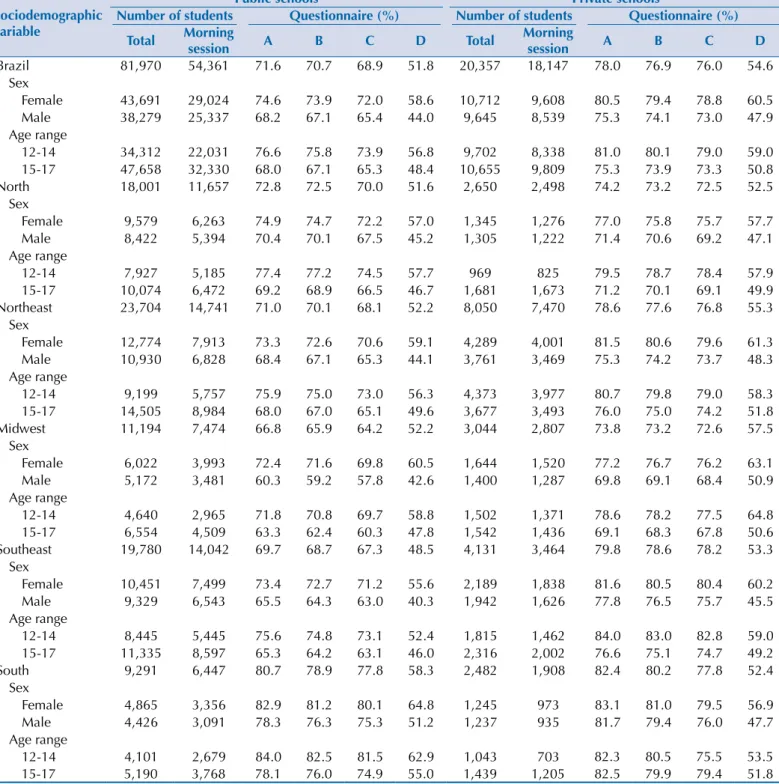
For the combination of questionnaire and blood information, the highest response rate took place with the youngest, 12 to 14-year-old, female students in the Midwest region (Table 2).
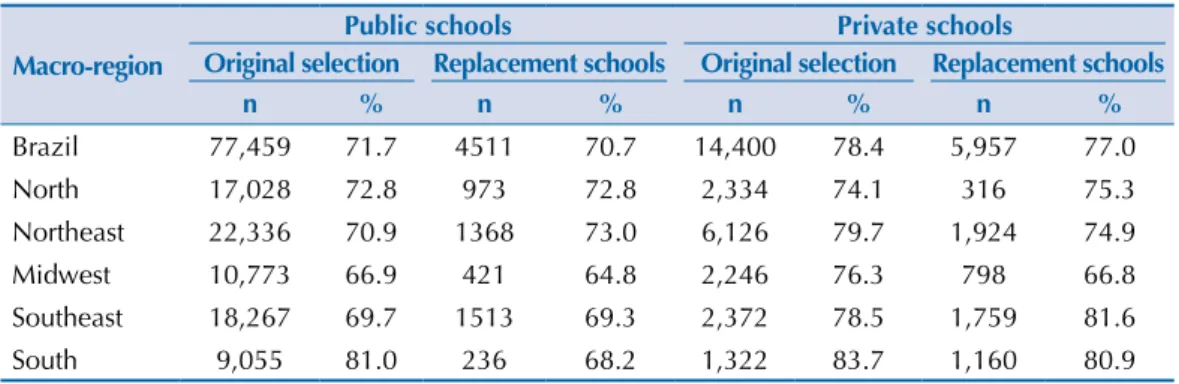
For most combinations, the response rate in the study was higher in private schools than in public ones. However, in the South region the diferences were smaller and the response rate of 12 to 14-year-old adolescents was higher in the public schools for all combinations of information subsets; regarding the subset with blood information, the higher response rate in the public schools was observed for both age ranges and sex (Table 3).
Table 1. Response percentage according to sex. age. and macro-regions. ERICA, Brazil, 2013-2014.
Sociodemographic variable
Number of students Questionnaire (%)
Total Morning
session A B C D
Brazil 102,327 72,508 72.9 71.9 70.3 52.5
Sex
Female 54,403 38,632 75.8 75.0 73.4 59.1
Male 47,924 33,876 69.6 68.5 66.9 45.0
Age range
12-14 44,014 30,369 77.6 76.7 75.0 57.4
15-17 58,313 42,139 69.4 68.3 66.8 49.0
North 20,651 14,155 73.0 72.6 70.3 51.7
Sex
Female 10,924 7,539 75.2 74.8 72.6 57.2
Male 9,727 6,616 70.5 70.1 67.7 45.5
Age range
12-14 8,896 6,010 77.6 77.3 74.9 57.7
15-17 11,755 8,145 69.5 69.1 66.9 47.3
Northeast 31,754 22,211 73.0 72.0 70.4 53.2
Sex
Female 17,063 11,914 75.4 74.6 72.9 59.9
Male 14,691 10,297 70.2 68.9 67.4 45.5
Age range
12-14 13,572 9,734 77.4 76.6 74.9 57.1
15-17 18,182 12,477 69.6 68.6 66.9 50.2
Midwest 14,238 10,281 68.3 67.5 66.0 53.6
Sex
Female 7,666 5,513 73.4 72.7 71.1 61.2
Male 6,572 4,768 62.3 61.3 60.0 44.9
Age range
12-14 6,142 4,336 73.5 72.6 71.6 60.7
15-17 8,096 5,945 64.4 63.5 61.8 48.5
Southeast 23,911 17,506 71.4 70.4 69.2 49.4
Sex
Female 12,640 9,337 74.8 74.1 72.8 56.5
Male 11,271 8,169 67.6 66.4 65.2 41.3
Age range
12-14 10,260 6,907 77.1 76.3 74.8 53.8
15-17 13,651 10,599 67.2 66.0 65.0 46.6
South 11,773 8,355 81.0 79.2 77.8 56.9
Sex
Female 6,110 4,329 82.9 81.2 80.0 63.0
Male 5,663 4,026 79.0 77.0 75.5 50.4
Age range
12-14 5,144 3,382 83.7 82.1 80.2 60.9
15-17 6,629 4,973 79.0 76.9 75.9 54.2
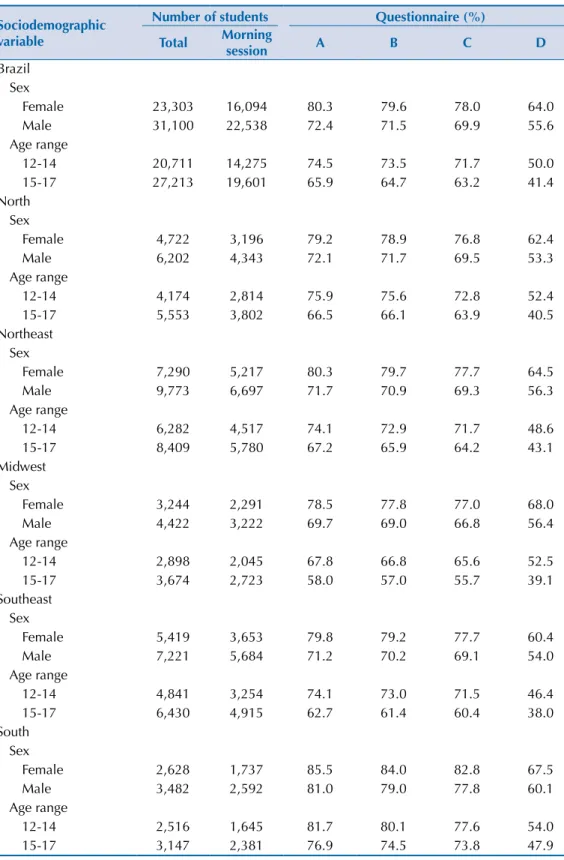
Out of the 1,251 selected schools in the original sample, four were lost: three in Sao Paulo and one in Amapa, all private schools with no replacements. In the end, 139 (11.1%) of the schools were replaced. Among the 1,012 public schools and the 235 private schools, these replacements took place in 6.0% and 32.2% of the cases, respectively. In all regions, the replacements were relatively more frequent in private schools. North region was found to have the smallest relative frequency of substitutions in private schools. However, the South region was found to have the extremes; that is, the smallest percentage of substitutions in public schools (3.8%) and the highest percentage in the private ones (48.4%). he questionnaire Table 2. Coverage of information according to macro-regions, sex, and age. ERICA, Brazil, 2013-2014.
Sociodemographic variable
Number of students Questionnaire (%)
Total Morning
session A B C D
Brazil Sex
Female 23,303 16,094 80.3 79.6 78.0 64.0
Male 31,100 22,538 72.4 71.5 69.9 55.6
Age range
12-14 20,711 14,275 74.5 73.5 71.7 50.0
15-17 27,213 19,601 65.9 64.7 63.2 41.4
North Sex
Female 4,722 3,196 79.2 78.9 76.8 62.4
Male 6,202 4,343 72.1 71.7 69.5 53.3
Age range
12-14 4,174 2,814 75.9 75.6 72.8 52.4
15-17 5,553 3,802 66.5 66.1 63.9 40.5
Northeast Sex
Female 7,290 5,217 80.3 79.7 77.7 64.5
Male 9,773 6,697 71.7 70.9 69.3 56.3
Age range
12-14 6,282 4,517 74.1 72.9 71.7 48.6
15-17 8,409 5,780 67.2 65.9 64.2 43.1
Midwest Sex
Female 3,244 2,291 78.5 77.8 77.0 68.0
Male 4,422 3,222 69.7 69.0 66.8 56.4
Age range
12-14 2,898 2,045 67.8 66.8 65.6 52.5
15-17 3,674 2,723 58.0 57.0 55.7 39.1
Southeast Sex
Female 5,419 3,653 79.8 79.2 77.7 60.4
Male 7,221 5,684 71.2 70.2 69.1 54.0
Age range
12-14 4,841 3,254 74.1 73.0 71.5 46.4
15-17 6,430 4,915 62.7 61.4 60.4 38.0
South Sex
Female 2,628 1,737 85.5 84.0 82.8 67.5
Male 3,482 2,592 81.0 79.0 77.8 60.1
Age range
12-14 2,516 1,645 81.7 80.1 77.6 54.0
15-17 3,147 2,381 76.9 74.5 73.8 47.9
covered 71.7% of the public schools that were not replaced and 70.7% of the replaced ones, whereas in private schools, the corresponding percentages were 78.4% and 77.0% (Table 4).
Regarding the subset of information from the questionnaire and anthropometric data, among the 28,713 eligible non-subjects, most of them (77.2%) were absent on the day the information was collected in both steps, 5,272 (19.0%) of them were present and refused to participate, 109 (0.4%) of them were logistic losses, and 1,154 (4.0%) were partial losses (either had their weight and/or height measured, but have not answered the questionnaire; or only answered the questionnaire). BMI data were collected from 2,374 non-subject adolescents, of whom 2,214 (93.2%) were refusals and reported weights and heights, and 160 (6.8%) were partial losses and had their weight and height measured, despite not answering the questionnaire (Table 5).
Table 3. Response percentage according to sex, age, macro-regions, and types of school. ERICA, Brazil, 2013-2014.
Sociodemographic variable
Public schools Private schools
Number of students Questionnaire (%) Number of students Questionnaire (%)
Total Morning
session A B C D Total
Morning
session A B C D
Brazil 81,970 54,361 71.6 70.7 68.9 51.8 20,357 18,147 78.0 76.9 76.0 54.6
Sex
Female 43,691 29,024 74.6 73.9 72.0 58.6 10,712 9,608 80.5 79.4 78.8 60.5
Male 38,279 25,337 68.2 67.1 65.4 44.0 9,645 8,539 75.3 74.1 73.0 47.9
Age range
12-14 34,312 22,031 76.6 75.8 73.9 56.8 9,702 8,338 81.0 80.1 79.0 59.0
15-17 47,658 32,330 68.0 67.1 65.3 48.4 10,655 9,809 75.3 73.9 73.3 50.8
North 18,001 11,657 72.8 72.5 70.0 51.6 2,650 2,498 74.2 73.2 72.5 52.5
Sex
Female 9,579 6,263 74.9 74.7 72.2 57.0 1,345 1,276 77.0 75.8 75.7 57.7
Male 8,422 5,394 70.4 70.1 67.5 45.2 1,305 1,222 71.4 70.6 69.2 47.1
Age range
12-14 7,927 5,185 77.4 77.2 74.5 57.7 969 825 79.5 78.7 78.4 57.9
15-17 10,074 6,472 69.2 68.9 66.5 46.7 1,681 1,673 71.2 70.1 69.1 49.9
Northeast 23,704 14,741 71.0 70.1 68.1 52.2 8,050 7,470 78.6 77.6 76.8 55.3
Sex
Female 12,774 7,913 73.3 72.6 70.6 59.1 4,289 4,001 81.5 80.6 79.6 61.3
Male 10,930 6,828 68.4 67.1 65.3 44.1 3,761 3,469 75.3 74.2 73.7 48.3
Age range
12-14 9,199 5,757 75.9 75.0 73.0 56.3 4,373 3,977 80.7 79.8 79.0 58.3
15-17 14,505 8,984 68.0 67.0 65.1 49.6 3,677 3,493 76.0 75.0 74.2 51.8
Midwest 11,194 7,474 66.8 65.9 64.2 52.2 3,044 2,807 73.8 73.2 72.6 57.5
Sex
Female 6,022 3,993 72.4 71.6 69.8 60.5 1,644 1,520 77.2 76.7 76.2 63.1
Male 5,172 3,481 60.3 59.2 57.8 42.6 1,400 1,287 69.8 69.1 68.4 50.9
Age range
12-14 4,640 2,965 71.8 70.8 69.7 58.8 1,502 1,371 78.6 78.2 77.5 64.8
15-17 6,554 4,509 63.3 62.4 60.3 47.8 1,542 1,436 69.1 68.3 67.8 50.6
Southeast 19,780 14,042 69.7 68.7 67.3 48.5 4,131 3,464 79.8 78.6 78.2 53.3
Sex
Female 10,451 7,499 73.4 72.7 71.2 55.6 2,189 1,838 81.6 80.5 80.4 60.2
Male 9,329 6,543 65.5 64.3 63.0 40.3 1,942 1,626 77.8 76.5 75.7 45.5
Age range
12-14 8,445 5,445 75.6 74.8 73.1 52.4 1,815 1,462 84.0 83.0 82.8 59.0
15-17 11,335 8,597 65.3 64.2 63.1 46.0 2,316 2,002 76.6 75.1 74.7 49.2
South 9,291 6,447 80.7 78.9 77.8 58.3 2,482 1,908 82.4 80.2 77.8 52.4
Sex
Female 4,865 3,356 82.9 81.2 80.1 64.8 1,245 973 83.1 81.0 79.5 56.9
Male 4,426 3,091 78.3 76.3 75.3 51.2 1,237 935 81.7 79.4 76.0 47.7
Age range
12-14 4,101 2,679 84.0 82.5 81.5 62.9 1,043 703 82.3 80.5 75.5 53.5
15-17 5,190 3,768 78.1 76.0 74.9 55.0 1,439 1,205 82.5 79.9 79.4 51.8
Table 4. Response percentage of questionnaires of the originally-selected or replacement schools according to macro-regions. ERICA, Brazil, 2013-2014.
Macro-region
Public schools Private schools
Original selection Replacement schools Original selection Replacement schools
n % n % n % n %
Brazil 77,459 71.7 4511 70.7 14,400 78.4 5,957 77.0
North 17,028 72.8 973 72.8 2,334 74.1 316 75.3
Northeast 22,336 70.9 1368 73.0 6,126 79.7 1,924 74.9
Midwest 10,773 66.9 421 64.8 2,246 76.3 798 66.8
Southeast 18,267 69.7 1513 69.3 2,372 78.5 1,759 81.6
South 9,055 81.0 236 68.2 1,322 83.7 1,160 80.9
Table 5. Percentages and body mass indices (BMI) of subjects and non-subjects. according to sex and age range as per macro-regions, in ERICA’s sample of eligible students. Brazil, 2013-2014.
Sociodemographic variable
Subjectsa Non-subjects
n % BMI 95%CI n % nb % BMI 95%CI
Brazil 73,624 - 21.2 21.2-21.2 28,703 - 2,374 - 21.4 21.3-21.6
Sex
Female 40,803 55.4 21.3 21.3-21.4 13,600 47.4 945 39.8 21.4 21.2-21.7
Male 32,821 44.6 21.0 21.0-21.0 15,103 52.6 1,429 60.2 21.4 21.2-21.7
Age range
12-14 33,778 45.9 20.5 20.5-20.6 10,236 35.7 1,085 45.7 20.8 20.5-21.0
15-17 39,846 54.1 21.7 21.7-21.8 18,467 64.3 1,289 54.3 22.0 21.8-22.2
North 14,996 - 20.9 20.9-21.0 5,655 - 245 - 21.6 21.1-22.1
Sex
Female 8,174 54.5 21.0 20.9-21.1 2,750 48.6 97.0 39.6 21.1 20.4-21.8
Male 6,822 45.5 20.8 20.7-20.9 2,905 51.4 148 60.4 21.9 21.2-22.6
Age range
12-14 6,879 45.9 20.2 20.1-20.3 2,017 35.7 114 46.5 21.0 20.2-21.7
15-17 8,117 54.1 21.6 21.5-21.6 3,638 64.3 131 53.5 22.1 21.4-22.8
Northeast 22,864 - 21.1 21.0-21.1 8,890 - 244 - 21.8 21.2-22.4
Sex
Female 12,737 55.7 21.2 21.1-21.2 4,326 48.7 98 40.2 22.2 21.1-23.2
Male 10,127 44.3 20.9 20.8-21.0 4,564 51.3 146 59.8 21.5 20.8-22.2
Age range
12-14 10,390 45.4 20.5 20.4-20.6 3,182 35.8 97 39.8 21.5 20.4-22.5
15-17 12,474 54.6 21.5 21.5-21.6 5,708 64.2 147 60.2 22.0 21.3-22.7
Midwest 9,604 - 21.1 21.0-21.2 4,634 - 718 - 20.8 20.5-21.0
Sex
Female 5,573 58.0 21.2 21.1-21.3 2,093 45.2 304 42.3 20.8 20.4-21.2
Male 4,031 42.0 20.9 20.8-21.0 2,541 54.8 414 57.7 20.8 20.4-21.1
Age range
12-14 4,459 46.4 20.4 20.3-20.5 1,683 36.3 367 51.1 20.3 19.9-20.6
15-17 5,145 53.6 21.7 21.6-21.8 2,951 63.7 351 48.9 21.3 20.9-21.7
Southeast 16,841 - 21.3 21.3-21.4 7,070 - 602 - 21.6 21.2-21.9
Sex
Female 9,360 55.6 21.6 21.5-21.7 3,280 46.4 225 37.4 21.9 21.2-22.6
Male 7,481 44.4 21.0 20.9-21.1 3,790 53.6 377 62.6 21.4 21.0-21.8
Age range
12-14 7,827 46.5 20.7 20.6-20.8 2,433 34.4 266 44.2 20.8 20.3-21.4
15-17 9,014 53.5 21.9 21.9-22.0 4,637 65.6 336 55.8 22.2 21.7-22.7
South 9,319 - 21.8 21.7-21.8 2,454 - 565 - 22.0 21.6-22.3
Sex
Female 4,959 53.2 21.9 21.3-22.0 1,151 46.9 221 39.1 21.7 21.3-22.2
Male 4,360 46.8 21.6 21.4-21.7 1,303 53.1 344 60.9 22.1 21.7-22.6
Age range
12-14 4,223 45.3 21.1 21.0-21.2 921 37.5 241 42.7 21.2 20.7-21.7
15-17 5,096 54.7 22.3 22.2-22.4 1,533 62.5 324 57.3 22.5 22.1-22.9
a Regarding the information subset from eligible students who filled out questionnaires and had anthropometric measurements taken. b Number of individuals with self-reported anthropometric information among the ones who refused to participated in the study
The ratio of male and those adolescents with 15 to 17 years old were higher among non-subjects as compared to the ERICA’s subjects. his setting was similar in all macro-regions in Brazil. In the total sample and in the macro-macro-regions, the average BMI was a little higher among non-subjects (Table 5).
DISCUSSION
Even though the large sample size of ERICA and the careful planning and execution of the study3 reinforce the signiicance of its indings, it is important to understand the dimension
and the characteristics of the participation in the study considering possible biases that afect its internal quality.
Around 78,000 eligible adolescents had some information collected in the study, and we found variations in the response rate according to the information subsets. he highest response rate was found for the information subset collected in the self-administered questionnaire and the lowest one for the blood subset. Moreover, some diferences among regions and regarding types of school were observed: the public schools had lower response percentages as compared to the private ones, with the exception of the South region, especially regarding blood collection.
he assessment of participation and non-participation in epidemiological studies and the detailed description of such lack of response is not often found in the literature4,8. It is very
important that non-answers are adequately reported so that results can be interpreted properly and that strategies aiming to reduce non-answers may be developed4,10.
Morton et al.8 selected 355 epidemiological studies published between January 2003 and
April 2003 in 10 international periodicals, and found 86 cross-sectional studies, of which only 51.0% reported participation data varying between 28.0% and 100%.
Country-wide population-based studies about adolescents are scarce1,5,6,13. Pesquisa
Nacional de Saúde do Escolar (PeNSE – Brazil’s National Student Health Survey),
(conducted with students in the ninth grade of elementary school5, found a response
percentage of 83.0%, only considering the information subset from the questionnaire. The difference between the response percentages of ERICA and PeNSE may be partly accounted for the fact that the sample of PeNSE included 13 to 15-year-old adolescents, who were younger than the ones from ERICA. In ERICA, coverage of all information subsets was higher among 12 to 14-year-old adolescents, and the questionnaire subset had a 76.2% coverage for this age range. Another difference between the studies is ERICA’s requirement of informed consent terms for some states, in which we found lower coverage percentages. Midwest and South regions have the lowest and the highest coverage percentages, respectively, in both investigations.
As compared to international studies such as the Healthy Lifestyle in Europe by Nutrition in Adolescence(HELENA)2, a school study that was conducted in 10 European cities with
12 to 17-year-old adolescents, the coverage of ERICA was superior (67.0% versus 73.0%). In HELENA, in the subsample of adolescents who had their blood collected, the coverage for these information was superior to the one found in ERICA (68,0% versus 52,0%).
impact from the mandatory informed consent terms, as the other two states in the Midwest region, in which consent terms were not required had response percentages in the questionnaires above 80.0%.
The differences observed among the response percentages according to the types of school seemed to have no relation to the higher ratio of replacements in private schools, as the response percentages among the original schools in the sample and the replacement ones were similar regardless of their type of administration. It is possible to hypothesize that the coverage differences between public and private schools are related to absenteeism. In PeNSE 2012, among the public school students, 28.8% reported having missed classes without permission from their parents in the previous 30 days, whereas in private schools, this percentage was 14.4%. Other possible explanations: public schools are more frequently located in dangerous areas and the higher probability for those students having to work, which may increase absenteeism. Regarding that last hypothesis, in the total sample of eligible students, 6.2% from public schools had paying jobs, as compared to only 2.8% in private schools (missing data). The estimate for prevalence of public school students who reported working may be underestimated, as it was only obtained from the ones who were present on the collection day and answered the questionnaires.
The adolescents who did not participate in ERICA were mostly males and 15 to 17 years old. Moreover, they had BMI values slightly superior to the adolescents of this study. However, BMI data were only estimated in 8.5% of non-subjects, and this estimate may not be representative of the total non-subjects. In ERICA, we established analysis procedures that, besides considering complex sampling, used calibrated weights that adjusted estimates of prevalence according to the distribution of age and sex in each sample stratum, which was estimated with information obtained from population-based censuses15. Furthermore, these specific estimates consider that the subjects of ERICA
represent those who did not participate. The possible accuracy losses in the estimates are more related to the level of clustering, due to the option of including all students from the selected groups than to the total number of observations, which was close to the expected one.
he ERICA adopted some strategies to foster student participation, such as: preparation of material with information on the study made by a famous children’s cartoonist, to attract the attention of the youngsters – it included a brochure, a poster, and the study slogan; distribution of food kits for the ones who fasted before the blood collection; and publishing of the study in a website (www.erica.ufrj.br), with a communication channel (contact us) and broadcasting of it on television and on local press media at the beginning of the collection in each state. hese strategies increased the cost of the study, but are fundamental to reduce lack of participation in epidemiological studies. Similarly, strategies to reach non-subjects and obtain some information about them to understand their resistance to taking part are important and require great logistic efort that is hard and costly to implement in a large population-based study4.
he ERICA is the irst nationwide, school-based investigation that obtained comprehensive information on nutritional state, arterial blood pressure, and biochemical blood parameters of adolescents. he non-answer ratio – lower than the third of the number of subjects – will hardly cause an impact in the estimates of the study under the characteristics described. his study provides useful information for future investigations in adolescents, which may improve strategies to collect information to reduce the lack of response.
1. Araújo VC, Konrad LM, Rabacow FM, Graup S, Amboni R, Farias Júnior JC. Prevalência de excesso de peso em adolescentes brasileiros: um estudo de revisão sistemática. Rev Bras Ativ Fis
Saude. 2012;12(3):79-87. DOI:10.12820/RBAFS.V.12N3P79-87
2. Béghin L, Huybrechts I, Vicente-Rodríguez G, De Henauw S, Gottrand F, Gonzales-Gross M et al. Main characteristics and participation rate of European adolescents included in the
HELENA study. Arch Public Health. 2012;70:14. DOI:10.1186/0778-7367-70-14
3. Bloch KV, Szklo M, Kuschnir MC, Abreu GA, Barufaldi LA, Klein CH et al. The Study of Cardiovascular Risk in Adolescents - ERICA: rationale, design and sample characteristics of a national survey examining cardiovascular risk factor profile in Brazilian adolescents. BMC Public
Health. 2015;15:94. DOI:10.1186/s12889-015-1442-x
4. Galea S, Tracy M. Participation Rates in Epidemiologic Studies. Ann Epidemiol. 2007;17(9):643-653. DOI:10.1016/j.annepidem.2007.03.013
5. Instituto Brasileiro de Geografia e Estatística. Pesquisa Nacional de Saúde do Escolar: 2009. Rio de Janeiro (RJ): IBGE; 2009.
6. Magliano ES, Guedes LG, Coutinho ESF, Bloch KV. Prevalence of arterial hypertension among Brazilian adolescents: systematic review and meta-analysis. BMC Public Health. 2013;13:833. DOI:10.1186/1471-2458-13-833
7. Malta DC, Leal MC, Costa MFL, Morais Neto OL. Inquéritos Nacionais de Saúde:
experiência acumulada e proposta para o inquérito de saúde brasileiro. Rev Bras Epidemiol. 2008;11(Suppl 1):159-167. DOI:10.1590/S1415-790X2008000500017
8. Morton LM, Cahill J, Hartge P. Reporting participation in epidemiologic studies: a survey of
practice. Am J Epidemiol. 2006;163(3):197-203. DOI:10.1093/aje/kwj036
9. Pocock SJ, Collier TJ, Dandreo KJ, Stavola BL, Goldman MB, Kalish LA et al. Issues in the reporting of epidemiological studies: a survey of recent practice. BMJ. 2004;329(7471):883. DOI:10.1136/bmj.38250.571088.55
10. Sandler DP. On revealing what we’d rather hide: the problem of describing study participation.
Epidemiology. 2002;13(2):117. DOI:10.1097/00001648-200203000-00001
11. Schmidt MI, Duncan BB, Azevedo e Silva G, Menezes AM, Monteiro CA, Barreto SM et al. Chronic non-communicable diseases in Brazil: burden and current challenges. Lancet. 2011;377(9781):1949-61. DOI:10.1016/S0140-6736(11)60135-9
12. Stergiou GS, Yiannes NG, Rarra VC. Validation of the Omron 705 IT oscillometric device for home blood pressure measurement in children and adolescents: the Arsakion School Study.
Blood Press Monit. 2006;11(4):229-34. DOI:10.1097/01.mbp.0000209074.38331.16
13. Tavares LF, Yokoo EM, Rosa MLG, Fonseca SC. Síndrome metabólica em crianças e adolescentes: revisão sistemática. Cad Saude Coletiva. 2010;18(4):469-76.
14. Tooth L, Ware R, Bain C, Purdie DM, Dobson A. Quality of reporting of observational
longitudinal research. Am J Epidemiol. 2005;161(3):280-8. DOI:10.1093/aje/kwi042
15. Vasconcellos MTL, Silva PLN, Szklo M, Kuschnir MCC, Klein CH, Abreu GA et al. Desenho
da amostra do Estudo do Risco Cardiovascular em Adolescentes (ERICA). Cad Saude Publica.
2015;31(5):921-30. DOI:10.1590/0102-311X00043214
Funding: Science and Technology Department of the Science, Technology and Strategic Inputs Secretariat (SCTIE) of the Ministry of Health (Decit/SCTIE/MS) and Sectoral Health Fund of the Ministry of Science, Technology and Innovation (MCTI). Protocols FINEP: 01090421 and CNPq: 565037/2010-2 and 405.009/2012-7.
Authors’ Contribution: Supervision of the study: TLNS. Analysis and interpretation of the data: TLNS, CKK, LAB, GAA, MCCK, MTLV, AMS, and KVB. All authors prepared and approved the inal draft of the article.