ERICA: leisure-time physical inactivity in
Brazilian adolescents
Felipe Vogt CureauI,II,Thiago Luiz Nogueira da SilvaIII, Katia Vergetti BlochIII, Elizabeth FujimoriIV, Dilson Rodrigues BelfortV, Kênia Mara Baiocchi de CarvalhoVI, Elisa Brosina de LeonVII, Mauricio Teixeira Leite de VasconcellosVIII, Ulf EkelundII, Beatriz D SchaanI,IX
I Programa de Pós-Graduação em Endocrinologia. Universidade Federal do Rio Grande do Sul. Porto Alegre,
RS, Brasil
II Department of Sports Medicine. Norwegian School of Sports Science. Oslo, Norway
III Instituto de Estudos em Saúde Coletiva. Universidade Federal do Rio de Janeiro. Rio de Janeiro, RJ, Brasil IV Departamento de Enfermagem em Saúde Coletiva. Escola de Enfermagem. Universidade de São Paulo. São
Paulo, SP, Brasil
V Universidade Federal do Amapá. Macapá, AP, Brasil
VI Departamento de Nutrição. Universidade de Brasília. Brasília, DF, Brasil
VII Faculdade de Educação Física e Fisioterapia. Universidade Federal do Amazonas. Manaus, AM, Brasil VIII Escola Nacional de Ciências Estatísticas. Fundação Instituto Brasileiro de Geografia e Estatística. Rio de
Janeiro, RJ, Brasil
IX Serviço de Endocrinologia. Hospital de Clínicas de Porto Alegre. Universidade Federal do Rio Grande do
Sul. Porto Alegre, RS, Brasil
ABSTRACT
OBJECTIVE: To evaluate the prevalence of leisure-time physical inactivity in Brazilian adolescents and their association with geographical and sociodemographic variables.
METHODS: he sample was composed by 74,589 adolescents participating in the Study of Cardiovascular Risks in Adolescents (ERICA). his cross-sectional study of school basis with national scope involved adolescents aged from 12 to 17 years in Brazilian cities with more than 100 thousand inhabitants. he prevalence of leisure-time physical inactivity was categorized according to the volume of weekly practice (< 300; 0 min). he prevalences were estimated for the total sample and by sex. Poisson regression models were used to assess associated factors.
RESULTS: he prevalence of leisure-time physical inactivity was 54.3% (95%CI 53.4-55.2), and higher for the female sex (70.7%, 95%CI 69.5-71.9) compared to the male (38.0%, 95%CI 36.7-39.4). More than a quarter of adolescents (26.5%, 95%CI 25.8-27.3) reported not practicing physical activity in the leisure time, a condition more prevalent for girls (39.8%, 95%CI 38.8-40.9) than boys (13.4%, 95%CI 12.4-14.4). For girls, the variables that were associated with physical inactivity were: reside in the Northeast (RP = 1.13, 95%CI 1.08-1.19), Southeast (RP = 1.16, 95%CI 1.11-1.22) and South (RP = 1.12, 95%CI 1.06-1.18); have 16-17 years (RP = 1.06, 95%CI 1.12-1.15); and belong to the lower economic class (RP = 1.33, 95%CI 1.20-1.48). he same factors, except reside in the Southeast and South, were also associated with not practicing physical activity in the leisure time for the same group. In males, as well as the region, being older (p < 0.001) and declaring to be indigenous (RP = 0.37, 95%CI 0.19-0.73) were also associated with not practicing physical activities in the leisure time.
CONCLUSIONS: he prevalence of leisure-time physical inactivity in Brazilian adolescents is high. It presents regional variations and is associated with age and low socioeconomic status. Special attention should be given to girls and to those who do not engage in any physical activity during the leisure time, so that they can adopt a more active lifestyle.
DESCRIPTORS: Adolescent. Motor Activity. Sedentary Lifestyle. Prevalence. Cross-Sectional Studies.
Correspondence:
Felipe Vogt Cureau Hospital de Clínicas de Porto Alegre Rua Ramiro Barcelos, 2350 prédio 21 6º andar sala 21606
90035-003 Porto Alegre, RS, Brasil E-mail: [email protected]
Received: 14 Set 2015 Approved: 28 Oct 2015
How to cite: Cureau FV, Silva TLN, Bloch KV, Fujimori E, Belfort DR, Carvalho KMB et al. ERICA: Leisure-time physical inactivity in Brazilian adolescents. Rev Saude Publica. 2016;50(suppl 1):4s.
Copyright: This is an open-access article distributed under the terms of the Creative Commons Attribution License, which permits unrestricted use, distribution, and reproduction in any medium, provided that the original author and source are credited.
INTRODUCTION
Physical inactivity is one of the main risk factors for the development of chronic diseases25.
According to the study by Lee et al.17, it is possible to assign to physical inactivity the
occurrence of 5.3 million deaths in the world only in the year of 2008. In Brazil, 13.0% of deaths in 2008 were attributed to physical inactivity17. his information relate directly to
the adult population, but also to the population of adolescents, since active adolescents have a higher chance to remain active in adulthood1,22. Practicing physical activities in this
age group is associated with immediate beneits, such as prevention of cardiovascular and metabolic risk factors11,18, and also predicts better health in adulthood15.
Nevertheless, the world prevalence of physical inactivity in adolescents (13-15 years) is of 80.0%, considering the recommendation of at least 60 min/day of moderate or vigorous physical activity14. In Brazil, a systematic review with meta-analysis showed
great variation in the prevalence of physical inactivity, both in male adolescents (2.0%-80.0%) and females (14.0%-91.0%). The study also noted the data shortage in the North (one study) and Midwest (no studies) regions, and the great variability in the definition of physical inactivity2.
he Pesquisa Nacional de Saúde do Escolar (PeNSE – National Survey of Students’ Health), which involved Brazilian adolescents of the ninth year of basic education to all regions of the Country and used the cutting point of less than 300 min/week to deine physical inactivity, found prevalence of 57.0% in 200913. he same survey conducted in 2012, with some changes
in the methodology and in the research tool, found prevalence of physical inactivity of 71.0%, being greater in the Northeast (76.0%) and lower in the South region (65.0%)19.
hese data reinforce the need for continuous monitoring of the population levels of physical activity in adolescence, to provide more efective intervention strategies. hus, the objective of this study was to evaluate the prevalence of leisure-time physical inactivity in Brazilian adolescents and their association with geographical and sociodemographic variables.
METHODS
The sample was composed of adolescents participating in the Study of Cardiovascular Risks in Adolescents (ERICA). This is a cross-sectional study of school basis with national scope, including public and private schools located in urban and rural areas. The data collection took place between February 2013 and November 2014. We assessed 85,615 students, residents of Brazilian municipalities with more than 100 thousand inhabitants (medium and large municipalities). In this study, we used data from 74,589 adolescents aged between 12 and 17 years, who have fully completed the block on practice of physical activity in ERICA.
For sampling, the target population of ERICA was divided into 32 geographical strata: 26 state capitals and the Federal District, and five more sets representing other municipalities with more than 100 thousand inhabitants in each macro-region of the country. The sample size was calculated for each stratum, to ensure representative estimates of each one. The schools were selected with probability proportional to a size directly proportional to the number of students at the school in the school years considered, and inversely proportional to the distance between the municipality and the capital of the state in question. In total, 1,247 schools participated in this study, of 124 municipalities with more than 100 thousand inhabitants.
participate of ERICA. More details about the design of the sample of ERICA can be obtained in a previous publication23.
he research protocol of ERICA was described by Bloch et al.4 In summary, after being
selected, the schools were contacted and invited to participate in the study. ERICA data collection involved the application of a structured questionnaire, anthropometric assessment, measurement of blood pressure and blood collection. he variables used in this study were obtained by structured questionnaire, illed by the adolescents on their own, inserted into an electronic data collector (personal digital assistant – PDA).
To determine the level of physical activity of adolescents, we used an adaptation of the Self-Administered Physical Activity Checklist20, which consists of a list of 24 modes and
allows the adolescents to report frequency (days) and the time (hours and minutes) that they performed, in the last week, some of the activities listed. his questionnaire has already been used in other research on Brazil3,7 and the version used in ERICA was validated in Brazilian
adolescents12. For estimates of the prevalence of leisure-time physical inactivity, were used
only questions relating to this domain (21 questions).
To determine the level of physical activity, we calculated the product between time and frequency in each activity and the sum of the times obtained. he adolescents who not accumulated at least 300 min/week of physical activity in the leisure time were considered inactive24. he prevalence of adolescents who did not report any practice of physical activity
during the leisure time in the week preceding the survey (0 min/week) was also evaluated.
Among the independent variables, we analyzed the geographic location according to the region of residence of adolescents (North, Northeast, Midwest, Southeast and South) and the following sociodemographic characteristics: sex; age in full years, later recategorized (12-13, 14-15, 16-17 years); and self-declared skin color (white, black, brown (mixed), yellow (Asian) or indigenous). Socioeconomic status was deined using the Critério Brasil5, which
considers possession of goods, presence of housekeeper and education of the chief of the household. he score obtained can range from 0 to 46 points. his score was categorized into levels according to recommendation of the instrument: A (35-46 points), B (23-34 points), C (14-22 points), D (8-13 points) and E (0-7 points). Classes D and E were regrouped in the same category, due to low frequency.
he analysis of data involved the estimation of prevalence of leisure-time physical inactivity (< 300 min/week) and of those who did not perform any physical activity during the leisure time at all (0 min/week), with their respective 95% conidence intervals (95%CI). he prevalences were estimated for the entire sample, stratiied by sex and described according to the independent variables studied.
he associations of the two categories of physical inactivity with exposure variables were investigated using Poisson regression. he adjusted model was built with only one level of the input variables, which were taken from those with less inluence to obtain the inal model. We analyzed the presence of multicollinearity. he adjustment of the model was evaluated by goodness-of-it test. he presence of interactions was tested by multiplicative approach through heterogeneity test. Poisson regression models showed good overall adjustment and we did not observe multicollinearity problems or signiicant interactions.
The results of the sample were expanded to represent the Brazilian population of schoolchildren in Brazilian cities with more than 100 thousand inhabitants. he sample weights calculated for the study were considered to obtain the estimates23. Analyses were
conducted in Stata 14 with a signiicance level of 5%.
RESULTS
Half of the sample was composed of adolescents who studied in strata of the Southeast and Northeast regions, 75.0% in capitals, and 79.0% in public schools. he vast majority of the schools were located in urban areas (98.0%). he girls are the majority in the sample (55.0%), as well as those in the age group of 14-15 years (37.0%), brown skin color (52.0%) and intermediate (B and C) economic classes (86.0%).
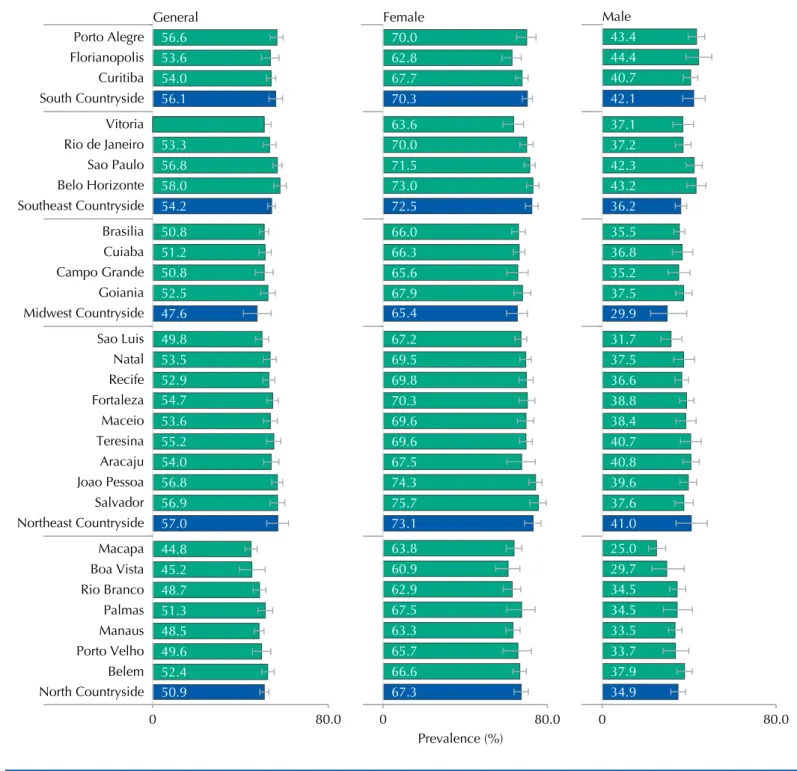
he prevalence of leisure-time physical inactivity was 54.3% (95%CI 53.4-55.2), higher for the female sex (70.7%, 95%CI 69.5-71.9) compared to the male (38.0%, 95%CI 36.7-39.4) (Table 1). Figure 1 shows the prevalence of adolescents who not accumulated at least 300 min/week of physical activity in the leisure time. he results point to Belo Horizonte (58.0%, 95%CI 55.1-60.9) as the capital with the highest prevalence of general leisure-time physical inactivity, while Macapa (44.8%, 95%CI 42.1-47.6) was the capital with the lowest prevalence. he highest prevalence of physical inactivity by sex were observed in Salvador (75.7%, 95%CI 71.4-79.5) and Florianopolis (44.4%, 95%CI 38.5-50.4) for female and male sexes, respectively (Figure 1).
Table 1. Sample size, estimate of the population of adolescent students, prevalence and prevalence ratios of leisure-time physical inactivity and no physical activity according to macro-region and sociodemographic characteristics. ERICA, Brazil, 2013-2014.
Variable Sample
(n)a
Population (N)b
Physical inactivity (< 300 min/week) No physical activity (0 min/week)
% 95%CI PRadjustedc 95%CI % 95%CI PR
adjusted
c 95%CI
Brazil 74,589 10,147,700 54.3 53.4-55.2 - - 26.5 25.8-27.3 -
-Macro-region
North 15,073 855,362 49.8 48.7-50.9 1.00 - 27.2 26.1-28.3 1.00
-Northeast 23,167 2,165,033 55.7 53.2-58.1 1.14 1.07-1.21 29.5 27.8-31.4 1.13 1.04-1.23
Southeast 17,080 5,153,506 54.8 53.5-56.1 1.17 1.12-1.22 26.5 25.3-27.7 1.04 0.96-1.12
South 9,542 1,195,789 55.8 53.5-58.1 1.16 1.09-1.23 22.9 20.9-25.1 0.88 0.76-1.01
Midwest 9,727 778,010 50.1 47.8-52.4 1.04 0.98-1.10 23.6 22.0-25.2 0.92 0.83-1.00
Sex
Female 41,225 5,052,137 70.7 69.5-71.9 1.00 - 39.8 38.8-40.9 1.00
-Male 33,364 5,095,563 38.0 36.7-39.4 0.53 0.51-0.56 13.4 12.4-14.4 0.32 0.29-0.36
Age (years)
12-13 20,571 3,562,176 52.0 50.6-53.4 1.00 - 21.0 19.8-22.2 1.00
-14-15 27,889 3,550,879 54.2 52.9-55.6 1.06 1.02-1.11 26.6 25.3-27.8 1.35 1.24-1.46
16-17 26,129 3,034,645 57.1 55.5-58.6 1.11 1.06-1.16 33.1 31.7-34.4 1.66 1.54-1.80
Skin color
White 26,477 4,099,110 55.4 54.1-56.6 1.00 - 26.3 25.1-27.6 1.00
-Black 5,654 821,258 47.9 44.5-51.3 0.87 0.80-0.95 25.8 22.8-29.0 0.94 0.80-1.11
Brown 37,984 4,943,938 54.6 53.5-55.7 0.96 0.93-0.99 26.6 25.5-27.7 0.88 0.82-0.95
Yellow 1,881 215,840 54.0 49.1-58.8 0.99 0.90-1.09 26.4 22.9-30.3 0.96 0.83-1.11
Indigenous 561 67,554 39.4 29.8-50.0 0.68 0.56-0.82 15.1 11.0-20.2 0.63 0.44-0.90
Economic class
A (high) 6,336 1,100,099 42.2 38.5-46.1 1.00 - 15.9 13.4-18.7 1.00
-B 25,258 5,495,819 51.4 50.0-52.8 1.14 1.04-1.25 23.4 22.3-24.5 1.30 1.09-1.54
C 17,339 3,389,885 58.5 57.0-60.1 1.24 1.13-1.36 30.2 28.9-32.5 1.49 1.25-1.78
D-E (low) 936 161,898 64.6 58.0-70.6 1.33 1.17-1.51 32.7 26.8-39.2 1.49 1.15-1.93
ERICA: Study of Cardiovascular Risks in Adolescents; PR: prevalence ratio
a Non-weighted values.
b Population of adolescents, according to the Brazilian Institute of Geography and Statistics.
Among Brazilian adolescents, 26.5% (95%CI 25.8-27.3) reported not to perform physical activity during the leisure time (0 min/week), with higher prevalence in females (39.8%, 95%CI 38.8-40.9%) than males (13.4%, 95%CI 12.4-14.4) (Table 1). In Joao Pessoa, the capital with higher prevalence of no physical activity, one every three adolescents does not practice any physical activity during the leisure time, a ratio that changes to one for every two when considering the female sex (Figure 2).
Table 1 presents the prevalence and adjusted prevalence ratios in the total sample, to physical inactivity and no physical activity according to the independent variables. he highest prevalence of leisure-time physical inactivity were observed in the Northeast for any physical activity; and in the Northeast and South when the cutof point was at least 300 min/week. In the adjusted model, the prevalence of physical inactivity in both categories is associated directly with age and inversely with economic level (p-value for linear trend < 0.05).
Male 34.9 37.9 33.7 33.5 34.5 34.5 29.7 25.0 37.6 39.6 40.8 40.7 38.4 38.8 36.6 37.5 31.7 41.0 29.9 37.5 35.2 36.8 35.5 36.2 43.2 42.3 37.2 37.1 42.1 40.7 44.4 43.4 Female 67.3 66.6 65.7 63.3 67.5 62.9 60.9 63.8 73.1 75.7 74.3 67.5 69.6 69.6 70.3 69.8 69.5 67.2 65.4 67.9 65.6 66.3 66.0 72.5 73.0 71.5 70.0 63.6 70.3 67.7 62.8 70.0 North Countryside Belem Porto Velho Manaus Palmas Rio Branco Boa Vista Macapa Prevalence (%) 0 80.0 0 80.0 0 80.0 Northeast Countryside Salvador Joao Pessoa Aracaju Teresina Maceio Fortaleza Recife Natal Sao Luis Midwest Countryside Goiania Campo Grande Cuiaba Brasilia Southeast Countryside Belo Horizonte Sao Paulo Rio de Janeiro Vitoria South Countryside Curitiba Florianopolis Porto Alegre General 50.9 52.4 49.6 48.5 51.3 48.7 45.2 44.8 56.9 56.8 54.0 55.2 53.6 54.7 52.9 53.5 49.8 57.0 47.6 52.5 50.8 51.2 50.8 54.2 58.0 56.8 53.3 50.7 56.1 54.0 53.6 56.6
After stratiication by sex, the highest prevalence of physical inactivity were in the Northeast and Southeast in the female sex, and in the South region between male adolescents. Among girls, the higher age (p < 0.001) and the lowest socioeconomic class (p < 0.001) were associated with higher prevalence of physical inactivity. In male adolescents, the prevalence of physical inactivity tended to increase as the socioeconomic condition decreased (p = 0.003); to declare oneself as indigenous, black or brown were protection factors regarding physical inactivity in the adjusted model (p < 0.05) (Table 2).
Concerning the non-practice of physical activity (Table 3), we also observed an increasing gradient of the prevalence of no physical activity at leisure with increasing age in both sexes (p < 0.001). Worst socioeconomic condition was associated with higher prevalence of no leisure-time physical activity only among female adolescents (p = 0.001).
Figure 2. Prevalence (%) of no physical activity during the leisure time (0 min/week) in adolescents of the 27 Brazilian capitals (green bars) and set of municipalities with more than 100,000 inhabitants, not capitals of regions, according to sex. ERICA, 2013-2014.
Prevalence (%)
0 30.0
0 60.0
General Female Male
Table 2. Prevalence (%) and prevalence ratios for leisure-time physical inactivity (< 300 min/week) according to sex, macro-region and sociodemographic characteristics in adolescents. ERICA, Brazil, 2013-2014.
Variable
Physical inactivity (< 300 min/week)
Female Male
% 95%CI PRadjusteda 95%CI % 95%CI PR
adjusted
b 95%CI
Macro-region
North 65.4 63.7-67.1 1.00 - 34.1 32.5-35.8 1.00
-Northeast 72.0 69.9-74.0 1.13 1.08-1.19 39.3 35.8-42.9 1.15 1.01-1.30
Southeast 72.0 69.8-74.1 1.16 1.11-1.22 37.8 35.8-39.7 1.15 1.05-1.26
South 69.7 67.8-71.6 1.12 1.06-1.18 42.1 38.3-46.0 1.19 1.05-1.34
Midwest 66.1 63.8-68.2 1.05 0.99-1.10 34.1 31.1-37.1 1.02 0.92-1.13
Age (years)
12-13 66.3 64.5-68.1 1.00 - 38.0 35.4-40.6 1.00
-14-15 72.5 70.7-74.3 1.10 1.06-1.15 36.1 34.3-38.0 0.99 0.90-1.10
16-17 73.8 71.9-75.6 1.12 1.07-1.18 40.3 38.2-42.4 1.09 0.99-1.20
Skin color
White 70.9 69.2-72.5 1.00 - 40.4 38.3-42.6 1.00
-Black 67.4 63.1-71.4 0.96 0.88-1.03 34.4 30.8-38.2 0.75 0.64-0.89
Brown 71.3 69.9-72.6 0.99 0.96-1.03 36.5 34.8-38.2 0.91 0.84-0.98
Yellow 65.5 58.9-71.5 0.94 0.86-1.02 41.7 34.7-49.0 1.08 0.89-1.30
Indigenous 62.0 51.4-71.5 0.86 0.71-1.05 29.3 16.4-46.4 0.52 0.38-0.71
Economic class
A (high) 59.4 55.1-63.6 1.00 - 31.4 27.0-36.2 1.00
-B 68.1 66.4-69.8 1.13 1.03-1.23 35.8 33.9-37.8 1.17 1.00-1.37
C 73.5 71.4-75.4 1.22 1.13-1.32 39.9 37.3-42.6 1.33 1.12-1.59
D-E (low) 80.0 73.9-85.0 1.33 1.20-1.48 40.5 29.0-53.1 1.34 0.96-1.87
ERICA: Study of Cardiovascular Risks in Adolescents; PR: prevalence ratio
a Adjusted model for macro-region, age and economic class.
b Adjusted model for macro-region, age, economic class and skin color.
Table 3. Prevalence (%) and prevalence ratios for no physical activity (0 min/week) in the leisure time according to sex, macro-region and sociodemographic characteristics in adolescents. ERICA, Brazil, 2013-2014.
Variables
No physical activity (0 min/week)
Female Male
% 95%CI PRadjusted
a 95%CI % 95%CI PR
adjusted
b 95%CI
Macro-region
North 39.8 38.3-41.3 1.00 - 14.6 13.3-16.1 1.00
-Northeast 44.0 42.1-46.0 1.17 1.08-1.27 15.0 13.1-17.2 0.99 0.80-1.23
Southeast 39.9 38.2-41.7 1.07 0.98-1.17 13.2 11.5-15.0 0.90 0.72-1.13
South 34.6 31.1-38.2 0.90 0.78-1.06 11.5 10.3-12.7 0.74 0.58-0.93
Midwest 35.6 33.2-38.2 0.96 0.87-1.06 11.5 10.1-13.1 0.77 0.62-0.95
Age (years)
12-13 31.5 29.6-33.5 1.00 - 10.6 9.3-13.4 1.00
-14-15 41.1 39.2-43.1 1.32 1.19-1.45 12.2 10.8-13.7 1.47 1.20-1.80
16-17 48.0 46.3-49.6 1.56 1.42-1.72 18.0 16.4-19.8 2.01 1.68-2.41
Skin color
White 39.3 37.3-41.4 1.00 - 13.8 12.5-15.3 1.00
-Black 42.5 38.4-46.7 0.97 0.84-1.13 14.2 10.9-18.4 0.87 0.59-1.27
Brown 39.7 38.1-41.3 0.91 0.84-0.98 12.4 11.2-13.8 0.80 0.69-0.93
Yellow 38.4 32.9-44.1 0.96 0.83-1.11 13.7 9.8-18.8 0.96 0.63-1.48
Indigenous 36.0 26.9-46.3 0.80 0.55-1.17 5.5 3.2-9.3 0.37 0.19-0.73
Economic class
A (high) 25.9 21.2-31.3 1.00 - 9.5 7.2-12.5 1.00
-B 35.6 33.7-37.5 1.34 1.09-1.65 12.0 10.7-13.5 1.29 0.97-1.70
C 44.2 42.0-46.4 1.60 1.30-1.97 12.7 11.0-14.5 1.32 0.95-1.83
D-E (low) 43.4 34.5-52.7 1.54 1.18-2.00 16.1 10.4-24.2 1.51 0.88-2.59
ERICA: Study of Cardiovascular Risks in Adolescents; RP: prevalence ratio
a Adjusted model for macro-region, age and economic class.
DISCUSSION
ERICA data showed that more than half of Brazilian adolescents, residents of cities of medium and large size, do not reach the recommendation of at least 300 min/week of physical activity for health promotion. This percentage is even higher among girls, surpassing 70.0%. Equally disturbing is the fact that one in four adolescents do not practice any physical activity in the leisure time, a prevalence that approaches 50.0% among girls in some capitals.
The measurement of population levels of physical activity, especially in childhood and adolescence, is quite complex and to compare studies is difficult. The use of questionnaires does not always produce accurate estimates, which can lead to misclassification, and its agreement with direct measures is only partial21. However,
using direct measurement methods, such as accelerometer, would be infeasible in a study as ERICA due to high costs and the complex logistics involved. The use of an already validated instrument12 increases the reliability of the data, however it does
not reduce the difficulty of comparisons due to the different instruments used and the different domains of physical activity assessed in each study. In this study we decided to investigate only physical activity during the leisure time, because it is the most explored domain on the ERICA questionnaire, when compared to the other issues, and because it is the most important area for the implementation of the recommendations of physical activity among Brazilian adolescents19.
he scientiic literature shows that the practice of physical activity in adolescence is associated with numerous health beneits during adolescence and with equally important relections on adulthood11,15,18. Although many studies use the recommendation of at least
300 min/week of moderate to vigorous physical activity for health promotion in adolescents, evidence support that smaller volumes can also bring benefits. These variations are supported by multicausal origins of each morbidity, especially chronic ones, as well as by diferent physiological mechanisms that can relate physical activity to a certain morbidity. A systematic review showed that 30 min/day of physical activity are suicient to obtain cardiovascular beneits in health among adolescents16. However, a randomized clinical trial
involving overweight and inactive young people pointed out that 20 min of aerobic physical activity, practiced ive times a week, for 13 weeks, already reduces the risk of developing diabetes, general percentage of fat and visceral fat, and also improves physical itness when compared to the control group that kept usual routine8.
Interventions that encourage the transition from total physical inactivity to a state of action, regardless of the frequency of physical activity initially practiced, can promote immediate impacts. his strategy can work complementary to programs aimed at the maintenance and gradual increase of the practice of physical activity among adolescents. he leisure domain is favorable to the development of interventions.
In this context, school seems to be the ideal space to conduct these interventions, due to the large concentration of adolescents, safety, physical space and professionals able to stimulate and supervise these activities. To increase the efective time of physical practice during physical education classes and to make them more attractive should be a goal, as well as reducing the number of layofs. Other actions such as sedentary time interruptions during class, active intervals proposition and extracurricular activities are strategies that have been studied and could increase the practice of physical activities in schools and have important consequences outside them6. However, these actions must be connected to an
increased social support for practice and improving access, making it socially egalitarian, especially in countries of socioeconomic conditions so heterogeneous as Brazil.
Country are still rare in this thematic2. In ERICA, these regions showed the lowest prevalence
of leisure-time physical inactivity, regardless of sex. he latest edition of PeNSE also noted greater performance of leisure time activities in the North region, and related this result to cultural issues and favorable urban features not always found in more urbanized regions such as the Southeast, Northeast and South of the Country19. However, further studies are
needed in those regions for a better understanding of the associated and promoters factors of the practice of physical activity.
Higher prevalence of physical inactivity in the female sex is often seen, especially during the leisure time3,14,19. he same occurs with increasing age10, being even more pronounced
in the transition from adolescence to adulthood1, a phase that the adolescents studied have
yet to experience. Socioeconomic status was associated with physical inactivity among girls, especially in relation to not reaching the recommendation of at least 300 min/week, reinforcing the interpretations that related this variable to the opportunity to practice structured physical activity (purchase of equipment, transportation, payment of fees, among others) and emotional and social support of family (as permission, stimulus, company to practice and easier access to information)9.
he irst data about physical inactivity of ERICA help size how challenging is this problem in Brazil. hese results are useful for directing actions that seek to reduce physical inactivity in Brazilian adolescents. Future analyses of ERICA can expand this knowledge by assessing, for example, the importance of the school structure, seasonality and climatic variations, and the relation of physical inactivity with several cardiovascular risk factors surveyed.
Investment in stimulus policies to physical activity in adolescents should be treated as priority by Government agendas relating to sport, health and education, as well as research funding institutions. Governmental actions as the Segundo Tempo, Mais Educação and Atleta na Escola programs are important steps that should be expanded. he construction of the Bill of Guidelines and Bases of the National Sport System, which aims to make the investment in sport in a government policy to mainstream the practice of sports in the country, may also be favorable.
hese resources should assist in changing the current scenario in a comprehensive manner, making school an important partner for the promotion of activities that involve the whole school community. he development of actions aimed at the transition of those who engage in no physical activity to adopt some practice must be a priority, even if these people do not achieve, at irst, the recommendations of physical activity for health.
1. Azevedo MR, Araujo CL, Silva MC, Hallal PC. Tracking of physical activity from
adolescence to adulthood: a population-based study. Rev Saude Publica. 2007;41(1):69-75.
DOI:10.1590/S0034-89102007000100010
2. Barufaldi LA, Abreu GA, Coutinho ESF, Bloch KV. Meta-analysis of the prevalence of
physical inactivity among Brazilian adolescents. Cad Saude Publica. 2012;28(6):1019-32.
DOI:10.1590/S0102-311X2012000600002
3. Bastos JP, Araujo CLP, Hallal PC. Prevalence of insufficient physical activity and associated
factors in Brazilian adolescents. J Phys Act Health. 2008;5(6):777-94.
4. Bloch KV, Szklo M, Kuschnir MC, Abreu GA, Barufaldi LA, Klein CH et al. The Study of Cardiovascular Risk in Adolescents - ERICA: rationale, design and sample characteristics of a
national survey examining cardiovascular risk factor profile in Brazilian adolescents. BMC Public
Health. 2015;15:94. DOI:10.1186/s12889-015-1442-x
5. Associação Brasileira de Empresas de Pesquisa. Critério Brasil de avaliação econômica 2013. São Paulo: ABEP; 2013. Disponível em: http://www.abep.org/criterio-brasil
6. Centers for Disease Control and Prevention. School health guidelines to promote healthy eating
and physical activity. MMWR Recomm Rep. 2011;60(RR-5):1-76.
7. Cureau FV, Duarte P, Santos DL, Reichert FF. Clustering of risk factors for noncommunicable
diseases in Brazilian adolescents: prevalence and correlates. J Phys Act Health.
2014;11(5):942-9. DOI:10.1123/jpah.2012-0247
8. Davis CL, Pollock NK, Waller JL, Allison JD, Dennis BA, Bassali R et al. Exercise dose
and diabetes risk in overweight and obese children: a randomized controlled trial. JAMA.
2012;308(11):1103-12. DOI:10.1001/2012.jama.10762
9. Dollman J, Lewis NR. The impact of socioeconomic position on sport participation among South
Australian youth. J Sci Med Sport. 2010;13(3):318-22. DOI:10.1016/j.jsams.2009.04.007
10. Dumith SC, Gigante DP, Domingues MR, Kohl HW 3rd. Physical activity change during
adolescence: a systematic review and a pooled analysis. Int J Epidemiol. 2011;40(3):685-98.
DOI:10.1093/ije/dyq272
11. Ekelund U, Luan J, Sherar LB, Esliger DW, Griew P, Cooper A. Moderate to vigorous physical
activity and sedentary time and cardiometabolic risk factors in children and adolescents. JAMA.
2012;307(7):704-12. DOI:10.1001/jama.2012.156
12. Farias Júnior JC, Lopes AS, Mota J, Santos MP, Ribeiro JC, Hallal PC. Validade e reprodutibilidade de um questionário para medida de atividade física em adolescentes: uma adaptação do
Self-Administered Physical Activity Checklist. Rev Bras Epidemiol. 2012;15(1):198-210.
DOI:10.1590/S1415-790X2012000100018
13. Hallal PC, Knuth AG, Cruz DKA, Mendes MI, Malta DC. Prática de atividade
física em adolescentes brasileiros. Cienc Saude Coletiva. 2010;15 Supl 2:3035-42.
DOI:10.1590/S1413-81232010000800008
14. Hallal PC, Andersen LB, Bull FC, Guthold R, Haskell W, Ekelund U. Global physical activity
levels: surveillance progress, pitfalls, and prospects. Lancet. 2012;380(9838):247-57.
DOI:10.1016/S0140-6736(12)60646-1
15. Hasselstrom H, Hansen SE, Froberg K, Andersen LB. Physical fitness and physical activity during adolescence as predictors of cardiovascular disease risk in young adulthood. Danish Youth
and Sports Study: an eight-year follow-up study. Int J Sports Med. 2002;23 Suppl 1:S27-31.
DOI:10.1055/s-2002-28458
16. Janssen I, Leblanc AG. Systematic review of the health benefits of physical activity and fitness in
school-aged children and youth. Int J Behav Nutr Phys Act. 2010;7:40.
DOI:10.1186/1479-5868-7-40
17. Lee IM, Shiroma EJ, Lobelo F, Puska P, Blair SN, Katzmarzyk PT. Effect of physical inactivity on major non-communicable diseases worldwide: an analysis of burden of disease and life
expectancy. Lancet. 2012;380(9838):219-29. DOI:10.1016/S0140-6736(12)61031-9
18. Moliner-Urdiales D, Ruiz JR, Ortega FB, Rey-Lopez JP, Vicente-Rodriguez G, España-Romero V et al. Association of objectively assessed physical activity with total and central body fat in
Spanish adolescents; the HELENA Study. Int J Obes (Lond). 2009;33(10):1126-35. DOI:10.1038/
ijo.2009.139
19. Rezende LF, Azeredo CM, Canella DS, Claro RM, Castro IR, Levy RB et al. Sociodemographic
and behavioral factors associated with physical activity in Brazilian adolescents. BMC Public
Health. 2014;14:485. DOI:10.1186/1471-2458-14-485
20. Sallis JF, Strikmiller PK, Harsha DW, Feldman HA, Ehlinger S, Stone EJ et al. Validation of
interviewer- and self-administered physical activity checklists for fifth grade students. Med Sci
Sports Exerc. 1996;28(7):840-51. DOI:10.1097/00005768-199607000-00011
21. Steene-Johannessen J, Anderssen SA, Ploeg HP, Hendriksen IJ, Donnelly AE, Brage S et al. Are
self-report measures able to define individuals as physically active or inactive? Med Sci Sports
Exerc. 2015 Oct 1. DOI:10.1249/MSS.0000000000000760
22. Telama R, Yang X, Viikari J, Valimaki I, Wanne O, Raitakari O. Physical activity from
childhood to adulthood: a 21-year tracking study. Am J Prev Med. 2005;28(3):267-73.
DOI:10.1016/j.amepre.2004.12.003
23. Vasconcellos MTL, Silva PLN, Szklo M, Kuschnir MCC, Klein CH, Abreu GA et al. Desenho
da amostra do Estudo do Risco Cardiovascular em Adolescentes (ERICA). Cad Saude Publica.
2015;31(5):921-30. DOI:10.1590/0102-311X00043214
24. World Health Organization. Global recommendations on physical activity for health. Geneva; 2010.
Funding: Departamento de Ciência e Tecnologia da Secretaria de Ciência, Tecnologia e Insumos Estratégicos do Ministério da Saúde (Decit/SCTIE/MS), Fundo Setorial de Saúde (CT-Saúde) do Ministério da Ciência, Tecnologia e Inovação (MCTI – Process FINEP: 01090421), the Conselho Nacional de Pesquisa (CNPq – Processes: 565037/2010-2, 405009/2012-7 e 457050/2013-6) and Fundo de Incentivo à Pesquisa do Hospital de Clinicas de Porto Alegre (FIPE-HCPA – Process: 09-098). he authors: Cureau FV has a CAPES sandwich PhD scholarship (Process BEX 9556/14-1) and Bloch KV (Process 304595/2012-8) and Schaan BD (Process 305116/2012-6) have
research productivity scholarships from CNPq.
Authors’ Contribution: Cureau FV, Silva TLN, Bloch KV, Fujimori E, Belfort DR, Carvalho KMB, Leon E and Schaan BD accompanied data collection. Cureau FV, Silva TLN, Bloch KV, Ekelund U and Schaan BD conducted the analysis and the interpretation of data. Cureau FV drafted the irst version of the manuscript under the supervision of Schaan BD and Bloch KV. All authors critically reviewed and approved the inal version of the
submitted manuscript.