ERICA: patterns of alcohol consumption in
Brazilian adolescents
Evandro Silva Freire CoutinhoI, Debora França-SantosII, Erika da Silva MaglianoIII, Katia Vergetti
BlochIII, Laura Augusta BarufaldiIV, Cristiane de Freitas CunhaV, Maurício Teixeira Leite de
VasconcellosVI, Moyses SzkloIII
I Departamento de Epidemiologia e Métodos Quantitativos em Saúde. Escola Nacional de Saúde Pública Sérgio Arouca. Fundação Oswaldo Cruz. Rio de Janeiro, RJ, Brasil
II Instituto de Medicina Social. Universidade do Estado do Rio de Janeiro. Rio de Janeiro, RJ, Brasil
III Programa de Pós-Graduação em Saúde Coletiva. Universidade Federal do Rio de Janeiro. Rio de Janeiro, RJ, Brasil IV Departamento de Vigilância de Doenças e Agravos Não Transmissíveis e Promoção da Saúde. Secretaria de
Vigilância em Saúde. Ministério da Saúde. Brasília, DF, Brasil
V Hospital de Clínicas. Universidade Federal de Minas Gerais. Belo Horizonte, MG, Brasil
VI Escola Nacional de Ciências Estatísticas. Fundação Instituto Brasileiro de Geograia e Estatística. Rio de Janeiro, RJ, Brasil
ABSTRACT
OBJECTIVE: To describe the patterns of alcohol consumption in Brazilian adolescents.
METHODS: We investigated adolescents who participated in the Study of Cardiovascular Risks in Adolescents (ERICA). his is a cross-sectional, national and school-based study, which surveyed adolescents of 1,247 schools from 124 Brazilian municipalities. Participants answered a self-administered questionnaire with a section on alcoholic beverages consumption. Measures of relative frequency (prevalence), and their 95% conidence intervals, were estimated for the following variables: use of alcohol beverages in the last 30 days, frequency of use, number of glasses or doses consumed in the period, age of the irst use of alcohol, and most consumed type of drink. Data were estimated for country and macro-region, sex, and age group. he module survey of the Stata program was used for data analysis of complex sample.
RESULTS: We evaluated 74,589 adolescents, who accounted for 72.9% of eligible students. About 1/5 of adolescents consumed alcohol at least once in the last 30 days and about 2/3 in one or two occasions during this period. Among the adolescents who consumed alcoholic beverages, 24.1% drank it for the irst time before being 12 years old, and the most common type of alcoholic beverages consumed by them were drinks based on vodka, rum or tequila, and beer.
CONCLUSIONS: here is a high prevalence of alcohol consumption among adolescents, as well as their early onset of alcohol use. We also identiied a possible change in the preferred type of alcoholic beverages compared with previous research.
DESCRIPTORS: Adolescent. Alcohol Drinking epidemiology. Prevalence. Cross-Sectional Studies. Correspondence:
Evandro Silva Freire Coutinho Escola Nacional de Saúde Pública Sérgio Arouca – FIOCRUZ Rua Leopoldo Bulhões, 1480 8º andar
21041-210 Rio de Janeiro, RJ, Brasil E-mail: [email protected]
Received: 14 Sep 2015 Approved: 29 Oct 2015 How to cite: Coutinho ESF, França-Santos D, Magliano ES, Bloch KV, Barufaldi LA, Cunha CF et al. ERICA: patherns of alcohol consumption in Brazilian adolescentes. Rev Saude Publica. 2016;50(suppl 1):8s.
Copyright: This is an open-access article distributed under the terms of the Creative Commons Attribution License, which permits unrestricted use, distribution, and reproduction in any medium, provided that the original author and source are credited.
INTRODUCTION
Alcohol is the most widely used psychotropic substance among adolescents from Brazil and around the world6. The consumption of alcoholic beverages in this group is troubling, both for their greater tendency towards impulsive behaviors in this phase of life, and for damages to brain development caused by alcohol in childhood and adolescence. Above all, it compromises the cortical region, affecting negatively the cognitive, emotional and social developments of individuals5. The use of alcohol in adolescence tends to occur along with other risk behaviors regarding health, such as use of tobacco and illicit drugs, as well as potentially dangerous sexual practices5. A longitudinal study with Finnish adolescents observed use of alcohol increased the risk of smoking in adulthood11. In addition, the early onset of alcohol use is associated with future problems related to alcohol abuse9.
he Brazilian law forbids sale of alcoholic beverages to minors (people younger than 18 years
of age). Since March 2015, those who sell, provide, serve, administer or deliver alcoholic beverages to children or adolescents (even when for free) are liable to imprisonment from
two to four years and to payment of a inea. Advertising is restricted to beverages with alcohol content equal or greater than 0.5 Gay Lussac degree (GL), whose advertisement can only be aired on radio and television between 9 p.m. and 6 a.m. Until 11 p.m., airing can only be made during breaks of programs not recommended for minors. Even so, studies have shown that a major portion of adolescents in Brazil consume alcoholic beverages10,12,13.
Studies on the use of alcohol in Brazil, having students as samples, began in the mid-1980s. Systematic review1 of 28 population studies with adolescents between 10 and 19 years
found prevalences of alcohol consumption (according to diferent deinitions) ranging
from 23.0% to 68.0%.
he aim of this paper is to describe the patterns of alcohol consumption in Brazilian adolescents.
METHODS
he Study of Cardiovascular Risks in Adolescents (ERICA) is a cross-sectional study that
assessed adolescents aged between 12 and 17 years, enrolled in public and private schools of 273 Brazilian municipalities with more than 100,000 inhabitants. Data were collected between March 2013 and December 20142.
In the sampling process, we stratified the population into 32 geographical strata, comprising the capitals of the 27 Federation units, and five strata comprising the municipalities of each one of the five macro-regions of the country. After geographical stratification, the sampling procedure had two stages: selection of the participating schools and selection of classes. The schools were selected in each geographical stratum with proportional probability to size and inversely proportional to the distance from the capital. In the second stage, three classes were selected from each school with equal probabilities during the fieldwork. Using the year of the class as age variable, only the seventh, eighth and ninth grades of elementary school and first, second and third grades of high school were eligible for the selection14.
We obtained the information by a questionnaire self-administered in the classroom, using an electronic data collector LG model GM750Q, under supervision of the study team. In addition to the sociodemographic variables, data concerning the consumption of alcoholic
beverages were also used. hese variables were measured by the following questions:
a) Age at which you took at least a glass (or a dose) of alcohol for the irst time. b) Days of ingestion of at least one glass (or a dose) of alcohol within the past 30 days.
a Brasil. Lei nº 13.106, de 17
c) Glass or doses consumed, on average, in the last 30 days.
d) Type of the most often consumed alcoholic beverage.
Measures of relative frequency (prevalence) and their respective 95% conidence intervals
were calculated for alcohol use within the past 30 days, for the frequency of such use, the amount of glasses or doses consumed in the period, age at which alcohol was taken for the
irst time, and type of the most consumed beverage. All these data were estimated for the
country and for macro-region, sex, and age group.
Prevalence estimates and conidence intervals were ixed considering the sampling design.
Analyses were performed using the command svy (survey) for the complex data analysis of the Stata program 14.0b.
ERICA was conducted according to the principles of the Declaration of Helsinki. he study
was approved by the Ethics Committees of the Universidade Federal do Rio de Janeiro (Process 45/2008) and of each one of the 26 states and the Federal District. We obtained the consents to carry out the study from the secretariats of education and schools. All students signed an assent form. When the Ethics Committee demanded, the informed consent of the children’s legal guardians even for students who would not undergo blood collection, was
also sent for signing. he privacy and information conidentiality of students was guaranteed.
RESULTS
In total, 74,589 adolescents answered the questionnaire. Of these, 55.3% were female. he average
age was 14.7 years (SD = 1.6), and 78.7% studied in public schools. Table 1 presents the distribution by sex and age of samples and the estimated population after expansion of the sample14.
Twenty-one percent of the adolescents consumed alcohol at least once in the last 30 days, the highest prevalence being observed in the South region (27.5%), and the smallest in the North region (14.8%) of Brazil. Prevalences were higher for adolescents aged between 15 and 17 years (Table 2).
b Stata Corp. Stata: statistical
software for professionals. Version 14.0. College Station, Texas; 2015.
Table 1. Adolescents of ERICA sample and of the estimated population, according to IBGE by sex, age group, and macro-regions in municipalities with more than 100,000 inhabitants. ERICA, Brazil, 2013-2014.
Sex and age Brazil % North % Northeast % Midwest % Southeast % South %
ERICA sample
Male 33,364 44.7 6,861 45.5 10,310 44.5 4,097 42.1 7,620 44.6 4,476 46.9
12-14 years 15,433 20.7 3,167 21.0 4,658 20.1 1,965 20.2 3,587 21.0 2,056 21.6
15-17 years 17,931 24.0 3,694 24.5 5,652 24.4 2,132 21.9 4,033 23.6 2,420 25.4
Female 41,225 55.3 8,212 54.5 12,857 55.5 5,630 57.9 9,460 55.4 5,066 53.1
12-14 years 18,708 25.1 3,739 24.8 5,853 25.3 2,547 26.2 4,322 25.3 2,247 23.6
15-17 years 22,517 30.2 4,473 29.7 7,004 30.2 3,083 31.7 5,138 30.1 2,819 29.5
Total 74,589 100 15,073 20.2 23,167 31.1 9,727 13.0 17.080 22.9 9,542 12.8
Estimated population
Male 5,095,563 50.2 427,365 4.2 1,082,182 10.7 389,167 3.8 2,595,521 25.6 601,328 5.9
12-14 years 2,697,440 26.6 224,876 2.2 569,111 5.6 204,588 2.0 1,375,262 13.6 323,603 3.2 15-17 years 2,398,123 23.6 202,489 2.0 513,071 5.1 184,579 1.8 1,220,259 12.0 277,725 2.7
Female 5,052,137 49.8 427,997 4.2 1,082,851 10.7 388,843 3.8 2,557,985 25.2 594,461 5.9
12-14 years 2,650,761 26.1 225,587 2.2 562,205 5.5 202,923 2.0 1,344,038 13.2 316,008 3.1 15-17 years 2,401,376 23.7 202,410 2.0 520,646 5.1 185,920 1.8 1,213,947 12.0 278,453 2.7
Total 10,147,700 100.0 855,362 8.4 2,165,033 21.3 778,010 7.7 5,153,506 50.8 1,195,789 11.8
Figure 1. Prevalence and confidence intervals of alcohol consumption in female (A) and male (B) adolescents, by capital. ERICA, Brazil, 2013-2014. A 45.0 Curitiba Florianopolis Sao Paulo Vitoria Southeast countryside Goiania Campo Grande Brasilia Midwest countryside Natal Joao Pessoa Fortaleza Maceio Teresina Aracaju Recife Sao Luis Salvador Northeast countryside Macapa Porto Velho Palmas Rio Branco Belem Manaus Boa Vista North countryside 15.0 30.0 0 Cuiaba Porto Alegre 11.8 17.0 13.2 28.6 29.7
South countryside 28.0
Rio de Janeiro 22.7
Belo Horizonte 24.0
27.9 30.0 21.1 22.1 23.0 24.0 24.1 14.7 14.8 16.7 16.8 17.0 18.3 19.2 19.9 16.0 13.1 14.1 14.9 15.1 15.7 16.9 18.3 35.6 B
15.0 30.0 45.0
0 24.9 31.8 25.8 19.9 20.6 23.3 26.4 22.2 23.1 23.3 20.6 25.9 10.1 16.6 15.7 17.0 18.9 17.1 20.4 19.1 20.3 15.9 13.5 16.3 18.2 11.0 13.9 16.4 12.4 14.4 24.1 30.3
Prevalence (%) Prevalence (%)
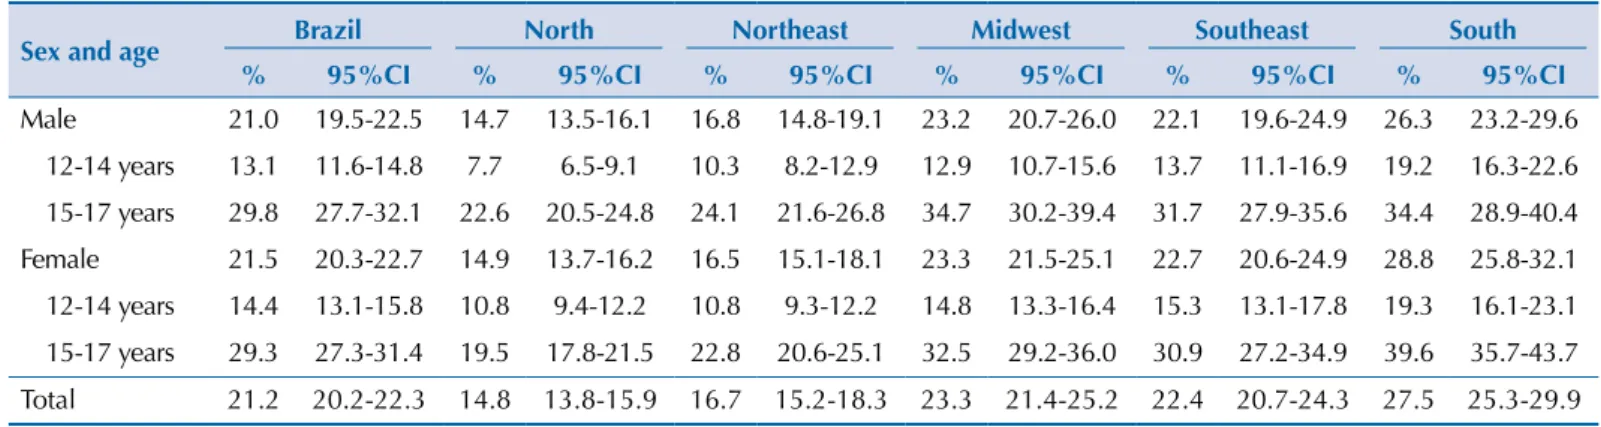
Table 2. Prevalences and confidence intervals of alcoholic beverages consumption by macro-region, sex and age group. ERICA, 2013-2014.
Sex and age Brazil North Northeast Midwest Southeast South
% 95%CI % 95%CI % 95%CI % 95%CI % 95%CI % 95%CI
Male 21.0 19.5-22.5 14.7 13.5-16.1 16.8 14.8-19.1 23.2 20.7-26.0 22.1 19.6-24.9 26.3 23.2-29.6 12-14 years 13.1 11.6-14.8 7.7 6.5-9.1 10.3 8.2-12.9 12.9 10.7-15.6 13.7 11.1-16.9 19.2 16.3-22.6 15-17 years 29.8 27.7-32.1 22.6 20.5-24.8 24.1 21.6-26.8 34.7 30.2-39.4 31.7 27.9-35.6 34.4 28.9-40.4 Female 21.5 20.3-22.7 14.9 13.7-16.2 16.5 15.1-18.1 23.3 21.5-25.1 22.7 20.6-24.9 28.8 25.8-32.1 12-14 years 14.4 13.1-15.8 10.8 9.4-12.2 10.8 9.3-12.2 14.8 13.3-16.4 15.3 13.1-17.8 19.3 16.1-23.1 15-17 years 29.3 27.3-31.4 19.5 17.8-21.5 22.8 20.6-25.1 32.5 29.2-36.0 30.9 27.2-34.9 39.6 35.7-43.7
hese prevalences were similar when stratiied by sex in the ive macro-regions (Table 2). When data were stratiied by capital, Porto Alegre, Florianopolis, and Vitoria presented
the highest prevalence of alcohol use for both sexes. Natal was the capital with the lowest prevalence (Figure 1). In the case of countryside municipalities, the South and Midwest regions showed the highest prevalences for both sexes, while North and Northeast showed the lowest rates (Figure 1).
Among adolescents who have reported drinking alcohol in the last 30 days, approximately 68.0% have done so in one or two occasions in the period (Table 3). When comparing the consumption of once to twice a month with 10 or more times, male adolescents and those who are older used alcohol more frequently. The Midwest region was the
Table 3. Frequency (number of days) of use of alcohol among adolescents who consumed alcohol in the past 30 days, by macro-region, sex, and age group. ERICA, Brazil, 2013-2014.
Frequency Brazil North Northeast Midwest Southeast South
% 95%CI % 95%CI % 95%CI % 95%CI % 95%CI % 95%CI
1-2 days
Male 67.0 64.3-69.5 71.2 66.8-75.3 68.5 63.4-73.2 68.2 63.3-72.8 65.8 61.1-70.1 65.5 60.2-70.4 12-14 73.0 68.7-76.9 78.6 71.4-84.4 74.0 64.4-81.7 78.7 72.3-84.0 71.2 64.1-77.4 71.4 61.4-79.7 15-17 60.2 57.3-63.0 62.9 58.6-67.1 62.4 58.3-66.3 56.6 50.0-63.0 59.7 54.5-64.7 58.6 54.3-62.7 Female 69.0 66.2-71.6 76.7 79.3 79.3- 73.1 69.4-76.5 61.5 56.6-66.3 67.2 62.0-72.0 68.0 64.5-71.4 12-14 74.1 69.6-78.2 83.5 79.2-87.1 79.1 73.5-83.7 62.2 53.0-70.6 71.2 62.5-78.5 78.7 73.8-82.9 15-17 63.2 60.4-66.0 69.1 64.3-73.5 66.7 62.8-70.5 60.8 56.0-65.4 62.8 57.7-67.7 55.9 50.4-61.3
Total 67.9 65.8-70.0 74.0 71.4-76.3 70.8 67.6-73.8 64.9 60.9-68.7 66.5 62.7-70.1 66.8 63.1-70.3
3-5 days
Male 16.1 14.5-17.8 12.5 10.1-15.3 11.9 10.2-13.8 14.6 11.2-18.7 18.5 21.5-15.8 17.0 21.5-15.8 12-14 12.3 10.0-15.1 8.3 5.0-13.3 6.2 4.6-8.3 6.9 3.6-12.6 16.2 12.1-21.3 13.1 7.4-22.0 15-17 19.6 17.8-21.5 17.2 14.0-21.0 18.2 15.1-21.6 23.1 17.7-29.6 21.1 17.5-25.2 21.5 18.1-25.4 Female 16.6 14.8-18.5 12.3 10.2-14.7 14.5 11.8-17.7 16.3 13.1-20.0 17.8 14.7-21.4 18.1 15.5-21.1 12-14 13.8 11.0-17.3 8.8 6.1-12.6 12.6 8.5-18.4 14.3 9.9-20.2 15.5 10.6-22.1 12.1 8.6-16.7 15-17 19.6 17.8-21.6 16.1 13.2-19.5 16.5 13.6-19.9 18.5 14.7-22.9 20.4 17.3-23.8 25.0 21.0-29.6
Total 16.3 15.0-17.8 12.4 10.7-14.3 13.2 11.6-15.0 15.4 12.7-18.7 18.2 15.8-20.8 17.6 15.4-20.0
6-9 days
Male 8.4 7.1-9.9 8.4 6.4-10.9 9.1 6.9-11.9 7.1 5.3-9.6 8.0 6.0-10.6 9.6 6.3-14.3
12-14 7.4 5.5-9.9 6.7 4.1-10.7 10.0 6.3-15.5 7.0 4.2-11.4 6.1 3.5-10.5 9.1 4.1-19.0 15-17 9.5 8.0-11.1 10.3 7.6-13.8 8.1 6.2-10.6 7.3 5.4-9.9 10.1 7.6-13.2 10.2 7.7-13.4 Female 7.7 6.5-9.1 5.4 3.7-7.7 7.6 5.7-10.0 10.5 7.6-14.4 7.6 5.6-10.3 8.0 6.0-10.6
12-14 5.9 4.3-8.0 3.5 1.7-7.1 3.8 8.0-1.8 11.4 6.6-18.8 6.4 3.9-10.5 5.5 3.2-9.2
15-17 9.6 8.2-11.3 7.4 4.3-12.4 11.6 9.3-14.4 9.5 6.7-13.5 8.9 6.6-12.0 10.8 8.3-14.0
Total 8.0 7.1-9.1 6.9 5.6-8.4 8.3 6.9-10.1 8.8 7.1-11.0 7.8 6.2-9.7 8.8 6.3-12.1
10 or + days
Male 8.6 7.3-10.0 7.9 5.3-11.6 10.5 7.8-14.0 10.0 7.5-13.3 7.8 5.8-10.3 8.0 5.8-10.8 12-14 7.3 5.4-9.7 6.4 3.1-12.6 9.8 5.8-16.1 7.5 4.4-12.3 6.5 3.8-10.9 6.4 3.3-12.2 15-17 10.0 8.5-11.8 9.6 7.2-12.7 11.4 7.7-16.5 12.9 9.9-16.7 9.2 11.9-7.0 9.7 6.9-13.5
Female 6.8 5.8-8.0 5.7 4.4-7.2 4.8 3.5-6.5 11.7 8.4-16.0 7.4 9.6-5.6 5.8 4.4-7.7
12-14 6.1 4.6-8.1 4.1 2.4-6.9 4.4 2.5-7.9 12.1 7.1-20.1 6.9 4.4-10.5 3.7 1.9-7.0
15-17 7.5 6.3-9.0 7.4 5.7-9.5 5.1 3.9-6.7 11.2 8.3-14.9 7.9 5.7-10.9 8.2 6.1-11.0
exception, the proportion of male alcohol users being greater in the group that made use of it once or twice, and in the group of females, which showed strata from six to nine times in the last month.
Among adolescents who consumed alcoholic beverages, 24.1% drank for the irst time before the age of 12, being 26.6% (95%CI 22.3-25.9) male and 21.7% (95%CI 24.2-19.4) female. his pattern repeated itself in all of the ive macro-regions of the country.
The types of alcoholic beverages most often consumed by adolescents in the country were drinks based on vodka, rum or tequila, followed by beer (Figure 2). However, this pattern varied according to the macro-region. In the North and Northeast, beer was the most reported drink, while drinks based on vodka, rum or tequila were the most referred to in the Midwest, Southeast, and South regions. In general, we observed a higher proportion of male adolescents among the consumers of beer, and of female adolescents among consumers of Ice beverages (Table 4). The consumption of beer and drinks based on vodka, rum or tequila increased with age, while Icebeverages and wine decreased.
Brazil North Northeast Midwest
Macro-region
Southeast South
Beer Ice Wine Others Cachaça
Vodka⁄Tequila⁄Rum 45.0
30.0
(%)
15.0
0 34.3 22.3 16.2 12.0 9.
2
22.9 31.8 14.8 13.6 9.8 2.9 23.6 35.8 12.0 16.6 86. 2.7 37.8 21.0 24.9 8.1 3.7 81. 40.3 14.4 17.8 10.2 10.9 43. 33.6 25.9 11.9 12.6 39. 53.
3.
1
Figure 2. Types of alcoholic beverages consumed by adolescents by macro-region. ERICA, Brazil, 2013-2014.
Table 4. Percentage of most consumed types of beverages by adolescents in the past 30 days, by sex and age. ERICA, Brazil, 2013-2014.
Variable Beer Wine Ice Cachaça
Vodka, tequila
and rum Others
% 95%CI % 95%CI % 95%CI % 95%CI % 95%CI % 95%CI
Male 25.1 22.4-27.9 11.1 9.5-13.0 12.4 10.9-14.2 3.6 2.7-4.7 35.3 32.3-38.5 8.4 7.1-10.0
12-14 23.1 19.3-27.4 13.6 11.0-16.7 13.3 11.4-15.5 3.4 5.5-2.1 30.1 26.3-34.3 10.9 8.5-13.8
15-17 27.3 24.8-29.9 8.3 7.0-10.0 11.5 9.2-14.2 3.7 2.5-5.4 41.1 37.6-44.8 5.7 4.6-6.9
DISCUSSION
he prevalence of alcoholic beverages consumption in at least one occasion in the last 30
days, found in ERICA (21.0%), was lower than the one observed in Brazilian students in the National Survey of School Health (PeNSE), held in 2009 (27.3%)10 and 2012 (26.1%)c. However, the sample of PeNSE was restricted to ninth-grade students and approximately 90.0% of them were aged between 13 and 15 years.
We observed no diference between the data of prevalence of ERICA and those found in the sixth
survey with elementary and high school students of 27 Brazilian state capitals, held in 20103.
Pinsky et al.12 (2010) reported a prevalence of 24.2% in a sub-sample of 661 Brazilian adolescents aged between 14 and 17 years, who were part of the I Levantamento Nacional
de Álcool e Drogas (LENAD – First National Alcohol and Drugs Survey), held in 2005-2006.
Prevalences of use of alcohol found in Brazil are lower than those estimated in a national study conducted in the United States in 2013 – Youth Risk Behavior Survey, in which about 35.0% of adolescents between 14 and 17 years old reported drinking alcohol in the last 30 days7. Data from the study Health Behavior in School-Aged Children (HBSC) for adolescents with 11 to 15 years from 41 countries and regions of Europe and North America are more
diicult to be compared with ours, since they are presented as weekly consumption, ranging
from 0% to 59.0%, depending on the country, sex and age group5.
As well as in our study, data on adolescents from LENAD 2005-2006 and PeNSE 2012 showed higher prevalence of alcohol use in adolescents residing in Southern Brazil, and lower for those in the North region. However, in the case of LENAD 2005-2006, the authors combined the North and Midwest macro-regions in the same stratum12. A study with adolescents aged between 11 and 15 years from the general population of the city of Pelotas, in Southern Brazil, found prevalence of alcohol use of 23.0% in the past month13. he prevalence of alcohol use in this study, as well as in those reported by Pinsky et al.12, in LENAD 2005-2006, and by Malta et al.10, in PeNSE, increased with age, which suggests consumption maintenance by those who started early and accession of new users over time.
Our results, when estimated by macro-region, are consistent with the indings of Pinsky et al.12 (2010) and Strauch et al.13 (2009), which did not observe diferences in prevalence of alcohol users in the past 30 days among male and female adolescents. However, male adolescents seem to make a more intense use of it, especially when taking into account the monthly frequency of 10 times or more.
A quarter of the adolescents who reported alcohol consumption in the last month in this study,
took it for the irst time before the age of 12, this proportion being greater among male adolescents.
Other national and international studies also reported an early onset in the experimentation of alcoholic beverages3,7,10,12. his is disturbing when considering that the consumption of alcoholic beverages is only legal in Brazil for individuals aged 18 years or more, and that early initiations have been linked with increased risks of unintentional injuries, car accidents, sexual risk behaviors, use of tobacco and illicit drugs, as well as cognitive impairment in adult life9,11.
When we analyze the types of most commonly consumed beverages, it seems that the
preference has been changing. Our data were very diferent from those reported by Pinsky et al.12, in LENAD 2005-2006 adolescents sub-sample. In the latter, the beverage reported as the most consumed was beer (about 50.0%), followed by wine (about 35.0%). Overall, our study found a greater consumption of distillates (vodka, rum, and tequila), especially in the Midwest, Southeast, and South regions. Even in the North and Northeast, where beer was the most consumed beverage, drinks based on vodka, rum or tequila came second, exceeding 20.0% in the proportion of most consumed drinks in the last month, regardless of sex. Considering the South is a region of cooler climate and also a wine producer, wine were the third in the rank
of most consumed beverages, with about 13.0%. herefore, we observed likely changes in the
favorite type of beverage of Brazilian adolescents, who have been opting for high alcohol content drinks. Such hypothesis deserves to be investigated in future studies with this population
c Instituto Brasileiro de Geografia
group, along with the motivations for such behavior. An explanation we should consider is that adolescents have been searching for more tasty alcohol beverages, which is easily obtained by mixing it with soft drinks, juices, and milky and. A study with 350 young people from Sydney,
Australia, identiied these drinks as the favorite ones among this age group4. Another aspect we should highlight regarding the consumption of this type of beverage is that, since it contains
a higher alcohol concentration (about 40.0%), distilled beverages provide the efects of high
alcohol intakes even with the consumption of small amounts.
ERICA data represent the consumption proile of adolescents attending schools and residing
in medium or large municipalities, i.e., with more than 100,000 inhabitants. Nevertheless,
these indings are close to those concerning adolescents of the general population of Brazil,
since the access to school is of about 95.0% of the population from six to 14 years old, and of 85.0% from 15 to 19 years oldd.
Concluding, we observed high prevalence of use of a substance whose consumption is prohibited by law in the age group covered by this study. Additionally, the data showed early onset of alcohol use and possible changes in preferences compared to previous research. However, the results for studies with student populations should be considered carefully
when the aim is to generalize the indings to populations that may be outside the school
environment. For this reason, studies with the general population of adolescents are needed to better investigate such trends.
he understanding of consumption patterns is essential to eliminate preconceived ideas when it comes to the most afected groups and the usage patterns of alcohol by adolescents,
providing subsidies for the development of public policies of prevention and treatment. According to Laranjeira et al.8, most of the Brazilian adult population supports the increase of preventive and restrictive programs to the use of alcohol to be carried out in schools and government campaigns. Given that, there is a need for policies accompanied by
continuous efectiveness assessments to regulate the alcohol market and avoid the early
consumption of alcoholic beverages.
1. Barbosa Filho VC, Campos W, Lopes AS. Prevalence of alcohol and tobacco use among Brazilian adolescents: a systematic review. Rev Saude Publica. 2012;46(5):901-17. DOI:10.1590/S0034-89102012000500018
2. Bloch KV, Szklo M, Kuschnir MC, Abreu GA, Barufaldi LA, Klein CH et al. The Study of Cardiovascular Risk in Adolescents - ERICA: rationale, design and sample characteristics of a national survey examining cardiovascular risk factor profile in Brazilian adolescents. BMC
Public Health. 2015;15:94. DOI:10.1186/s12889-015-1442-x
3. Carlini ELA, Noto AR, Sanchez ZM, Carlini CMA, Locatelli DP, Abeid LR et al. VI Levantamento Nacional sobre o Consumo de Drogas Psicotrópicas entre Estudantes do Ensino Fundamental e Médio das Redes Pública e Privada de Ensino nas 27 Capitais Brasileiras – 2010. São Paulo: Centro Brasileiro de Informações sobre Drogas Psicotrópicas – UNIFESP; Brasília (DF): Secretaria Nacional de Políticas sobre Drogas; 2010.
4. Copeland J, Stevenson RJ, Gates P, Dillon P. Young Australians and alcohol: the acceptability of ready-to-drink (RTD) alcoholic beverages among 12-30-years-old. Addiction.
2007;102(11):1740-6. DOI:10.1111/j.1360-0443.2007.01970.x
5. Currie C, Zanotti C, Morgan A, Currie D, Looze M, Roberts C et al. Social determinants of health and well-being among young people. Health Behaviour in School-aged Children (HBSC) study: international report from the 2009/2010 survey. Copenhagen: WHO Regional Office for Europe; 2012. (Health Policy for Children and Adolescents, 6). 2012.
6. Fader VB. Epidemiology, 1. In: Galanter M, Lowman C, Boyd GM, Fader VB, Witt D, Lagressa D, editors. Recent developments in alcoholism. Vol 17, Alcohol problems in adolescents and young adults: epidemiology, neurobiology, prevention, treatment. New York: Kluwer Academic; Plenum Publishers; 2005. p.1-4.
REFERENCES
d Instituto Brasileiro de Geografia
7. Kann L, Kinchen S, Shanklin SL, Flint KH, Hawkins J, Harris WA et al. Youth risk behavior surveillance – United States, 2013. MMWR Surveill Summ. 2014;63(Suppl 4):1-168. 8. Laranjeira R, Pinsky I, Zaleski M, Caetano R. I Levantamento Nacional Sobre os Padrões de
Consumo de Álcool na População Brasileira. Brasília (DF): Secretaria Nacional Antidrogas; 2007. 9. Maggs JL, Schulenberg JE. Initiation and course of alcohol consumption among adolescents
and young adults. In: Galanter M, Lowman C, Boyd GM, Fader VB, Witt D, Lagressa D, editors. Recent developments in alcoholism. Vol 17, Alcohol problems in adolescents and young adults: epidemiology, neurobiology, prevention, treatment. New York: Kluwer Academic; Plenum Publishers; 2005. p.29-41.
10. Malta DC, Mascarenhas MDM, Porto DL, Barreto SM, Morais Neto OL. Exposição ao álcool entre escolares e fatores associados. Rev Saude Publica. 2014;48(1):52-62. DOI:10.1590/S0034-8910.2014048004563
11. Paavola M, Vartiainen E, Haukkala A. Smoking, alcohol use, and physical activity: a 13-year longitudinal study ranging from adolescence into adulthood. J Adolesc Health. 2004;35(3):238-44. DOI:10.1016/j.jadohealth.2003.12.004
12. Pinsky I, Sanches M, Zaleski M, Laranjeira R, Caetano R. Patterns of alcohol use among Brazilian adolescents. Rev Bras Psiquiatr. 2010;32(3):242-9. DOI:10.1590/S1516-44462010005000007 13. Strauch ES, Pinheiro RT, Silva RA, Horta BL. Uso de álcool por adolescentes:
estudo de base populacional. Rev Saude Publica. 2009;43(4):647-55. DOI:10.1590/S0034-89102009005000044
14. Vasconcellos MTL, Silva PLN, Szklo M, Kuschnir MCC, Klein CH, Abreu GA et al. Desenho da amostra do Estudo do Risco Cardiovascular em Adolescentes (ERICA). Cad Saude Publica. 2015;31(5):921-30. DOI:10.1590/0102-311X00043214
Funding: Department of Science and Technology of the Secretary of Science, Technology and Strategic Inputs of the Brazilian Ministry of Health (Decit/SCTIE/MS); Health Sector Fund (CT-Saúde) of the Brazilian Ministry of Science, Technology and Innovation (MCTI) (FINEP – Protocol 01090421); Conselho Nacional de Desenvolvimento
Cientíico e Tecnológico (CNPq – Processes 565037/2010-2012-2 and 405,009/2012-7); Fundação Carlos Chagas
Filho de Amparo à Pesquisa do Estado do Rio de Janeiro (FAPERJ – Process E-26/102,786/2012).
Authors’ Contribution: Design and planning of the study: ESFC and KVB. Analysis and interpretation of data: ESFC, DF-S, ESM and KVB. Literature review: LAB. Discussion of the results: LAB, MTLV and MS. Drafting of the unpublished study: ESFC, DF-S, ESM, KVB, LAB, CFC, MTLV and MS.
Acknowledgements: To the Brazilian Institute of Geography and Statistics for the disposal of electronic data
collectors, the PDA (personal digital assistant), and to the Fundação Universitária José Bonifácio (FUJB), for the
managing of resources of this study.