Rev Saúde Pública 2014;48(4):583-593
Brazilian version of the
Quality of Care Scale: the
perspective of people with
disabilities
Versão brasileira do
Quality of
Care Scale
: qualidade de cuidado
na perspectiva de pessoas com
incapacidades
I Programa de Pós-Graduação em Ciências
Médicas: Psiquiatria. Universidade Federal do Rio Grande do Sul. Porto Alegre, RS, Brasil
II Faculdade de Engenharia. Universidade do
Vale do Sinos. São Leopoldo, RS, Brasil
III Aluno de Graduação em Psicologia.
Faculdade de Desenvolvimento do Rio Grande do Sul. Porto Alegre, RS, Brasil
IV Serviço de Psiquiatria. Hospital de Clínicas
de Porto Alegre. Porto Alegre, RS, Brasil Correspondence:
Juliana Bredemeier
Rua Luiz Afonso, 84 Cidade Baixa 90.050-310 Porto Alegre, RS, Brasil E-mail: [email protected] Received: 7/19/2013
Approved: 2/10/2014
Article available from: www.scielo.br/rsp
ABSTRACT
OBJECTIVE: To analyze evidence of the validity and reliability of a Brazilian Portuguese version of the Quality of Care Scale from the perspective of people with physical and intellectual disabilities.
METHODS: There were 162 people with physical disabilities and 156 with intellectual disabilities from Porto Alegre and metropolitan region, who participated in the study in 2008. Classical psychometrics was used to independently analyze the two samples. Hypotheses for evidence of criterion validity (concurrent type) were tested with the Mann-Whitney test for non-normal distributions. Principal components analysis was used to explore factorial models. Evidence of reliability was calculated with Cronbach alpha for the scales and subscales. Test-retest reliability was analyzed for individuals with intellectual disabilities through intra-class correlation coeficient and the Willcoxon test.
RESULTS: The principal components in the group with physical disabilities replicated the original model presented as a solution to the international project data. Evidence of discriminant validity and test-retest reliability was found.
CONCLUSIONS: The transcultural factor model found within the international sample project seems appropriate for the samples investigated in this study, especially the physical disabilities group. Depression, pain, satisfaction with life and disability may play a mediating role in the evaluation of quality of care. Additional research is needed to add to evidence of the validity of the instruments.
DESCRIPTORS: Disabled Persons. Health of the Disabled. Quality of Health Care. Scales. Validation Studies.
Original Articles DOI:10.1590/S0034-8910.2014048005056
Juliana BredemeierI
Marilyn AgranonikII
Tatiana Spalding PerezIII
584 Brazilian version of QOCS Bredemeier J et al
Concern with the quality of care given in health servi-ces stems from the relationship between this construct and expectation and quality of life.18 The World Health
Organization (WHO) understands that quality in a health system presupposes a constant concern with six funda-mental dimensions: eficacy (concern with real demands), eficiency (maximization of resources and reduction of waste), acceptance (focus on the patient, consideration of the preferences and cultural aspirations of each commu-nity), accessibility, equality, and safety.18 Quality of care
(QC) involves the application of these quality dimensions in health to the offer of care and well-being and makes its conirmation possible from evaluating perspectives.18
It is estimated that more than one billion people in the world live with disabilities and approximately 200 million of those people have considerable functional dificulties.19
RESUMO
OBJETIVO: Analisar as evidências de validade e idedignidade da versão para o português brasileiro da Quality of Care Scale na perspectiva de pessoas com incapacidades físicas e intelectuais.
MÉTODOS: Participaram do estudo 162 pessoas com incapacidades físicas e 156 com incapacidades intelectuais em Porto Alegre e região metropolitana, 2008. A psicometria clássica foi utilizada para analisar as duas amostras independentemente. As hipóteses para evidências de validade de critério do tipo concorrente foram avaliadas com teste de Mann-Whitney. A análise de componentes principais foi utilizada para exploração dos modelos fatoriais. Evidências de idedignidade foram calculadas com α de Cronbach para escalas e subescalas. A idedignidade teste-reteste para pessoas com incapacidades intelectuais foi analisada pelo coeiciente de correlação intraclasse e teste de Willcoxon.
RESULTADOS: Os componentes principais no grupo de pessoas com incapacidades físicas replicou o modelo original apresentado em solução aos dados internacionais do projeto. Foram encontradas evidências de validade discriminante e de idedignidade teste-reteste.
CONCLUSÕES: O modelo fatorial transcultural encontrado na amostra internacional do projeto parece adequado para as amostras testadas neste estudo, especialmente a de incapacidades físicas. Depressão, dor, satisfação com a vida e incapacidade parecem ter papel mediador na avaliação da qualidade de cuidado. Pesquisas adicionais são necessárias para o acréscimo de evidências às validades dos instrumentos.
DESCRITORES: Pessoas com Deiciência. Saúde da Pessoa com Deiciência. Qualidade da Assistência à Saúde. Escalas. Estudos de Validação.
INTRODUCTION
According to the United Nations Organization (UN),a 2/3
of the people with disabilities live in developing countries. This number increases continuously with population growth, wars and other forms of violence, inappropriate medical care, accidents, and increasing life expectancy. According to the UN, in 2010, 3.9% of the people in Brazil had disa-bilities, which represents 23.9% of the general population in that period.b Considering the people affected indirectly
by the disability of someone close, more than half of the world population is affected by issues related to disability.a
Thus, studies on QC received by people with disabilities have become important for public health.
QC evaluation in the scope of healthcare is extremely important and must be made with seriousness and care to prevent gathering unreliable evidence. In addition, the QC evaluation must consider that the concept is
a United Nations, Department of Economic and Social Affairs, Division for Social Policy and Development. The United Nations and disabled
persons: the first fifty years. New York; 2003-2004 [cited 2013 Jul 4]. Available from: http://www.un.org/esa/socdev/enable/dis50y01.htm
b Instituto Brasileiro de Geografia e Estatística. Censo demográfico 2010: características gerais da população, religião e pessoas com
585 Rev Saúde Pública 2014;48(4):583-593
dynamic and inluenced by the interactions between users and providers.5,6,10 Studies have turned to the use of and
access to health services,8,9,10 to the patient’s safety,14
and to the QC evaluation in speciic diseases.15 Few
studies have explored the perspective of people with disabilities on the elements that are important for QC.6,8
The present study analyzes the validity and reliability of the QC scale that measures QC from the perspec-tive of people with physical and intellectual disabili-ties. This study was originally drafted in the Brazilian Portuguese Language.
METHODS
This study is one stage of the DISQOL Project,5
coordi-nated by the WHO Quality of Life Group (WHOQOL Group), whose objective was to develop three instru-ments to evaluate people with disabilities: (1) quality of life, (2) quality of care, and (3) attitudes towards disa-bilities. The exploration of the concept by focal groups, comprising people with disabilities, family members, professionals, and caregivers,10 was followed by the
pilot study and a ield test that consolidated the results of 16 centers participating in the project.5
The present study included 320 individuals, whose ages ranged from 18 to 65 years; who have had physical or intellectual disabilities for at least two years and who frequented or were hospitalized in an institution that cares for disabled people, in an NGO, and in a school or health service center in Porto Alegre and its metropoli-tan region. In the case of people with physical disability, the disability needed to be self-declared by answering positively to the question: “Do you have a disability?” or at least to one of two additional questions: “Does your chronic disease cause you any limitation in your daily activities?” or “Does your chronic disease cause you any social restriction (social participation)?” These questions were included to respect the deinition of disability given by the International Classiication of Functioning, Disability, and Health (ICF) published by the WHO.c The exclusion criterion for the people with
intellectual disability was a failure in at least one of the two tests used in the pre-interview screening: the Acquiescence Test (adapted from Cumminsd), which
identiies the tendency to agree and the Discriminative Competence Test (adapted from Dalton3), which
eva-luates the competence to discriminate choices on a three-point scale.7 The sample was obtained by
conve-nience. The WHOQOL Group stipulates a number of participants per center based on its broad experience
with studies of this kind. It is dificult to ind a base on literature or on conventional sample size calculations due to the transcultural nature, simultaneity, and origi-nality of the study. Thus, the goal of 150 people with physical disabilities and 150 people with intellectual disabilities for each participating center was stipulated.5
The individuals answered the following instruments:
• World Health Organization Disability Assessment Schedule II (WHODAS II): disability measure-ment in the ICF conceptual frame developed by the WHO17 (2000). Cronbach α: 0.98.
• Sociodemographic questionnaire: questions on socio-economics and perception of the participant on his or her health condition and disability.
• Quality of Care Scale – Physical Disabilities (QOCS-D): instrument that evaluates QC for peo-ple with physical disabilities19 (Annex). This
ins-trument contained 17 items developed from the material generated by international focus groups. Two items (18 and 19; Annex) were added to this transcultural proposal and inserted after analyzing the material generated in the local focus groups.
• Quality of Care Scale – Intellectual Disabilities (QOCS-ID): instrument that evaluates QC for peo-ple with intellectual disability.19 It is identical to
QOCS-D (including local questions), but with a variation in the scale of answers, which has three points in this version. This version has graphic images (“smile faces”) introduced to facilitate the understanding of the respondents.
• Satisfaction with Life Scale (SWLS):4,e this is a scale
with ive items. The higher the score, the higher the satisfaction with life. Cronbach α: 0.82.4
• Beck Depression Inventory – version II (BDI-II):f
version with 21 items, translated and validated to Brazilian Portuguese to evaluate depression. Cronbach α: 0.92.g
Due to practical constraints, a retest was only made with the sample of people with intellectual disabilities.
Independent analyses were made for the two sam-ples and followed the classic psychometric princisam-ples. The distributions were tested by the Shapiro-Wilk and Kolmogorov-Smirnov tests. The results showed exclu-sively non-standard distributions, which resulted in the choice of non-parametric tests. Conidence intervals
c Organização Mundial da Saúde. Classificação Internacional de Funcionalidade, Incapacidade e Saúde - CIF. 2003. Original publicado em 2001. d Cummins RA. Comprehensive Quality of Life Scale – Intellectual/Cognitive Disability. 5.ed. (Com Qol-I5). Melbourne: Deakin University
School of Psychology; 1997.
e Hutz CS, Giacomoni CH. Adaptação da Escala de Satisfação de Diener para o Brasil. Porto Alegre: UFRGS, 1998. Manuscrito. f Beck AT, Steer RA, Brown GK. Manual for the Beck Depression Inventory-II. San Antonio, TX: Psychological Corporation; 1996. g Gorenstein C, Pang WY, Argimon IL, Werlang BSG. Manual do Inventário de Depressão de Beck – BDI II: adaptação brasileira. São Paulo:
586 Brazilian version of QOCS Bredemeier J et al
were stipulated at 95%. Absent data was illed in by the median of nearby points, which calculates the median of the points distributed above and below the results of the participant in the tabulation of the data.1 Factorial
analyses were made with the analysis of main compo-nents and varimax rotation with Kaiser normalization.
The hypotheses for evidence of criterion validity (in this case, discriminant) were tested by the Mann-Whitney test for the variables: depression, satisfaction with life, disability, health status, disability status, age, income, and – in the case of the group with physical disability – schooling. The analysis of criterion validity seeks to predict the performance of a certain group of individu-als. In the discriminant validity criterion, an evaluation is made regarding the degree to which the developing instrument correlates signiicantly with the variables that theoretically should correlate with it – and vice-versa.12
The reliability (analysis that refers to how close the score generated by the new instrument is to its real score in this construct)12 was calculated by the Cronbach α for
scales and subscales (in both samples) and by means of a test-retest (only for those with intellectual disa-bilities). In this case, the calculation was made by the intraclass correlation coeficient (ICC, average mea -sures, two-way-random) and Wilcoxon test for paired samples from averages of the domains. The Statistical Package for Social Sciences (SPSS) for Windows™ version 18.0 was used.
The project was approved by the Ethics Committee of the
Hospital de Clínicas de Porto Alegre (HCPA – Process
06-020). The informed consent form emphasized the possibility of withdrawing from the study at any time. The signature of the term by one of the parents or guar-dian was requested for the participation of persons with intellectual disabilities. Candidates who were excluded from the study, in the case of people with intellectual disabilities, were not notiied of the reason (failure in the screening tests). An action protocol was developed for the cases of moderate to severe depression and for the cases with either answer 2 or 3 for suicidal ideation (question 9 of the BDI-II). The protocol ranged from notifying the participant of the need for a depression evaluation to the notiication of the medical staff in cases of conirmed suicidal ideation. The research was con -ducted within the standards determined by the Helsinki Declaration,h ensuring anonymity and conidentiality.
RESULTS
A total of 162 people with physical disabilities (98 females, 60.5%) and 156 people with intellectual disabilities (55 females, 35.2%) from the metropoli-tan region of Porto Alegre participated in the study
in 2008. The average age was 45.5 years for physical disabilities (12.3 SD) and 30.5 years for intellec-tual disabilities (9.4 SD). The group of people with physical disabilities comprised a variety of health conditions; the most common were visual impair-ments (15.4%), auditory impairimpair-ments (6.8%), and sequelae from a cerebral vascular accident (2.5%). The rates of absent data for the groups remained at 0.1% for people with physical disabilities and 0.7% for people with intellectual disabilities. Two subjects were responsible for 58.0% of absent data in the second group. The absent data was equally distributed in the group with physical disabilities and there was no occurrence of more than one data absence for the same question. The highest rate of data absence (1.9%) was observed in item 9 (“I achieve more because of my disability”) for people with intellectual disabilities.
The internal consistency analyses showed satisfactory Cronbach α2 for the global scales (0.866 and 0.74 for
the physical and intellectual disability versions, respecti-vely) and for most of the subscales, in this case varying from 0.741 (Information factor) to 0.847 (Meeting Needs factor) for the physical disability version, and from 0.604 (Access to Health Care factor) to 0.708 (Meeting Needs factor) for the intellectual disability version. The inclusion of two local items in the inter-nal consistency ainter-nalyses made no practical alterations in the results of the Cronbach α, resulting in 0.876 for the physical disability version and 0.75 for the intel-lectual disability version.
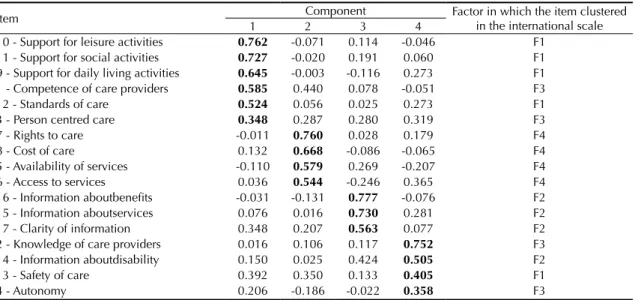
The analysis of the main components of the sam-ple of peosam-ple with physical disabilities resulted in a four-factor model, as in the transcultural study, with the maintenance of the same distribution of items in the factors and same sequence of importance of the factors (Table 1). Two local items formed a dual group in a ifth factor. The analysis of main factors resul -ted in a six-factor model in the sample of people with intellectual disabilities, with a grouping of four of the items from F1 (from the original transcultural distri-bution) in a irst factor (Table 2). Forcing an analysis of the four-factor model, a irst factor was comprised, almost exclusively, of items from the original F1 was obtained. F4 items were grouped into a second fac-tor. The items from F2 and F3 were mingled in the last two factors (Table 3). The local items numbered 18 and 19, when included in the exploratory analysis, were grouped in the factors 5 and 6, respectively, and in the factors 3 and 4 during a second analysis based on the quantity of factors obtained from the transcul-tural analyses of the WHOQOL Group.5
h World Medical Association. Declaration of Helsinki: ethical principles for medical research involving human subjects: updated version –
587 Rev Saúde Pública 2014;48(4):583-593
Table 2. Factorial analysis: group of people with intellectual disability. Porto Alegre, RS, Southern Brazil, 2012. (N = 156)
Item
Component Factor in which the item clustered in the
international scale
1 2 3 4 5 6
10 - Support for leisure activities 0.796 0.016 0.014 0.132 -0.092 0.143 F1 11 - Support for social activities 0.695 0.271 -0.046 0.128 -0.039 -0.001 F1 9 - Support for activities of daily living 0.668 0.159 -0.080 -0.132 0.260 -0.043 F1 12 - Standards of care 0.564 0.073 0.076 0.047 0.245 0.182 F1 1 - Competence of care providers 0.515 0.357 0.356 -0.033 -0.058 -0.224 F3 13 - Safety of care 0.235 0.690 0.145 -0.059 0.237 -0.098 F1 17 - Clarity of information 0.173 0.623 0.157 0.381 -0.175 0.099 F2 3 - Person centred care 0.204 0.579 0.199 0.127 0.111 0.139 F3 14 - Information abou disability 0.095 0.488 -0.143 0.327 0.383 -0.050 F2 7 - Rights to care -0.091 0.304 0.725 -0.052 0.177 0.070 F4 8 - Cost of care 0.043 0.204 0.696 -0.161 -0.078 0.090 F4 5 - Availability of services 0.052 -0.318 0.668 0.396 0.106 -0.191 F4 16 - Information aboutbenefits 0.007 0.056 -0.083 0.794 -0.096 -0.009 F2 15 - Information aboutservices 0.108 0.226 -0.009 0.726 0.239 0.046 F2 2 - Knowledge of care providers 0.080 0.163 0.011 0.151 0.749 0.184 F3 6 - Access to services 0.125 0.003 0.423 -0.207 0.581 -0.219 F4 4 - Autonomy 0.149 0.037 0.023 0.003 0.063 0.917 F3 KMO: 0.707. Barlett test: p < 0.001. Variance explained: 61.7%.
Extraction: Principal components method. Rotation: Varimax with Kaiser normalization. Eigenvalues > 1.0. F1: Meeting Needs; F2: Information; F3: Staff Quality; F4: Accessibility of care.
The values in bold are those that showed the highest value.
Table 1. Exploratory factorial analysis: group of people with physical disability. Porto Alegre, RS, Southern Brazil, 2012. (N = 160)
Item Component item clustered in the Factor in which the international scale
1 2 3 4
10 - Support for leisure activities 0.824 0.072 0.241 0.048 F1 12 - Standards of care 0.773 0.228 0.211 0.200 F1 11 - Support for social activities 0.745 0.034 0.307 -0.038 F1 9 - Support for activities of daily living 0.717 0.263 -0.036 -0.078 F1 13 - Safety of care 0.578 0.258 0.335 0.239 F1 1 - Competence of care providers 0.053 0.769 0.056 0.075 F2 3 - Person centred care 0.186 0.743 0.204 0.196 F2 2 - Knowledge of care providers 0.147 0.738 0.060 0.148 F2 4 - Autonomy 0.183 0.709 0.120 0.055 F2 15 - Information aboutservices 0.227 0.119 0.780 0.056 F3 16 - Information aboutbenefits 0.138 0.094 0.771 -0.065 F3 17 - Clarity of information 0.217 0.081 0.698 0.310 F3 14 - Information about disability 0.138 0.177 0.536 0.304 F3 8 - Cost of care 0.310 -0.057 0.127 0.708 F4 7 - Rights tocare 0.048 0.389 0.019 0.701 F4 6 - Access to services -0.259 0.160 0.143 0.669 F4 5 - Availability of services 0.143 0.487 0.199 0.493 F4 KMO: 0.836. Barlett test: p < 0.001. Variance explained: 61.407%.
Extraction: Principal components method. Rotation: Varimax with Kaiser normalization. Eigenvalues > 1.0. F1: Meeting Needs; F2: Information; F3: Staff Quality; F4: Accessibility of care.
588 Brazilian version of QOCS Bredemeier J et al
The analyses to verify the discriminant validity of QOCS-D in the group of people with physical disa-bilities showed no significant difference between groups stratified by the need for medical treat-ment. The year of study, health and disability sta-tus showed a slightly significant difference only in F2 (for physical disabilities, corresponding to the Information factor). Moreover, age also showed a slightly significant difference in the groups, but only in F3 (for physical disabilities, corresponding to the Staff Quality factor) (Table 4). The analyses for discriminant validity in the group of people with intellectual disabilities showed no significant diffe-rences between the groups created by the variables of age, need of medical treatment, and health sta-tus. There was a slightly significant difference in F4 (Accessibility of Care) in the stratification of groups by the variable disability status (Table 5).
From the 96 participants with intellectual disabilities who participated in retest, 27 were excluded due to the occurrence of an important situation (positive or negative) in their lives in the testing interval period. This data was obtained by the question: “Was there any important fact or change in your life in the last month? (For example: Did you separate from your partner? Have you become ill? Has any family mem-ber or person close to you died? Did you lose your job? Did you get married?) (yes/no)”. The average interval period between test and retest was 28 days (13.58 SD). Significant differences were found in the analysis with ICC for all the four factors (p > 0.05). Simultaneously, no significant differences were found
in the Wilcoxon test for paired samples. Both these pieces of information reinforce the hypothesis of evidence of test-retest reliability.
DISCUSSION
The result of analyzing the main components of the group with physical disabilities replicated the original model shown as a solution to the international data of the project. This is an important result, considering that the initial objective was to develop a valid instrument for use in the Brazilian Portuguese language that would also be transcultural. Nevertheless, the groupings sho-wed differences in relation to the transcultural model in the sample of people with intellectual disabilities. The presence of the “Accessibility of Care” factor, in second place in the four-factor forced model, may point to the social questions related to the dificulty of acces-sing health care in Brazil.
The maintenance of F1 (“Meeting Needs”) in almost all items in all the models tested points to a defini-tion of QC from the perspective of people with disa-bilities. This definition is wider than those linked exclusively to the quality of health care. This is clear when observing the content of items in this factor: support for leisure activities, for social activities, and daily life activities, and health service standards – this last one more obviously linked to quality. The attitudes of health professionals influence the perception of QC and may be easily worked with behavioral intervention strategies.16
Table 3. Forced exploratory factorial analysis into four factors: group of people with intellectual disability. Porto Alegre, RS, Southern Brazil, 2012. (N = 156)
Item 1 2Component3 4 Factor in which the item clustered in the international scale 10 - Support for leisure activities 0.762 -0.071 0.114 -0.046 F1
11 - Support for social activities 0.727 -0.020 0.191 0.060 F1 9 - Support for daily living activities 0.645 -0.003 -0.116 0.273 F1 1 - Competence of care providers 0.585 0.440 0.078 -0.051 F3 12 - Standards of care 0.524 0.056 0.025 0.273 F1 3 - Person centred care 0.348 0.287 0.280 0.319 F3 7 - Rights to care -0.011 0.760 0.028 0.179 F4 8 - Cost of care 0.132 0.668 -0.086 -0.065 F4 5 - Availability of services -0.110 0.579 0.269 -0.207 F4 6 - Access to services 0.036 0.544 -0.246 0.365 F4 16 - Information aboutbenefits -0.031 -0.131 0.777 -0.076 F2 15 - Information aboutservices 0.076 0.016 0.730 0.281 F2 17 - Clarity of information 0.348 0.207 0.563 0.077 F2 2 - Knowledge of care providers 0.016 0.106 0.117 0.752 F3 14 - Information aboutdisability 0.150 0.025 0.424 0.505 F2 13 - Safety of care 0.392 0.350 0.133 0.405 F1 4 - Autonomy 0.206 -0.186 -0.022 0.358 F3 KMO: 0.707. Barlett test: p < 0.001. Variance explained: 49.626%.
Extraction: Principal components method. Rotation: Varimax with Kaiser normalization. F1: Meeting Needs; F2: Information; F3: Staff Quality; F4: Accessibility of care.
589
Rev Saúde Pública 2014;48(4):583-593
Table 4. Discriminant validity of QOCS for people with physical disability. Porto Alegre, RS, Southern Brazil, 2012.
Factor (a)
Income To what extent do you feel that (physical) pain prevents you from doing what you need to do? (WHOQOL-Bref, question 3)
Well below or Slightly below average
(n = 68)
Average, Slightly above or Well
above average (n = 91) df = 157
Not at all, A little or A moderate amount
(n = 102)
Very much or An extreme amount
(n = 57) df = 157
Mean SD Median Min Max Mean SD Median Min Max Z r Mean SD Median Min Max Mean SD Median Min Max Z d
F1 15.47 5.63 16.5 5 25 19.09 4.73 20 5 25 -4.23b -0.34 18.42 5.23 19 5 25 15.96 5.45 17 5 25 -2.86a -0.23
F2 12.6 4.06 12.5 4 20 14.56 3.76 15 4 20 -3.07a -0.24 14.53 3.75 15 4 20 12.28 4.06 12 4 20 -3.52b -0.28
F3 15.53 3.53 16 7 20 16.48 3.07 17 8 20 -1.61 -0.13 15.87 3.58 16.5 7 20 16.35 2.75 16 10 20 -0.46 -0.04
F4 12.32 3.63 12 6 20 14.27 3.9 15 6 20 -3.1a -0.25 13.5 4.18 13 6 20 13.32 3.35 14 7 19 -0.25 -0.02
Factor (a)
Thinking about your care over the last six months, did you have any unmet needs?
(QOCS, Objective module, question 20.1) Depression (BDI-II) (b)
Yes (n = 44) No (n = 96) df = 138 ≤ 11 (n = 79) ≥ 12 (n = 79) df = 156
Mean SD Median Min Max Mean SD Median Min Max Z r Mean SD Median Min Max Mean SD Median Min Max Z r
F1 15.59 5.97 16.5 5 25 18.31 5.01 19 6 25 -2.6a -0.22 19.84 4.36 20 5 25 15.38 5.52 16 5 25 -5.36b -0.43
F2 12.36 4.22 12 4 20 14.04 3.81 14.75 4 20 -2.3a -0.19 14.96 3.81 16 4 20 12.47 3.84 12 4 20 -4.12b -0.33
F3 14.84 3.39 15.5 7 20 16.63 3.18 17 8 20 -2.85a -0.24 16.8 2.97 17 8 20 15.34 3.46 15 7 20 -2.7a -0.21
F4 11.4 3.28 11 7 18 14.41 3.8 15 6 20 -4.25b -0.36 14.73 3.85 15 6 20 12.22 3.56 12 6 20 -4.04b -0.32
Satisfaction with life (SWLS) (b) Functionality (WHODAS-II) (b)
Factor (a) ≤ 23 (n = 80) ≥ 24 (n = 80) df = 158 ≤ 25 (n = 76) ≥ 26 (n = 80) df = 154
Mean SD Median Min Max Mean SD Median Min Max Z r Mean SD Median Min Max Mean SD Median Min Max Z r
F1 16.23 5.73 17 5 25 18.9 4.75 19.5 5 25 -3.2b -0.25 19.03 4.67 19.5 6 25 16.48 5.74 18 5 25 -2.72a -0.22
F2 12.98 3.95 13 4 20 14.45 3.91 15 4 20 -2.46a -0.19 14.78 3.48 15.5 6 20 12.82 4.24 13 4 20 -2.9a -0.23
F3 15.68 3.39 16 7 20 16.44 3.17 17 8 20 -1.44 -0.11 16.01 3.48 17 7 20 16.16 3.15 16 8 20 -0.1 -0.01
F4 12.98 3.64 13 6 20 13.93 4.09 14 6 20 -1.54 -0.12 13.96 3.98 14 6 20 12.94 3.81 13 6 20 -1.61 -0.13
WHOQOL-Bref: World Health Organization Quality of Life-Brief Instrument; BDI-II: Beck Depression Inventory –II; SWLS: Satisfaction With Life Scale; WHODAS-II: World Health Organization Disability Assessment Schedule-II; F1: Meeting Needs; F2: Staff Quality; F3: Information; F4: Accessibility to care.
(a) Factors in accordance with those found in the transcultural project (global sample). (b) Stratified by quantiles.
590
Br
azilian v
ersion of QOCS
Bredemeier J et al
Table 5. Discriminant validity of QOCS for people with intellectual disability. Porto Alegre, RS, Southern Brazil, 2012.
Factor (a)
Income To what extent do you feel that (physical) pain prevents you from doing what you need to do?(WHOQOL-Bref, question 3)
Well below or Slightly below average (n = 60)
Average, Slightly above or Well
above average (n = 91) df = 149 Not at all (n = 93) Moderately and Totally (n = 59) df = 150
Average SD Median Min Max Average SD Median Min Max Z r Average SD Median Min Max Average SD Median Min Max Z r
F1 12.45 2.08 13 6 15 12.79 2.57 14 5 15 -1.52 -0.12 12.83 2.38 13 5 15 12.31 2.44 13 5 15 -1.5 -0.12
F2 8.22 2.03 8 4 12 9.56 2.17 10 4 12 -3.85b -0.31 9.01 2.23 9 4 12 9.08 2.15 9 5 12 -0.06 0.00
F3 10.28 1.57 10.5 6 12 10.46 1.53 11 7 12 -0.79 -0.06 10.48 1.54 11 7 12 10.21 1.64 10 6 12 -1.04 -0.08
F4 8.37 2.11 8 4 12 8.63 2.46 9 4 12 -0.75 -0.06 9 2.37 9 4 12 7.56 1.88 8 4 12 -3.92b -0.32
Factor (a)
Thinking about your care over the last six months, did you have any unmet needs?
(QOCS, Objective module, question 20.1) Depression (BDI-II) (b)
Yes (n = 25) No (n = 104) df = 127 ≤ 5 (n = 70) ≥ 6 (n = 82) df = 150
Mean SD Median Min Max Mean SD Median Min Max Z R Mean SD Median Min Max Mean SD Median Min Max Z r
F1 11.28 2.26 11 6 15 12.77 2.49 14 5 15 -2.96a -0.26 13.23 1.96 14 9 15 12.12 2.62 12.5 5 15 -2.59a -0.21
F2 8.36 2.1 8 4 12 9.47 2.11 10 4 12 -2.41a -0.21 8.95 2.23 9 4 12 9.1 2.21 9.5 4 12 -0.42 -0.03
F3 9.28 1.72 9 7 12 10.5 1.52 11 6 12 -3.21 b -0.28 10.69 1.42 11 7 12 10.07 1.63 10 6 12 -2.38a -0.19
F4 7.08 2.12 8 4 11 8.7 2.43 9 4 12 -2.86a -0.25 8.87 2.33 9 4 12 8.07 2.25 8 4 12 -2.21a -0.18
Factor (a)
Satisfaction with life (SWLS) (b) Disability (WHODAS-II) (b)
≤ 30 (n = 72) ≥ 31 (n = 82) df = 152 ≤ 18 (n = 82) ≥ 19 (n = 73) df = 153
Mean SD Median Min Max Mean SD Median Min Max z R Mean SD Median Min Max Mean SD Median Min Max Z r
F1 12.04 2.37 12 6 15 13.21 2.3 14.5 5 15 -3.43b -0.28 13.34 2.15 14.25 5 15 11.88 2.43 12 6 15 -4.04b -0.32
F2 8.47 2.18 8 4 12 9.53 2.14 10 4 12 -3.03a -0.24 9.23 2.34 10 4 12 8.82 2.04 9 4 12 -1.29 -0.10
F3 9.92 1.69 10 6 12 10.77 1.34 11 7 12 -3.19b -0.26 10.82 1.34 11 7 12 9.86 1.64 10 6 12 -3.77b -0.30
F4 8.17 2.28 8 4 12 8.76 2.34 9 4 12 -1.54 -0.12 8.99 2.26 9 4 12 7.88 2.27 8 4 12 -3.11a -0.25
WHOQOL-Bref: World Health Organization Quality of Life-Brief Instrument; BDI-II: Beck Depression Inventory–II; SWLS: Satisfaction With Life Scale; WHODAS-II: World Health Organization Disability Assessment Schedule-II; F1: Meeting Needs; F2: Information; F3: Staff Quality; F4: Accessibility to care
(a) Factors in accordance with those found in the transcultural project (global sample). (b) Stratified by quantiles.
591 Rev Saúde Pública 2014;48(4):583-593
The resulting factorial model for people with physical disabilities reinforces the maintenance of the transcul-tural model. More studies are needed with larger sam-ples before refuting the transcultural model for people with intellectual disabilities that can be proposed. The local questions did not explain the model as a whole and should be treated as experimental and independent from other factors in new investigations.
The analysis between groups pointed to the existence of evidence of discriminant validity in the two irst QOCS-D factors (F1, “Meeting Needs” and F2, “Staff Quality”) for the variables of income, physical pain, satisfaction with life, disability, need for health care not met, and depression. Elements such as the technical competence of the health services and its professionals and human proximity in the rendering of these services had been valued before by the people with disabilities as important for the quality of the health care team.6
There was evidence of discriminant validity in two other factors (F3, “Information”, and F4, “Accessibility of Care”) on the variables need for treatment not met and depression. This may indicate the need for control of depression and pain in the QC evaluations that can act as confusing variables for the evaluation of quality. There was evidence of discriminant validity between the groups as to the income for F4, pointing to the per-ception of more dificulty in the access to health from the perspective of people with physical disability and less income in this study.
In QOCS-ID version, evidence of discriminant vali-dity was observed for all the factors only in the need for treatment not met variable. This, added to what was observed in QOCS-D in relation to this variable, sug-gests the construct validity of the instrument, especially when considering the groups stratiied by the variable as criterion groups. Factor F1 (“Meeting Needs”) sho-wed signiicant differences for the group with intel -lectual disabilities based on depression, satisfaction with life, and disability. F2 (“Information”) generated a highly signiicant difference and a signiicant diffe-rence for income and satisfaction with life, respecti-vely. F3 (“Staff Quality”), for depression, satisfaction with life, and disability, and the differences were highly signiicant in the last two. F4 (“Accessibility of Care”)
generated signiicant differences in the variables phy -sical pain, depression, and disability, and the differen-ces were highly signiicant in the last. This suggests a mediating role of the perception of disability in the QC evaluation that should be better investigated in future studies. The fact that variables such as income, physi-cal pain, satisfaction with life, disability, need for treat-ment not met, and depression did not show signiicantly different scores between the groups in a QC evaluation instrument does not necessarily indicate a failure of the instrument; it may rather indicate the unimportance of these variables in the determination of the outcome.
The analysis of the test-retest reliability, evaluated in people with intellectual disabilities, has shown a highly signiicant level of ICC for F2 (“Information”) and a signiicant level for other factors. At the same time, the Wilcoxon test did not point to the occurrence of signi-icant differences between the interval measurements. This conirms the hypothesis of the test-retest reliability of the instrument and reinforces the idea of competence of people with light to moderate intellectual disability to self-report their perception of the abstract constructs – discussion currently present in the literature.13
The models of factors found in the international samples of the DISQOL project showed a similar performance when applied to the samples reported here, especially the physical one. Additional studies are necessary to gather evidence as to the validities of QOCS-D and QOCS-ID instruments. The authors suggest that these analyses be made with control for depression, pain, satisfaction with life, and disability – variables that seem to have a mediating role in the QC evaluation.
592 Brazilian version of QOCS Bredemeier J et al
1. Çokluk Ö, Kayri M. The effects of methods of imputation for missing values on the validity and reliability of scales. Educ Sci Theory Pract.
2011;11(1):303-9.
2. Cortina JM. What is coefficient alpha? An examination of theory and applications. J Appl Psychol.
1993;78(1):98-104. DOI:10.1037/0021-9010.78.1.98 3. Dalton AJ, McVilly KR. Ethics guidelines for
international multicenter research involving people with intellectual disabilities. J Policy Pract Intellect Disabil. 2004;1(2):57-70. DOI:10.1111/j.1741-1130.2004.04010.x 4. Diener E, Emmons RA, Larsen RJ, Griffin S.
The satisfaction with life scale. J Pers Assess.
1985;49(1);71-5. DOI:10.1207/s15327752jpa4901_13 5. Eser E, Green A, Hao Y, Kullman L, Lucas-Carrasco R,
McPherson KM, et al. The Quality of Care and Support (QOCS) for people with disability scale: development and psychometric properties. Res Dev Disabil. 2011;32(3):1212-25. DOI:10.1016/j.ridd.2010.12.030 6. Fadyl JK, Kayes NM, McPherson KM. Perspectives
on quality of care for people who experience disability. BMJ Qual Saf. 2011;20(1):87-95. DOI:10.1136/bmjqs.2010.042812
7. Fang J, Fleck MPA, Green A, McVilly K, Hao Y, Tan W, et. al. The response scale for the intellectual disability module of the WHOQOL: 5-point or 3-point? J Intellect Disabil Res. 2011;55(6):537-49. DOI:10.1111/j.1365-2788.2011.01401.x
8. Lawthers AG, Pransky GS, Peterson LE, Himmelstein JH. Rethinking quality in the context of persons with disability. Int J Qual Health Care. 2003;15(4):287-99. DOI:10.1093/intqhc/mzg048
9. Machado JP, Martins ACM, Martins MS. Avaliação da qualidade do cuidado hospitalar do Brasil: uma revisão sistemática. Cad Saude Publica. 2013;29(6):1063-82. DOI:10.1590/S0102-311X2013000600004
10. Mattevi BS, Bredemeier J, Fam C, Fleck MP. Quality of care, quality of life, and attitudes toward disabilities: perspectives from a qualitative focus group study in Porto Alegre, Brazil. Rev
Panam Salud Publica. 2012;31(3):188-96.
DOI:10.1590/S1020-49892012000300002 11. O’Donnell O. Access to health care in developing
countries: breaking down demand side barriers.
Cad Saude Publica. 2007;23(12):2820-34.
DOI:10.1590/S0102-311X2007001200003
12. Pasquali L. Psicometria: teoria dos testes na psicologia e na educação. Petrópolis: Vozes; 2003.
13. Power MJ, Green AM; WHOQOL-DIS Group. The attitudes to Disability Scale (ADS): development and psychometric properties. J Intellect Disabil Res. 2010;54(9):860-74. DOI:10.1111/j.1365-2788.2010.01317.x
14. Reis CT, Martins M, Laguardia J. A segurança do paciente como dimensão da qualidade do cuidado de saúde: um olhar sobre a literatura.
Cienc Saude Coletiva. 2013;18(7):2029-36.
DOI:10.1590/S1413-81232013000700018 15. Rolim CLRC, Martins M. Qualidade do cuidado
ao acidente vascular cerebral isquêmico no SUS. Cad Saude Publica. 2011;27(11):2106-16. DOI:10.1590/S0102-311X2011001100004 16. Satchidanand N, Gunukula SK, Lam WY,
McGuigan D, New I, Symons AB, et al. Attitudes of healthcare students and professionals toward patients with physical disability: a systematic review. Am J Phys Med Rehabil. 2012;91(6):533-45. DOI:10.1097/PHM.0b013e3182555ea4
17. World Health Organization. WHODAS-II Disability Assessment Schedule: training manual: a guide to administration. Geneva; 2000.
18. World Health Organization. Quality of care: a process for making strategic choices in health systems. Geneva; 2006. 19. World Health Organization. World report on disability.
Malta; 2011.
REFERENCES
Article based on the doctoral thesis by Bredemeier J, titled: “Qualidade de vida, qualidade de cuidado e atitudes frente a incapacidades em pessoas com incapacidades físicas e intelectuais”, presented to the Programa de Pós-Graduação em Ciências
Médicas (Medical Sciences Post-graduation Program): Psychiatry, from the Universidade Federal do Rio Grande do Sul, in 2013.
This study was supported by the Conselho Nacional de Desenvolvimento Científico e Tecnológico (CNPq, Edital Universal CNPq, Process 473071/2006-1), by the Coordenação de Aperfeiçoamento de Pessoal de Nível Superior (CAPES, Scholarship PDEE Process 2305-09-7), and by the Fundo de Incentivo à Pesquisa (FIPE) from the Hospital de Clínicas, Porto Alegre (GPPG 06-016, 06-020, and 06-021).
593 Rev Saúde Pública 2014;48(4):583-593
ANNEX
Items from QCOS for people with physical and intellectual disabilities. Porto Alegre, RS, Southern Brazil, 2008. Items
1 Are the people who provide your care (the professional staff) good at their jobs?
2 Do the people who provide your care know enough about your condition or disability? For example, do they know enough about the problems or difficulties you experience?
3 Do the people who provide your care meet your needs?
4 Do the people who provide your care involve you in decisions about your health and/or social care?
5 Do you have to wait a long time to see the people who provide your care? For example, does it take long to get appointments with doctors, psychologists, nurses, physiotherapists, social workers etc?
6 Do you have to do a lot of paperwork to get the services you need? For example, do you have to fill in lots of forms?
7 Do you have to fight for the care and support you need?
8 Does a lack of services where you live limit the care and support you get? For example, if there is a lack of facilities, staff, or money for medicines or other treatments.
9 Does a lack of services where you live limit the care and support you get? For example, if there is a lack of facilities, staff, or money for medicines or other treatments.
10 Can you get help to take part in leisure activities?For example, things you like to do for fun, your hobbies and interests.
11 Can you get help to take part in social activities? For example, meeting friends or going out for a meal.
12 Do you get enough care and support? For example, do you have enough people looking after you to meet your needs?
13 Do you feel safe about the care you get? For example, do you feel secure and protected, that you will not have an accident or get hurt, that you will not suffer abuse etc?
14 Have you been given enough information about your disability? For example, has someone talked to you about your disability or health problems?
15 Do you know about the services and support you can get to help you? For example, treatments, therapies, medicines, support associations, aids and equipment.
16 Do you know about the money and other benefits you can get to help you? For example, a pension, free transport, day services.
17 Are you given information in a way that you can understand easily? For example, do people tell you things in a way you can understand and explain things clearly to you; is any written material easy to understand?
Local Items
18 Is it easy to get appointments with health care professionals? For example, doctors, psychologists.
ERRATUM
In the article: “Quality of Care Scale in Brazilian Portuguese: the perspective of people with disabilities” publicado no periodico “Revista de Saúde Pública”, volume 48(4) de 2014, em Annex, Item 9.
Where it reads:
“Does a lack of services where you live limit the care and support you get? For example, if there is a lack of
facilities, staff, or money for medicines or other treatments.”
It should read: