ISSN: 1809-4430 (on-line) www.engenhariaagricola.org.br
2
São Paulo State University - UNESP/ Jaboticabal - SP, Brasil. Received in: 6-7-2017
Accepted in: 2-5-2018
Doi:http://dx.doi.org/10.1590/ 1809-4430-Eng.Agric.v38n2p 244-250/ 2018
MULTIVARIATE ANALYSIS OF PEANUT MECHANIZED HARVESTING
Rafael H. F. Noronha
1*, Cristiano Ze rbato
2, Rouverson P. da Silva
2, Antonio T. S. Ormond
2,
Mailson F. de Oliveira
21*
Corresponding author. São Paulo State University - UNESP/ Jaboticabal - SP, Brasil. E-mail: rafael.noronha.agro@gmail.com
KEYWORDS
soil textural classes,
Arachis hypogaea L.,
principal components
analysis.
ABSTRACT
The peanuts harvesting mechanization is affected by the soil physical characteristics and it
may increase the losses due to the production of pods in subsurface. The objective of the
experiment was to identify the clusters through multivariate exploratory approaches from
similarity in six soil textures (very clayey, clayey, silty clayey loam, clayey loam, sandy
loam and sandy) in the state of São Paulo, Brazil, determining the main agronomic
variables that most influenced the clustering division to assist the decision-making process
in peanuts mechanized harvesting. The data were analyzed by the multivariate exploratory
that is performed to simplify the description of a set of interrelated variables, using: yield,
maturity, soil and pod moisture content, windrow width and height, visible and invisible
digging losses, and gathering losses, as agronomic indicators of quality. The low and high
clay content were grouped into clusters I and III, respectively, according to the agronomic
traits of the peanut crop. The principal components analysis (PC) allowed a single
distribution of accesses since only two eigenvalues
were higher than “one”: the highest
eigenvalues of 4.51 and 1.79, resulted in a Biplot that explained 70% of the original
variability, 50.11% and 19.89% of which in the PC1 and PC2, respectively. The
multivariate analysis indicated that high peanut yields in soils with low clay are correlated
with the losses during the peanut mechanized harvesting operation.
INTRODUCTION
Peanuts (Arachis hypogaea L.) are an important oilseed in the Bra zilian ma rket, but even more in the state of São Paulo. The state produced 98% of the 418,300 tons of peanuts produced in the 2016/2017 harvest in Bra zil, and peanuts are currently used as a rotational crop in sugarcane area and even pastures (CONAB, 2018).
The peanut production process is a critical time which it seeks mechanized operational e xcellence via new technologies to overcome the challenges and seize the opportunities of foreign ma rkets in a sustainable way by increasing production volume, productivity and reducing production costs (Grotta et al., 2008) because in this operation losses are inevitable (Barbosa et al., 2014).
Most of the losses in the peanut harvest occurs in the digging operation and can reach high levels when the operation is not carefully managed; the values range fro m 3.1 to 47.1% of pod losses in relation to yield (Santos et al., 2013; Zerbato et al., 2014).
Monitoring the losses allows detecting and correcting the errors that might occur during the process so
they can be min imized thus avoiding yield dropping (Be rtonha et al., 2014; Câ ma ra et al., 2007).
Multivariate analysis can be defined as e xploratory statistical method that analyzes simu ltaneously multiple measure ments in the experimental unit. The random variables must be interrelated so their effects cannot be mean ingfully interpreted separately. The Clustering Analysis (CA) uses the Ward method (hierarchica l) for e xtract statistical properties of a dataset, clustering similar vectors into classes (Hair, 2005).
The Principal Co mponent Analysis (PCA) is performed to simplify the description of a set of interre lated variables. The created orthogonal axes are linear co mbinations of the original variab les, starting with the eigenvalues of the covariance and/or correlation matrix of the studied variables in which the two largest eigenvalues generate the first two principal components, e xpla in more variability than any other components (Hair et al., 2005).
Rafael H. F. Noronha, Cristiano Zerbato, Rouverson P. da Silva, et al.
agricultural and forestry machineries ( Guerrieri et a l., 2017). The studies about the impact of mechanization through soil tillage on the behavior of weeds were effic ient based on the similarity (CA) of the weeds (Boscardin et al., 2016; Nagahama et al., 2014).
Azevedo et al. (2015) and Silva & Lima (2012) investigated, respectively, the selection of lettuce cultivars and the nutritional status and productivity of coffee plants, and showed the efficiency of mult ivariate analysis, because the effects of multip le variables (random and interre lated) could not be interpreted separately.
Multivariate e xplo ratory analysis is used in sectors of the agricultural production due to the high comple xity of the produced informat ion. La mp kowski & Biaggioni (2013) and Paredes Junior et al. (2015) reported that it is used to better interpret, understand, manage and assist the decision-ma king process in the sugar-energy sector.
It is assumed that the peanut mechanized harvesting needs tools to assist in the effective control of loss variability and to understand the behavior of the agronomic t raits in re lation to soil te xtura l c lasses for mu ltip le tra its.
This study aimed at identifying the clusters through mu ltivariate e xploratory approaches from similar soil textures and determining the variab les that most influenced the clustering division to assist the decision-making process in mechanized agricultura l operations.
MATERIAL AND MET HODS
The experiment was conducted in six fa rms in Ribeirão Preto region, SP (Table 1). The 120-ha assessed area was planted with peanut of the Runner IAC 886 variety, sown in October 2015 with 0.90-m spaced rows. The crop was harvested in all evaluated areas in February 2016, 130 days after sowing. The farms were located
between 20º58’ and 21º10’S and 47º51’ and 48º13’W, at
593 m average alt itude. The soil in the areas presented between 7.0 and 66.8% c lay (Tab le 1).
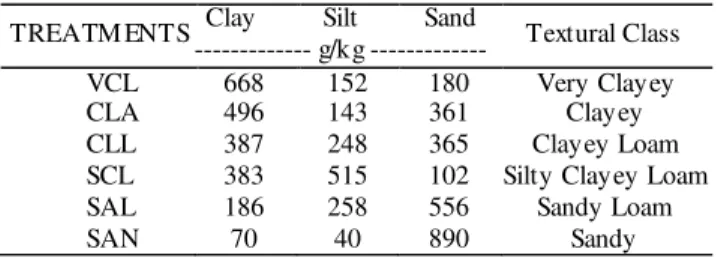
TABLE 1. Part icle size analysis and soil te xtural c lasses.
TREATM ENTS Clay Silt Sand Textural Class --- g/kg ---
VCL 668 152 180 Very Clayey
CLA 496 143 361 Clayey
CLL 387 248 365 Clayey Loam
SCL 383 515 102 Silty Clayey Loam
SAL 186 258 556 Sandy Loam
SAN 70 40 890 Sandy
The digging was performed by a 680 HD Massey Ferguson tractor with ma ximu m engine power of 127 kW (173 hp) at 2000 rp m coupled with an EIA-2 Santal digger-shaker-inverter, 2 x 1 (t wo harvested/digging rows, formed a windrow). However, the tractor worked at 1,500 rpm to meet the digger-shaker-inverter manufacturer’s recommendation of 340 rp m in the PTO. Although the conditions were unsuitable fro m the mechanical vie wpoint, this rotation was used because they represented the real conditions of the equipment in the field, since it has no reduction mechanisms able to provide the indicated rotation.
The mechanized harvesting of peanuts was evaluated for six te xtural soil c lasses as follows very clayey (VCL), clayey (CLA ), silty clayey loa m (SCL),
clayey loam (CLL), sandy loam (SA L), and sandy (SAN) with 10 repetit ions per soil te xtura l c lasses, totaling 60 plots in a randomized design, each plot formed a regular grid of 25 x 50 m.
The evaluated variables were yield, maturity, soil and pods moisture content, height and width of the windrow after digging, digg ing crop losses (visible and invisible losses), and gathering operation. The windrow formed after the passage of the digger was carefully re moved to determine the visible and invisible digging losses. For this purpose, a metal fra me o f appro ximately 2 m2 (1.11 x 1.80m) was placed across the windrow and the materia l was manually collected up to 0.25 m deep.
The fra me width corresponded to the working width of the digger-shaker-inverter. After collecting, the pods were placed in paper bags, tagged, and sent to the laboratory where the samples were washed to remove the dirt fro m the e xocarp. After that, the pods were weighed on a digital scale with 0.01 g precision and oven dried at 105 ± 3°C fo r 24 hours. After drying, they were weighed again to determine the losses, which were e xtrapolated to kg ha-1 with fu rther adjustment to 8% moisture. The losses were ca lculated in kg ha-1 and expressed as percentage.
The previously described fra me of appro ximately 2 m2 was placed on the windrows at all sampling points to determine yield. All pods within the frame area were collected, and yield was calculated based on 8% moisture, the standard value for peanut storage in the processing companies. Subsequently, gross crop yield was calculated by adding total digging losses (sum of invisible and visible digging losses).
Pod mo isture content (calculated on wet basis) was obtained following the oven method for samples collected after the digger-shaker-inverter passage, with subsequent correction for 8% water content value used for peanut storage in hulling (Mart ins & Lago, 2008). Soil moisture was determined is samples collected by a Dutch auger in the 0.0 to 0.2 m layer. The soil samples were placed in alu minu m containers, sent to the laboratory, and oven dried at 105°C for 24 hours. Soil mo isture was obtained on a dry basis, according to the methodology recommended by EMBRAPA (2006). The 0.0 to 0.2 m layer was defined as the soil-sa mpling layer to determine the moisture content because this region concentrates most of the peanut pods. One soil sample was collected per plot, totaling 60 samp les.
Maturity (Hull scrape method) was determined by scraping the exocarp of 100 rando m pods for each sampling point, e xposing the color of the mesocarp. The pods were classified by color, according to the Peanut Maturity Table, developed by the University of Georgia in the United States (Willia ms & Dre xle r, 1981).
The windro w width and height were measured using a graded ruler to indicate the quality of windrow reversal since they can affect the drying and gathering mechanized process .
The data were standardized (null mean and unit variance) prio r to the conduction of the multivariate analysis and the variables did not present collinearity . Exp loratory statistics of the data was performed using the Statistica software to analyze the hierarchical c lusters, calculating the Euclidean distance between accesses by the Ward algorithm to obtain simila r accesses, which was then graphically represented by a dendrogram (c lustering the
accesses) and the k-means (minimizing access variance within each c luster).
The Discriminant Analysis (DA) is the oldest of the three classificat ion methods. It was originally developed for mult ivariate norma l distributed data. The data as a whole should not be normally distributed but within each class the data should be normally distributed. This means that if you could plot the data, each class would form an ellipsoid, but the means would diffe r. The Mahalanobis distance between x and the center c i of class i is the S-weighted distance where S is the estimated variance-covariance mat rix of the class.
After forming the clusters using the clustering method (Ward), the dendrogram branches were coded for technical application of principal components (Hair et al., 2005), using the same tra its. The objective was to visualize the soil te xture c lass in the two-dimensional plane formed by the principal components and interpret the discriminatory power of the variables in each major component, as:
(1)
where,
: Standard deviation of variable j;
: Coeffic ient of variable j in the h-th ma in
principal co mponent;
: Eigenvalue h;
: Corre lation of the variab le xj to the h
-th principal co mponent.
The eigenvectors (PC1, PC2, ...., PCh) we re
determined from the eigenvalues of the covariance and/or correlation matrix of branch traits in descending order. Thus, PC1 is the component that exp lains mo re variability in the original dataset, while the last component explains less.
The variance in each principal co mponent can be calculated as follo ws :
(2)
where,
: Principa l co mponent h;
: Eigenvalue h;
C : covariance and/or correlat ion matrix;
: λ1+λ2+ ... +λh;
The principa l co mponent analysis was performed based on the diagonalization of a symmetric corre lation matrix after analy zing the population variance to identify new numerical variables that expla ined most of the variability (Ha ir, 2005) by the Kaiser method with eigenvalues higher than “1”.
RES ULTS AND DISCUSS ION
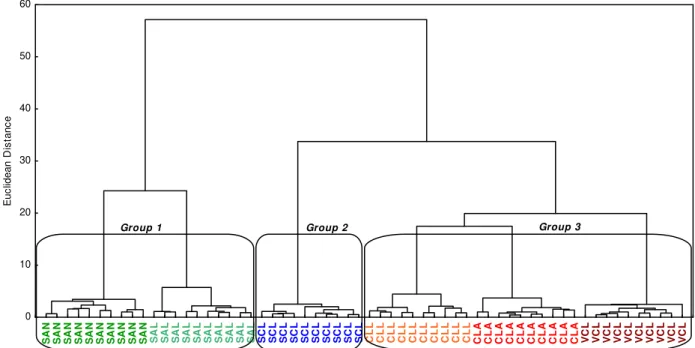
The dendrogram that resulted from the clustering analysis is presented in Figure 1. The results corroborated with Lacerda et al. (2016) which in the evaluation on the discrimination of soil texture, the authors considered the similar soil te xtural groups to differentiat ion of the soil manage ments and production potential.
S A N S A N S A N S A N S A N S A N S A N S A N S A N S A N S A L S A L S A L S A L S A L S A L S A L S A L S A L S A L S C L S C L S C L S C L S C L S C L S C L S C L S C L S C L C L L C L L C L L C L L C L L C L L C L L C L L C L L C L L C L A C L A C L A C L A C L A C L A C L A C L A C L A C L A V C L V C L V C L V C L V C L V C L V C L V C L V C L V C L 0 10 20 30 40 50 60 E u c li de an D is tan c e
Group 1 Group 2 Group 3
Rafael H. F. Noronha, Cristiano Zerbato, Rouverson P. da Silva, et al.
The processes were divided into 3 groups: I, II, and III and the clustering analysis by the discriminants analysis method (Figure 2) and the non-significant variables were e xcluded (IDL and VDL). The Classification and Discriminant Function Analysis Summary are presented for seven variables for three groups (Table 2 and 3). The Classification Matrix of groups (G1: 33.8%, G2: 16.7% and G3:50.0%) are represented for Observed classifications versus Predicted classifications (Table 4). Both characterized by the I and III opposing soil classes with lo w and high clay content, respectively, where higher
yield was achieved but more advanced maturity stage caused majo r losses in peanut mechanized digging operation due to increased peduncle fragility. In addition, the mechanized gathering (GA L) beca me more d ifficu lt due to lower windrow height, and lower soil and pod mo isture content, corroborating Santos et al. (2013) and Zerbato et al. (2014) that reported pod moisture contents of 35 to 45% at d igging time . The GA L is a variable that most influenced the discriminant division to assist the decision-ma king process in mechanized agricultural operations.
TABLE 2. Classificat ion and Discriminant Function Analysis Summa ry for seven variables for three groups
Vari ables Classification Discriminant Func tion Anal ysis
G3 G1 G2 Wilks Lambda Parti al F-re move Toler. GAL -21.14 43.27 -23.11 0.009002 0.31 55.68 0.88
MAT 3.59 -1.19 -8.40 0.006780 0.42 35.64 0.73
SMC 7.02 -11.83 2.58 0.004489 0.63 14.98 0.32
YLD -3.02 7.92 -6.78 0.003444 0.82 5.56 0.82
HEW 4.98 -6.69 -1.56 0.003956 0.71 10.17 0.41
WCP 0.94 -5.27 7.72 0.003439 0.82 5.51 0.85
WIW -1.47 0.74 2.92 0.003408 0.83 5.23 0.68
Constant -12.50 -46.70 -30.00
Wilks' Lambda: .00283 approx. F (14.102) =129.73 p<0.0000. Yie ld (YLD), maturity (MAT), windro w width (WIW) and height (HEW), soil (SMC) and pod (PMC) moisture content, visible and (VDL) and invisible (IDL) digging losses, and gathering losses (GA L).
TABLE 3. Square Mahalanobis distances (upper half table) between the centroids of the group distributions (G1, G2 and G3) o f the soil textura l c lasses and respective F-values (lower half table).
G1 G2 G3
G1 251.98 201.62
G2 214.72 48.08
G3 309.26 46.09
Tables 4 shows the results for the three groups used in the model with agronomic variab les to observed and predicted classification. The consideration concerns the percentage of well c lassified with the DA. In fact, all the soils of the estimation groups are well-classified (100%). Thus, there is not a situation of over-fitt ing: the analysis works well for the base model (Table 2 and 3), considering it is appropriate for predict ions (Lucadamo & Leone, 2015) which using all the e xplicative and response variables, the DA works perfectly for the basic soil textura l c lasses as the percentage of we ll classified, denoting better classification rates for the new model.
TABLE 4. Classificat ion Matrix of groups (G1, G2 and G3) with Observed classifications (Rows) and Predicted classifications (Co lu mns)
Observed Classifications
Predicted classificat ions Percent Correct G1 G2 G3
G1 20 100
G2 10 100
G3 30 100
Percent 33.8 16.7 50.00
-15 -10 -5 0 5
Root 1 -4
-3 -2 -1 0 1 2 3 4 5 6 7
R
oot
2
GROUP 1 GROUP 2 GROUP 3
FIGURE 2. Standardized coeffic ients for agronomic traits of peanut crop and s oil texture for each group, according to the discriminants analysis. Yie ld (YLD), maturity (MAT), windro w width (WIW) and height (HEW), soil (SM C) and pod (PM C) mo isture content, visible and (VDL) and invisible (IDL) d igging losses, and gathering losses (GA L).
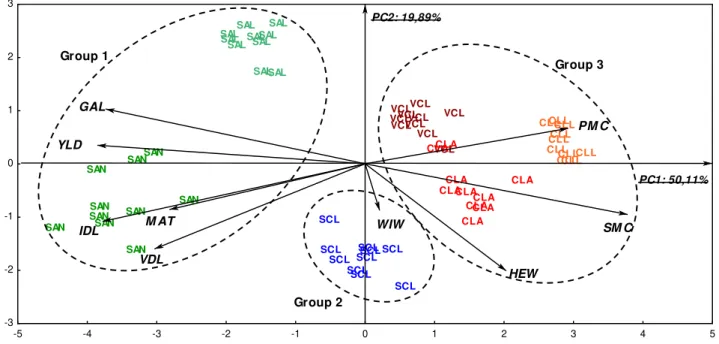
The principal component analysis allowed a single distribution of accesses (PC1 and PC2), since only two eigenvalues were greater than “one”, 4.51 and 1.79, respectively. The two largest principal co mponents together enabled a two-dimensional ordering of accesses and variables, producing a Biplot graph (Figure 3). The distribution of soil te xtures and agronomic tra its for the peanut crop showed that these components expla ined 70% of the variability, 50.11% and 19.89% of wh ich in PC1 and PC2, respectively.
VCL VCL
VCL
VCLVCL
VCL VCL VCL VCL
VCL
CLA CLA
CLA CLA
CLA CLA CLA
CLA
CLA CLA
SAL SAL
SALSAL SALSALSAL
SAL SAL SAL
CLL CLL
CLL CLL CLLCLL
CLLCLL CLL CLL
SCL SCL
SCL SCL SCL
SCL SCL
SCL SCL SCL
SAN
SAN SAN
SAN SAN
SAN
SAN SAN SAN
SAN
-5 -4 -3 -2 -1 0 1 2 3 4 5
-3 -2 -1 0 1 2 3
PC1: 50,11% PC2: 19,89%
WIW SM C
PM C YLD
GAL
IDL M AT
VDL
HEW
Group 1
Group 2
Group 3
FIGURE 3. Distribution of soil te xtures according to the principal co mponents 1 and 2 and their vectors with the agronomic traits for the mechanized harvesting of peanuts. Yie ld (YLD), maturity (MAT), windrow width (WIW) and height (HEW), soil (SM C) and pod (PM C) moisture content, visible and (VDL) and invisible (IDL) digging losses, and gathering losses (GA L). Very c layey (VCL), c layey (CLA), clayey loa m (CLL), silty c layey loa m (SCL), sandy loam (SA L), and sandy (SAN).
The biplot graph (Figure 3) shows the distribution of soil classes in the peanut areas on the plan formed by the first two principal co mponents (PC1 and PC2) and coded according to the clusters determined in the dendrogram. The x-a xis (PC1) shows the contrasts of the six soil classes, three textural classes (VCL, CLA, and CLL) to the right and two (SAN and SAL) to the left, and the centralized intermed iate behavior (SCL). The y-a xis (PC2) shows a high direct correlation between the visible losses and windrow height, expla ined by the adjustment of align ment rolls and inverters of branches together with the plant mass being processed directly interfe ring with the windrow dimensions in the digging process (Zerbato et al., 2017).
Table 5 shows the variables with higher discriminatory power in the first principal co mponent that had direct correlations between YLD, MAT, VDL, IDL, and GAL, enabling an efficient multivariate approach to mechanized harvesting of peanuts. Likewise, Silva et al. (2010) and Santos et al. (2016) successfully used the agronomic tra its of great economic importance in the agricultural production system.
TABLE 5. Corre lation between peanut production variables and the principal co mponents 1 and 2 for the diffe rent soil classes.
PC1 PC2
YLD -0.88 0.14
MAT -0.64 -0.33 WIW 0.04 -0.33 HEW 0.47 -0.79
SMC 0.66 0.27
PMC 0.86 -0.36 VDL -0.69 -0.61
IDL -0.86 -0.42 GA L -0.85 0.41
Principal co mponent 1 (PC1); principa l co mponent 2 (PC2); Yield (YLD); maturity (MAT); windrow width (WIW) and height (HEW); soil (SM C) and pod (PMC) mo isture content; visible (VDL) and invisible (IDL) digging losses; and gathering losses (GAL).
The values of the correlations (Table 5) between the peanut harvest variables and the first two principal components according to soil te xtual class, PC1 has a high discriminatory power for the following peanut harvest variables: YLD 0.88), MAT 0.64), VDL 0.69), IDL (-0.86), and GA L (-0.85). The negative associations of the variables presented their respective projections in the agglomerat ion directions of SAN and SA L soil te xtural classes (Figure 3). Then, the positive associations of SMC (0.66) and WPC (0.86) corre lated with VCL, CLA and CLL soil te xtura l classes. Thus, the peanuts digging operation could represent the PC1. It is noteworthy that the high impact of losses on the gathering of pods directly affected the final yield of the peanut crop (Ferezin et al., 2015).
Yie ld is the variable corre lated to maturity that can directly influence peanut mechanized harvesting, in addition to the moisture content of the pods. The dry peduncles, with lower mo isture content, breaking easily, cause higher losses in the gathering operation (Zerbato et al., 2014).
The PC2 showed a high discriminatory power for the HEW and VDL variab les (Figure 3) with respective negative associations of -0.79 and -0.61 (Tab le 5). The windrow height influenced the gathering process since losses were higher for lowe r windrow heights because the gathering operation (PC2 representation) becomes more difficult c loser to the ground.
Rafael H. F. Noronha, Cristiano Zerbato, Rouverson P. da Silva, et al.
CONCLUS IONS
The hierarchica l and non-hierarchical clustering analysis allowed ordering the accesses into three clusters, discriminant analysis and the principal component analysis indicating that high peanut yields in soils with low c lay are correlated with losses in the mechanized harvesting operation.
Multivariate analysis procedures effectively summarized the losses and yield informat ion and made easier to determine the GA L that most influenced the discriminant division to assist the decision-ma king process in mechanized agricu ltural operations.
ACKNOWLEDGMENTS
The authors are thankful to CAPES (Coordenação de Aperfeiçoa mento de Pessoal de Nível Superior) and CNPq (Conselho Nacional de Desenvolvimento Científico e Tecnológico) for financing this research.
REFERENCES
Azevedo AM, Andrade Júnior VC, Ped rosa CE, Olive ira CM, Dornas MFS, Va ladares NR (2015) Agrupamento mu ltivariado de curvas na seleção de cultivares de alface quanto à conservação pós -colheita. Horticultura Brasile ira 33(3):362-367. DOI: http://d x.doi.o rg/10.1590/S0102-053620150000300014
Barbosa RM, Ho me m BFM, Tarsitano MAA (2014) Custo de produção e lucratividade da cultura do amendoim no munic ípio de Jaboticabal, São Paulo. Rev ista Ceres 61(4):475-481. DOI: http://d x.doi.o rg/10.1590/ 0034-737X201461040005
Bertonha RS, Silva RP, Furlani CEA, Nascimento JM, Cavichio li FA (2014) Perdas e teor de água das vagens no arranquio mecanizado de a mendoim. Ene rgia na
Agricultura 29(1):167-173. DOI:
http://dx.doi.org/10.17224/ EnergAgric .2014v 29n 3p167-173
Boscardin J, Costa EC, Ga rlet J, Machado JM, Machado DN, Pedron L, Bolzan LC (2016) Efe itos de diferentes tipos de controle de plantas infestantes sobre a
Mirmecofauna e m Eucalyptus grandis. Ciência Florestal 26(1):21-34. DOI:
http://dx.doi.org/10.5902/1980509821062
Câ ma ra FT, Silva RP, Lopes A, Furlan i CEA, Grotta DCC, Re is GN (2007) Influência da área de a mostragem na determinação de perdas totais na colheita de soja. Ciência e Agrotecnologia 31(3):909-913. DOI: http://dx.doi.org/10.1590/S1413-70542007000300044
CONA B - Co mpanhia Nac ional de Abastecimento (2018) Acompanhamento da safra brasile ira de grãos 2017/18. CONA B 5(1):1-132.
EM BRAPA - Empresa Brasile ira de Pesquisa
Agropecuária (2006) Sistema b rasile iro de c lassificação de solos. Emb rapa, 306 p.
Fere zin E, Vo ltare lli MA, Silva RP, Zerbato C, Cassia MT (2015) Po wer ta ke-off rotation and operation quality of peanut mechanized digging. African Journal of Agricultural Research 10:2486-2493, 2015. DOI: http://dx.doi.org/10.5897/AJAR2013.8032
Grotta DCC, Furlani CEA, Silva RP, Re is GN, Corte z JW, Alves PJ (2008) Influence of sowing depth and the compacting of the ground on the seed in the peanut productivity. Ciênc ia e Agrotecnologia 32(2):547 -552. DOI:
http://dx.doi.org/10.1590/S1413-70542008000200031
Gue rrieri M, Fedrizzi M, Antonucci F, Pallottino F, Sperandio G, Pagano M, Figorilli S, Menesatti P, Costa C (2017) An innovative multivariate tool fo r fue l
consumption and costs estimation of agricultura l operations. Spanish Journal of Agricu ltural Research 14(4):209.
Hair JR, Anderson RE, Tatham RL (2005) Análise mu ltivariada de dados. Porto Alegre, Buckman. 593p.
Lacerda M P, De mattê JA, Sato M V, Fongaro CT, Gallo BC, Souza A B (2016) Tropical Te xture Determination by Pro xima l Sensing Using a Regional Spectral Library and Its Relat ionship with Soil Classification. Re mote Sensing 8(9):701.
La mp kowski FJ, Biaggioni MAM (2013) Análise mu ltivariada das atividades científicas e técnicas no processo de adoção de inovação em e mpresas
sucroenergéticas do centro-oeste do estado de São Paulo. Energ ia na Agricultura 28(4):253-263. DOI:
http://dx.doi.org/10.17224/ EnergAgric .2013v 28n 4p253 -263
Lucada mo A, Leone A (2015) Principa l co mponent mu ltino mial regression and spectrometry to predict soil texture. Journal of Che mo metrics 29(9):514-520.
Martins L, Lago AA (2008) Conservação de semente de Cedre la fissilis: Teor de água da semente e te mperatu ra do amb iente. Rev ista Brasileira de Se mentes 30(1):161-167.
Nagahama HJI Corte z JW, Concenço G, Arau jo VFI, Honorato ACI (2014) Dinâ mica e variabilidade espacial de plantas daninhas em sistemas de mobilização do solo em sorgo forrageiro. Planta Dan inha32(2):265-274. DOI: http://dx.doi.org/10.1590/S0100-83582014000200003
Paredes Junior FP, Po rtilho IIR, Mercante FM (2015) Atributos microbio lógicos de um latossolo sob cultivo de cana-de-açúcar com e sem queima da palhada. Se mina Ciência Agrária 36(1):151-164. DOI: 10.5433/1679-0359
Santos AF, Kaza ma EH, Ormond ATS, Tavares TO, Silva RP (2016) Quality of mechanized peanut digging in function of the auto guidance. African Journal of Agricultural Research 11(48):4894-4901.
Santos EP, Silva RP, Bertonha RS, Noronha RHF, Zerbato C (2013) Produtividade e perdas de amendoim e m c inco diferentes datas de arranquio. Rev ista Ciênc ia Agronômica 44:695-702. DOI: http://dx.do i.org/10.1590/S1806-66902013000400005
Silva AS, Lima JSS, Xav ier A C, Teixe ira MM (2010) Variabilidade espacial de atributos químicos de um Latossolo Vermelho-A mare lo hú mico cu ltivado com café. Revista Brasile ira de Ciência do Solo 34(1):15-22. DOI: https://dx.doi.org/10.1590/S0100-06832010000100002
Silva AS, Lima, JSS (2012) Avaliação da variabilidade do estado nutricional e produtividade de café por me io da análise de componentes principais e geoestatística.Revista Ceres 59(2):271-277. DOI:
http://dx.doi.org/10.1590/S0034-737X2012000200017
Willia ms EJ, Dre xler JS (1981) A non-destructive method for determining peanut pod maturity. Peanuts Science 8(2):134-141.
Zerbato C, Furlani, CEA , Silva RP, Vo ltarelli MA, Santos AF (2017) Statistical control of processes aplied for peanut mechanica l digging in soil te xtu ral classes. Engenharia Agrícola 37(2):315-322. DOI:
https://dx.doi.org/10.1590/1809-4430-eng.agric.v37n2p315-322/2017