PHONATORY DEVIATION DIAGRAM
IN ORGANIC DYSPHONIA BY NEOPLASIA
Disfonias orgânicas por neoplasias:
análise de diagramas de desvio fonatório
Iára Bittante de Oliveira(1), Eliane dos Santos Fernandez(1), Elaine Pavan Gargantini(1)
(1) Pontifícia Universidade Católica de Campinas – PUC
Cam-pinas, CamCam-pinas, SP, Brasil.
Financial resource: FAPIC Reitoria – Pontifícia Universidade Católica de Campinas
Conlito de interesses: inexistente
sphincter and phonatory functions of larynx, and
may be vertical or horizontal, according to the resection plan3.
Consequently, individuals submitted to partial laryngectomy present changes in the laryngeal physiology producing a different sound signal which could not be compared to an integral laryngeal voice4. Vocal impairment may also interfere in
speech intelligibility5.
For the assessment of quality of voice, two important sources may be used: the perceptual and
the acoustic analysis. The irst one is a subjective
method that varies according to the evaluator, his personal concepts about quality of voice, his skills
of perception, discrimination and his experience. The second analysis is considered objective by
many authors since it uses computer programs that quantify several measurable aspects of the voice signal captured, of great interest in the vocal clinic6,7.
INTRODUCTION
Some inirmities affect the voice, restricting
communication and interaction. Among them,
there is larynx cancer representing around 25% of all malignant head and neck tumors and 2% of
all malignant diseases1. The treatment of larynx
cancer depends on a series of factors such as size and location of the lesion, and may be performed with sophisticated techniques, for instance partial surgeries, endoscopy and precise radiotherapy techniques2. Partial laryngectomy is performed aiming to preserve the maximum of respiratory,
ABSTRACT
Purpose: to compare acoustic data obtained through the phonatory deviation diagram of voices of
dysphonic patients submitted to partial laryngectomy with voices of subjects of the same age range,
however, without vocal complaint. Methods: the voices of 28 subjects were studied, being 14 partial
laryngectomized patients and 14 subjects without vocal complaints, composing a control group. Both
groups of males with same age and education level. The perceptual analysis of voices was conducted by GRBASI scale double-blind and through acoustic analysis software VOXMETRIA®.Results: partial laryngectomees voices 100% were distributed outside the normal quadrant, 64,3% were located in the right upper quadrant, 100% presented horizontal deviation of jitter and shimmer and 85,7% had
a vertical deviation. The control group 28,5% were distributed within the normal quadrant, 71,5% were located in the right lower quadrant, 57,2% presented in the horizontal shimmer and 7,2% in jitter. Only 7,2% had a vertical deviation in the control group. Statistical signiicance was observed
regarding the parameters of jitter, shimmer and GNE (glottal to noise excitation) and between the
distribution of the voices in the upper right and left quadrants of the diagram in the presence of altered voices. Conclusion: the diagram allowed to analyze and discriminate the performance of normal and pathological voice differentiating them through their parameters, distribution, location and type of voice is considered a useful resource for voice analysis.
presence of noise at emission (hoarseness) and breathiness11,18.
This study aims to analyze and compare the
phonatory deviance diagrams of subjects submitted
to partial laryngectomy in which the glottic
archi-tecture was altered with subjects of same age and sex without vocal complaints.
METHODS
This prospective observational study was approved by the Research with Human Being Ethics Committee of PUC-Campinas, protocol number 0621/11.
Voices of 28 subjects were studied: 14 comprising
the partial laryngectomy group, and 14 without vocal
complaints of same sex, age and educational level,
comprising the control group. The partial
laryn-gectomy group included male subjects from 46 to
71 years of age (mean age of 61 years) referred by
the Head and Neck service of a School-Hospital in
Campinas city, to the same hospital’s Speech and Language service.
All subjects underwent partial laryngectomy
affecting glottal level; those submitted to horizontal
partial laryngectomy were excluded. The mean
post-operatory time was nine months. By the time
of the study, subjects were being discharged from
speech therapy for better vocal conditions, and presented compensation of dysphagia and closed tracheostoma.
The control group was also comprised of 14
male subjects from 46 to 72 years of age (mean age
of 62 years), same educational level and no vocal complaints.
The softwareVOXMETRIA® was used to obtain
vocal samples, using a headset microphone
PLANTRONICS, placed 5 cm far from the subject’s
mouth, directly adapted to a notebook Sony PCG – 61111X, in an acoustically controlled environment room.
All voices were submitted to two types of analysis: perceptual assessment in which sample consisted in counting from 1 to 20 and naming months of the year; and acoustic analysis of vowel /a/ sustained during a three seconds time, disregarding the beginning and the end of the emissions in order to uniformize the samples that were normalized by the Sound Forge program.
Voice samples were presented for perceptual
analysis without identiication; three of them were As well as videolaryngoscopy exams, that
show the structural normality of vocal chords, the perceptual analysis together with the acoustic
analysis contribute signiicantly for the obtaining of
data related to normal patterns of voice8,9.
Measures obtained with the acoustic analysis should allow a coherent interpretation of numeric values10. The most frequently used parameters are: fundamental frequency (F0); jitter – varying
pitch in the voice; shimmer; glottal noise measures; spectrographic data; phonatory deviation diagram, among others11,12.
Within the components of the acoustic analysis, there is the Phonatory Deviation Diagram (PDD), originally called by German researchers as
Goettingen Hoarseness Diagram- GHD. The
bi-dimensional graph was proposed as a quanti-tative assessment method of the periodicity and of the noise of the sound signal, with its own acoustic characteristics. Afterwards, the interest and the clinical applicability of the hoarseness diagram motivated the development of a Brazilian program
called Voxmetria (CTS Informatics), which allows the extraction of acoustic measures and offers
the distribution of vocal samples in the phonatory deviation diagram. The program allows a graphic illustration of the quality of voice and can be easily interpreted. The diagram is based in four acoustic measures: three of them related to irregularity of the
sound signal – jitter, shimmer and their correlation;
the fourth one is related to the noise component,
named glottal to noise excitation ratio – GNE13-15.
The differential of this diagram is that it is able to assess very deviant voices, besides showing differ-ences between dysphonic groups with different phonatory mechanisms and it allows monitoring of vocal quality10,13-17.
The GNE is the acoustic measure that calculates
the noise produced by the oscillation of vocal chords. Its values are considered normal when higher or
equal to 0,5dB. The GNE shows signiicant differ -ences between pathological, aphonic and normal voices10. The fundamental frequency (F
0) is the
number of times a waveform reproduces itself in a unit of time. The F0 is affected by age and sex, with a mean distribution from 80 to 250 Hz in young adults.
In man, it is expected a range from 80 to 150 Hz and in women, from 150 to 250 Hz. The jitter, distur
-bance index of F0 in short time, shows the variability
of the fundamental frequency measured between
successive glottal cycles. It expresses how different
the normality area, considering that most altered voices are out of this area. Both groups were compared. This procedure was performed according to Madazio (2009)14.
Results were statistically analyzed. The
following tests were applied: Fisher Exact test, Binomial Proportion test, Wilcoxon Mann Whitney
Median test, and Student t test for identifying
possible signiicance in the comparison between the
distribution and location of voices in the phonatory deviation diagram of both groups and its
correla-tions with the perceptual analysis. The signiicance level was 5% (p<0,05).
RESULTS
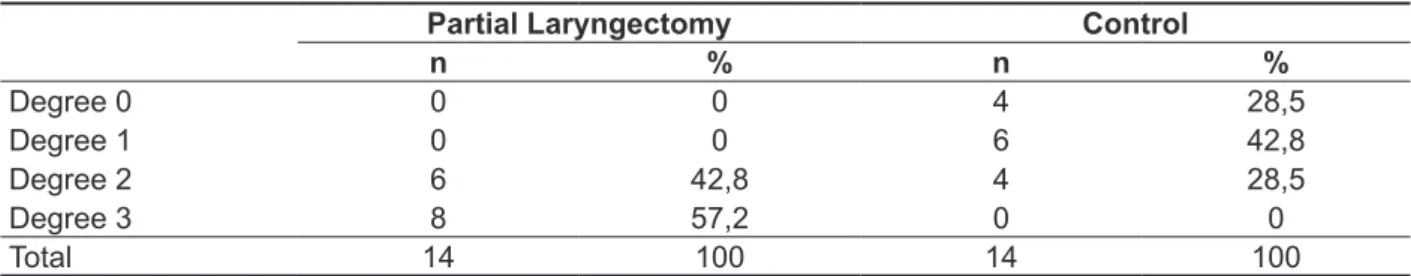
The perceptual analysis using the GRBASI
scale showed that eight subjects from the partial laryngectomy group (57,2%) presented degree 3 of deviance (intense) and six (42,8%) presented degree 2, or moderate deviance. None of the subjects submitted to partial laryngectomy were classiied with adapted or mild degree of deviance. In the control group, four voice samples (28,5%) were classiied with degree 2 of vocal deviance (moderate), six (42,8%) with degree 1 (mild) and four (28,5%) with degree 0 (adapted voice). The
statistical analysis revealed that the vocal alteration
degree of subjects from the partial laryngectomy group is signiicant in comparison with the control
group, as presented in Table 1. for mild deviance, two for moderate deviance and
three for intense degree of voice alteration.
For the categorization of vocal qualities according to the GRBASI scale, a training of two fourth grade speech language science students with more than
one year experience in oncology speech language therapy and a voice specialist therapist, experienced
in perceptual analysis of functional and organic dysphonic voices due to neoplasms was performed.
After the training, a consistency test was
conducted and judges presented a number of correct responses superior than 80%; thus, the
analyses of voices were performed. Considering the multi-dimensional characteristic of voice, criteria for
acoustic categorization of voice types were deined
as: rough – when the acoustic impression was of phonatory irregularity; breathy – when soundless air was present throughout emission; tense- when effort to phonation was observed; and irregular- when voice was produced with noise, instability of glottal source and little use of resonance.
The analysis of voice samples in the phonatory deviation diagram was conducted in two ways: the
irst one established by the program and related to
the distribution in the PDD (within normality range or not); the second one according to the location in the diagram divided in four equal quadrants, and the
classiication of the horizontal (jitter and shimmer) and the vertical axis (GNE) deviations.
Vocal samples were studied and classiied
according to their location in the diagram regarding
Table 1 – Classiication of the global degree of vocal deviance of subjects submitted to partial laryngectomy and subjects without vocal complaint according to the perceptual analysis
Partial Laryngectomy Control
n % n %
Degree 0 0 0 4 28,5
Degree 1 0 0 6 42,8
Degree 2 6 42,8 4 28,5
Degree 3 8 57,2 0 0
Total 14 100 14 100
left (4 subjects- 28,5%) quadrants of the diagram.
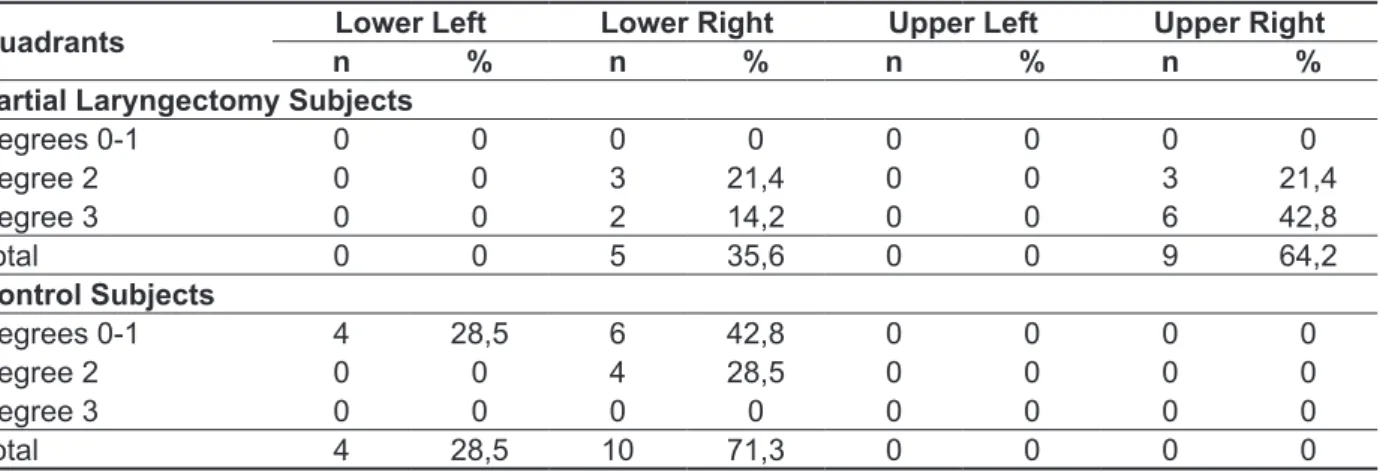
The Binomial proportion test revealed statistical
signiicance in the relation between the perceptual
analysis and the location of voices in quadrants of both groups when the GGD resulted in altered voices of degrees 2 and 3 and the upper right and lower right quadrants (altered voices), as showed in Table 2.
The perceptual analysis of both groups evidenced that the most altered voices were
classiied with intense degree of deviance (nine subjects – 64,2%), mostly located in the upper right
quadrant of the diagram. The group without vocal complaints presented mild to moderate deviances, and vocal samples were divided between the
lower right (10 subjects – 71,4%) and the lower
Table 2 – Comparison of the global degree of vocal deviance (grbasi) with the location of voices in the phonatory deviance diagram quadrants of subjects submitted to partial laryngectomy and the group without vocal complaint
Quadrants Lower Left Lower Right Upper Left Upper Right
n % n % n % n %
Partial Laryngectomy Subjects
Degrees 0-1 0 0 0 0 0 0 0 0
Degree 2 0 0 3 21,4 0 0 3 21,4 Degree 3 0 0 2 14,2 0 0 6 42,8
Total 0 0 5 35,6 0 0 9 64,2
Control Subjects
Degrees 0-1 4 28,5 6 42,8 0 0 0 0
Degree 2 0 0 4 28,5 0 0 0 0
Degree 3 0 0 0 0 0 0 0 0
Total 4 28,5 10 71,3 0 0 0 0
p value (p-0,144) Binomial Proportion test. Legend: Lower Left Quadrant = adapted voices, Lower Right Quadrant =rough voices, Upper Left Quadrant = moderate degree, Upper Right Quadrant =breathy voices.
According to the distribution of voices in quadrants of the PDD, Table 3 indicates that all
voices of subjects submitted to partial laryngectomy, 14 (100%), were distributed out of the normality
quadrant. Vocal samples of control group were
distributed: four (28,5%) in the lower left quadrant,
and ten (71,5%) out of the normality quadrant, all
of them in the lower right quadrant. The statistical analysis of both groups’ voices regarding their distri-bution in the diagram (in or out of the normality area)
did not point statistical signiicance with the Fisher exact test and the Chi-square test.
Table 3 – Area coniguration and distribution of voices from the partial laryngectomy group and the control group in the phonatory deviation diagram, in and out of the normality quadrants
Areas Partial Laryngectomy Subjects Control Subjects
n % n %
Within Normality 0 0 4 28,5
Out of Normality 14 100 10 71,5
Total 14 100 14 100
were in the lower right and four (28,5%) in the lower
left, the quadrant of normality. There was statistical
signiicance regarding the location of voices in the
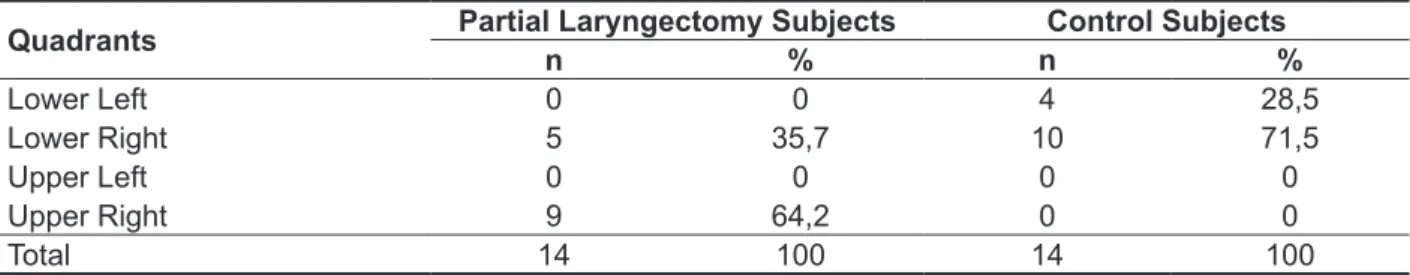
quadrants of both groups when voices were altered. Regarding the location of vocal samples and the
types of voices, Table 4 shows that nine subjects submitted to partial laryngectomy (64,2%) were located in the upper right quadrant and ive (35,7%) in the lower right. In the control group, ten (71,5%)
Table 4- Distribution of voices in the four quadrants of the phonatory deviation diagram
Quadrants Partial Laryngectomy Subjects Control Subjects
n % n %
Lower Left 0 0 4 28,5
Lower Right 5 35,7 10 71,5
Upper Left 0 0 0 0
Upper Right 9 64,2 0 0
Total 14 100 14 100
Binomial Proportion test, p Value lower than 5% (0,0037). Legends: upper right quadrant corresponds to breathy voices, lower right – rough voices, upper left – voices with the worst degree of alteration, and lower left corresponds to normal or adapted voices (Madazio,2009).
Concerning the horizontal axis deviances of jitter
and shimmer, it is possible to observe in Table 5
that 14 (100%) voices of the partial laryngectomy
group presented deviances in both parameters. In
the control group only one subject (6,7%) presented altered jitter, and eight (57,2%) presented altered
shimmer. Comparing the deviances presented in
both groups, the Fisher exact test revealed statistical signiicance in the parameter jitter (p-value <0,001),
as well as in the shimmer, in which the unpaired test
pointed statistical signiicance regarding values of shimmer between the two groups (p-value <0,001).
Table 5 – Horizontal deviances – jitter e shimmer: partial laryngectomy and control subjects Acoustic Parameters
jitter shimmer
n % n %
Partial Laryngectomy Subjects 14 100 14 100
Control Subjects 1 7,2 8 57,2
Total 14 100 22 157,2
Wilcoxon-Mann Witney test, p value- (0, 000000997) for shimmer. Fisher Exact test, p value-(0,00000074) for jitter.
Legend: jitter: 0 to 0,6% = Normal, jitter:> 0,6% =Altered.
shimmer: 0,0 to 6,5%= Normal. shimmer:> 6,5%= Altered (Behlau, 2001; Madazio, 2009)
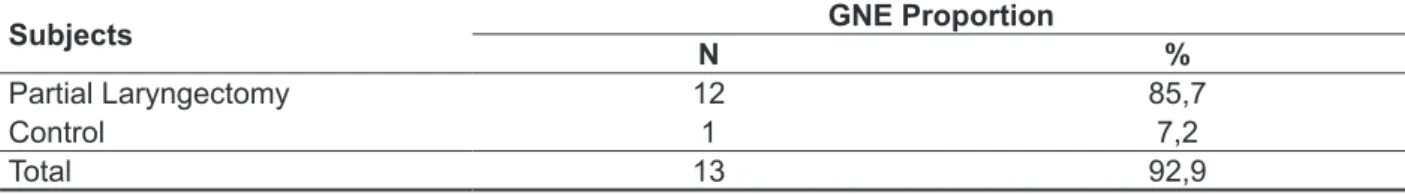
The vertical axis deviances (GNE) presented
in both groups can be seen in Table 6. It can be
observed that 12 subjects from the partial laryn
-gectomy group (85,7%) presented vertical axis
deviances, differing from the control group in which
only one subject (7,2%) presented alteration in
this parameter. Statistical analysis using Fisher
present in the totality of the partial laryngectomy
group and in most of the control group subjects.
Concerning the location of vocal samples of the control group, it was observed that only a small part located within the quadrant compatible to adapted voice, that is, the lower left quadrant of the diagram.
Great part of the control group’s voices (71,5%) were
in the lower right quadrant; such location is charac-teristic of rough voices14. This inding stands out,
especially considering that the control group had as inclusion criterion the absence of vocal complaints;
in its great majority, they were individuals self-
referred as healthy, attending sports club, who were invited to take part in this study.
Alterations found in this group may be relate or associated to presbyphonia, which consists in an age-related voice disorder, resulting from anatomic
and physiological changes of larynx that interfere in
the vocal quality23.
Presbyphonia is a voice aging process in which
the vocal quality is extremely modiied over the
years. It can be easily recognized in the phonation of
an individual after his sixth or seventh decade of life,
being more aggravated depending on the individ-ual’s life style and health background24. Increased
roughness/hoarseness have been associated with the aging voice and may be an intrinsic character-istic of the vocal quality in presbyphonia25,26. Such modiications found in aging voices suggest that,
many times this process is unnoticed once it is
considered normal for the age, justifying the lack of
vocal complaint in the control group.
Vocal samples of the partial laryngectomy group
were located, in its great majority, in the upper right
quadrant, corroborating a study in which post-partial laryngectomy voices obeyed the same location16.
The perceptual analysis when associated to the acoustic analysis revealed that, of the eight
voices (57,2%) of subjects submitted to partial laryngectomy that were classiied as degree 3, six
DISCUSSION
In this article, the acoustic and the perceptual analysis of voices of a group of individuals submitted to partial laryngectomy were compared to a control
group composed by subjects of same age and
without vocal complaints.
It is important to stress that comparisons between results of different programs of vocal acoustic analysis may present differences, even when using similar measures, due to algorithm differences, to fundamental frequency calculation methods, to types of microphones used, to types of storage of recorded voices, and to types of continuous or sustained speech used9. Types of acoustic analysis
differ greatly in its measuring characteristics, thus the perceptual analysis is supreme in the vocal clinic. Therefore, the importance of perceptual analysis in the speech language therapy must be enhanced; the perceptual and technological assessment tools are complementary, and enable access to more accurate evaluations of vocal quality by specialists19.
Voices were analyzed using the phonatory deviation diagram and their distribution and location in the diagram quadrants were studied. It was possible to verify that the totality of vocal samples from the partial laryngectomy group were distributed out of the normality quadrant. Authors point that altered voices are located out of the lower left quadrant, in which are located adapted voices10,13,20-22. The statistical analysis revealed that there was no signiicant difference in the comparison
of the distribution of both groups. Such fact may be
explained by the number of voices of the normality
quadrant in the control group out. Studies showed
that pathological voices occupy speciic regions
in the diagram10 and that more altered voices are
found in the upper right quadrant14,15 corroborating the indings observed in the present study. This
Table 6- GNE proportion – vertical deviance: partial laryngectomy and control subjects
Subjects GNE Proportion
N %
Partial Laryngectomy 12 85,7
Control 1 7,2
Total 13 92,9
Fisher Exact test. p value (p-0,0000687)
the glottic cycle and in the variability of the sound wave amplitude.
Most of the voices in the control group also
presented altered shimmer. Studies afirm that
the shimmer alters especially in glottic resistance situations or presence of mass lesions, and it is correlated to the presence of noise at emission and breathiness11, 14,31,34. Shimmer is frequently
associated to the noise at emission and, thus, tend to be higher in cases of breathiness28. The author afirms that jitter and shimmer values are usually
higher in male voices. Therefore, both groups
presented alteration in this parameter, the irst
one as a result of organic alterations due to partial laryngectomy affecting the glottis, and the second one because of functional disorder compatible with presbyphonia.
In a study in which the acoustic parameters of voice of elderly men were analyzed, the author found that shimmer tends to gradually and linearly decrease and that this acoustic parameter is more sensitive to male vocal age23. Data found in the mentioned study disagree with the majority of liter
-ature that afirms that jitter and shimmer measures tend to change with aging and that it is expected an increase of both jitter and shimmer in men.
Alterations found in this parameter corroborate
previous studies that afirm that shimmer, as well as jitter, increase over the years due to anatomic and
physiological changes during the aging process, increasing signal instability27,33. Considering that
individuals from this study are between 26 and 78 years old, part of the group may present presby-phonia characterizing the alterations found in voices of the group without vocal complaint. Statistically
there was signiicance between the two groups
regarding this parameter (p-0, 000000997).
Concerning the vertical axis deviances, the GNE measure was altered in most of the partial laryngectomy group (85,7%). The GNE proportion
is related to breathiness, which is caused by an
increase of the sonorous airlow35. GNE indicates if the vibration of vocal cords or a turbulent airlow
generated in the vocal tract is originating the vocal signal; thus, the alteration in this parameter is natural in breathy voices14. In the control group, only one subject (6,7%) presented altered GNE. In the
comparison of both groups regarding this parameter,
there was statistical signiicance (p< 0,001).
CONCLUSION
Voices of subjects submitted to partial laryn
-gectomy affecting the glottis present altered jitter, shimmer and GNE. There was a statistically signif -icant relation between the perceptual analysis and quadrant14. Six voices (42,8%) were classiied as
degree 2 and their location distributed: three (21,5%) in the upper right quadrant, and three (21,5%) in the
lower right quadrant. The perceptual analysis of the
control group showed that four (28,5%) of the vocal samples were classiied as degree 2 (moderate), located in the lower right quadrant. Six (42,8%) had
mild degree, four located in the lower right quadrant
(28,5%) and two (14,3%) in the lower left quadrant
(adapted voice).
The Phonatory Deviation Diagram offered a quantitative analysis of vocal samples of both
groups. The jitter measures, that indicate frequency
disturbance in a short time, showed that all voices from the partial laryngectomy group presented alterations. In the control group, this parameter
was present in a minority of subjects. Jitter values
below 0,6 are considered normal and the average of this parameter in the partial laryngectomy group was 11,41, revealing a high value and corroborating a study that reports that in normal individuals the
jitter value is small; nevertheless, in the presence
of vocal cords lesions there is a higher aperiodicity
and jitter values are more elevated26. Some authors afirm that this measure’s values are higher in cases
of vocal cords disorders, such as what happens in individuals submitted to partial laryngectomy of this study23,27,28 and is correlated to roughness14,29-32. The
statistical analysis of this parameter by the Fisher
exact test indicated signiicance regarding the horizontal axis deviance in the comparison of both
groups (p-0,00000074).
There was alteration in shimmer values in both groups. Shimmer is related to amplitude variations of the sound wave in a short time and represents irregular alterations in the glottal cycle amplitude from one cycle to another11,18. Normal values of
shimmer are below 6,5 according to studies that used this measure12,14,20. It was possible to observe
that the average of the partial laryngectomy group was 31,02 while the control group presented average of 8,6, indicating alteration in both groups.
The shimmer alterations found in the partial laryngectomy group are related to the vocal quality
prejudice due to larynx surgery affecting the glottis.
Authors refer that after partial laryngectomy it is
expected that subjects present worsening of speech intelligibility and prejudice of vocal quality4.
Authors of a study also point that the vocal quality is proportional to the vocal cords integrity after a conservative laryngectomy. Thus, the vocal function
is affected by the extension of glottic carcinomas
resection33. The same authors refer that shimmer
alterations are usually related to reduced glottic
of voices of the control group out of the normality quadrant. The control group, even without vocal complaint, with good health and mean age of 62 years presented deviances in the PDD, which may be associated to the natural process of vocal aging, an alert of presbyphonia in this age group.
the location of the voices in the phonatory deviation diagram, out of the normality area and in the upper right quadrant.
There was no signiicant difference in the
comparison of the distribution of voices in both
groups. Such fact may be explained by the number
RESUMO
Objetivo: comparar dados acústicos obtidos por meio de diagrama de desvio fonatório de vozes de
pacientes disfônicos submetidos a laringectomias parciais com vozes de sujeitos de mesma faixa etária, porém sem queixa vocal. Métodos: foram estudadas as vozes de 28 sujeitos sendo 14 sujeitos
laringectomizados parciais e 14 sujeitos sem queixa vocal, compondo um grupo controle. Ambos os grupos do sexo masculino com mesma faixa etária e nível de escolaridade. Resultados: as vozes
dos laringectomizados parciais 100% distribuíram-se fora do quadrante de normalidade, sendo que 64,3% se localizaram no quadrante superior direito, 100% apresentaram desvios horizontais e 85,7%
tiveram desvio vertical de ruído. Do grupo controle 28,5% distribuíram-se dentro do quadrante de nor
-malidade, 71,5% localizaram-se no quadrante inferior direito, 57,2% apresentaram desvio horizontal
de irregularidade – em shimmer e 7,2% em jitter. Apenas 7,2% apresentou desvio vertical de ruído no
grupo controle. Houve signiicância estatística em relação aos parâmetros de jitter, shimmer e GNE
(glottal to noise excitation) e entre a distribuição das vozes nos quadrantes direito superior e inferior do diagrama, na presença de vozes alteradas. Conclusão: o diagrama permitiu analisar e discriminar vozes alteradas daquelas com disfonia após laringectomia parcial diferenciando-as por meio de seus
parâmetros, distribuição, localização e tipo de voz sendo considerado um recurso útil para análise
vocal.
DESCRITORES: Disfonia; Neoplasias; Acústica da Fala; Voz, Percepção auditiva
REFERENCES
1. Pinto JA, Wambier H, Sonego TB, Batista FC, Kohler R, Reis RP. Lesões pré-malignas da laringe:
revisão de literatura. Rev. Bras. Cir. Cabeça Pescoço. 2012;41(1):42-7.
2. Paula FC, Gama, RR. Avaliação de qualidade de vida em laringectomizadosTotais. Rev. Bras. Cir.
Cabeça Pescoço. 2009;38(3):177-82.
3. Fouquet ML, Vieira TPG, Murata CJM, Gonçalves,
AJ. Efeito imediato da técnica de irmeza glótica nas
laringectomias parciais horizontais supracricoides: estudo inicial. Rev. Soc Bras Fonoaudiol. 2012;17(3):346-50.
4. Nicola V, Fiorella, ML, Spinelli DA, Fiorella, R. Acoustic analysis of voice in patients treated by reconstructive subtotal laryngectomy. Evaluation
patients undergoing total and partial laryngectomy. Clinics. 2005;60(2):135-42.
6. Pontes PAL, Vieira VP, Goncalves MIR, Pontes AAL. Características das vozes roucas, ásperas
e normais: análise acústica espectrográica
comparativa. Rev. Bras. Otorrinolaringol. 2002;68(2):182-8.
7. Maryn Y, Roy N, Bodt MD, Cauwenberge PV, Corthals, P. Acoustic measurement of overall
voice quality: A meta-analysis. J. Acoust. Soc. Am.
2009;126(5):2619-34.
8. Araujo SA, Grellet M, Pereira JC, Rosa, MO.
Normatização de medidas acústicas da voz normal.
Rev. Bras. Otorrinolaringol.2002; 68(4): 540-4. 9. González J, Cervera T, Miralles, JL. Análisis
Acústico de la voz: iabilidad de un conjunto
de parámetros multidimensionales. Acta Otorrinolaringol Esp. 2002; 53:256-68.
22. Nunes AMB. Voz e emoção em português
europeu [dissertação]. Belém (PA): Universidade de Aveiro, Secção Autónoma de Ciências da Saúde;
2009.
23. Santos IR. Análise acústica da voz de indivíduos
na terceira idade [dissertação]. São Carlos (SP): Universidade de São Paulo, Bioengenharia; 2005.
24. Meirelles RC, Bak R, Cruz FC. Presbifonia. Rev Hospital Universitário Pedro Ernesto. 2012;11(3):77-82.
25. Gama ACC, Alves CFT, Cerceau JSB, Teixeira
LC. Correlação entre dados perceptivo-auditivos e
qualidade de vida em voz de idosas. Pró-Fono R Atual Cient. 2009;21(2):125-30.
26. Menezes LN, Vicente LCC. Envelhecimento vocal em idosos institucionalizados. Rev CEFAC. 2007;9(1):90-8.
27. Figueiredo DC, Souza PRF, Gonçalves MIR,
Biase NG. Análise perceptivo-auditiva, acústica
computadorizada e laringológica da voz de adultos
jovens fumantes e não-fumantes. Rev Bras.
Otorrinolaringol. 2003;69(6):791-9.
28. Beber BC, Cielo CA. Caracteristicas vocais
acústicas de homens com voz e laringe Normal.
Rev CEFAC. 2011;13(2):340-51.
29. Ortiz KZ, Carrillo L. Comparação entre as análises auditiva e acústica nas disartrias. Rev. Soc. Bras. Fonoaudiol. 2008;13(4):325-31.
30. Bandeira MPA. Análise acústica comparativa das vozes disfônicas e normais do professor
[dissertação]. Universidade do Vale do Paraíba, Programa de pós graduação em Bioengenharia;
2010.
31. Teixeira JP, Ferreira DB, Carneiro SM. Análise
acústica vocal – determinação do jitter e shimmer
para diagnóstico de patologias da fala. In 6º
Congresso Luso-Moçambicano de Engenharia. Maputo, Moçambique, 2011.
32. Pimenta RA, Dajer ME, Montagnoli NA. Uso
das ferramentas de análise acústica para avaliação da voz sob efeitos imediatos de exercícios vocais.
XVIII Congreso Argentino de Bioingeniería. Clínica Mar del Plata, 28 al 30 de septiembre de 2011. 33. Dedivitis RA, Barros APB, Queija DS, Junior
EGP, Bohn NP. Achados perceptivo-auditivos e
acústicos em pacientes submetidos à laringectomia
fronto-lateral. Rev. Bras. Cir. Cabeça Pescoço.
2008;37(3):163 –5.
34. Corazza VR, Silva VFC, Queija DS, Dedivitis
RA, Barros APB. Correlação entre os achados
estroboscópicos, perceptivo-auditivos e acústicos
em adultos sem queixa vocal. Rev. Bras.
Otorrinolaringol. 2004;70(1):30-4.
35. Michaelis D, Gramss T, Strube HW.
Glottal-to-noise excitation ratio – a new measure for describing
pathological voices. Acta Acustica. 1997;83:700-6. Proceedings of the 4th International Workshop.
Jena, 2000. p 63-71.
11. Behlau M, Madazio G, Pontes P. Disfonias Organofuncionais. In Behlau M. Voz: O Livro do
Especialista – Volume I, São Paulo, Revinter, 2001.
p. 297.
12. Felippe ACN, Grillo MHMM, Grechi TH.
Normatização de medidas acústicas para
vozes normais. Rev. Bras. Otorrinolaringol. 2006;72(5):659-64.
13. Fröhlich M, Michaelis D, Strube H.W. Acoustic Voice Analysis by Means of the Hoarseness Diagram.
J Speech Lang Hear Res. 2000;43(3):706-20.
14. Madazio GMV. Diagrama de Desvio Fonatório
Na Clínica Vocal [dissertação]. São Paulo (SP): Universidade Federal de São Paulo, Escola Paulista
de Medicina; 2009.
15. Pifaia LR, Madazio G, Behlau M. Diagrama de desvio fonatório e análise perceptivo-auditiva pré e pós-terapia vocal. CoDAS. 2013;25(2):140-7.
16. Olthoff A, Mrugalla S, Laskawi R, Frölich M, Stuermer I, Kruse E et al. Assessment of irregular voices after total and laser surgical partial
laryngectomy. Arch Otolaryngol Head Neck Surg,
2003;129:994-9.
17. Harnisch W, Brosch S, Schimidt M, Hagen R. Breathing and voice quality after surgical treatment for bilateral vocal cord paralysis. Arch Otolaryngol
Head Neck Surg. 2008;134(3):278-84.
18. Carrasco ER, Oliveira G, Behlau M. Análise Perceptivo-auditiva e Acústica da Voz de Indivíduos Gagos. Rev CEFAC. 2010;12(6):925-35.
19. Kohle JI, Camargo Z, Nemr K. Análise Perceptivo-auditiva da qualidade vocal de indivíduos submetidos à laringectomias parciais verticais pela
auto-avaliação dos indivíduos e pela avaliação
fonoaudiológica. Rev CEFAC. 2004;6(1):67-6. 20. Oliveira AG. A efetividade de um programa de treinamento Vocal para Operadores de
Telemarketing [tese]. São Paulo (SP): Universidade de São Paulo, Faculdade de Medicina; 2005.
21. Mendonça RA, Sampaio TMM, Oliveira, DSF.
Avaliação do Programa de Exercícios Funcionais
Vocais de Stemple e Gerdeman em Professores. Rev CEFAC. 2010;12(3):471-82.
Received on: January 29, 2014 Accepted on: July 30, 2014
Mailing address: Iára Bittante de Oliveira
Av. John Boyd Dunlop – s/n.º – Jd. Ipaussurama
Campinas – SP – Brasil CEP: 13060-904