*Correspondence: C.Luchese. Centro de Ciências Químicas, Farmacêuticas e de Alimentos. Universidade Federal de Pelotas. Campus Capão do Leão, 96010-900 - Pelotas - RS, Brazil. E-mail: [email protected]
A
vol. 51, n. 4, oct./dec., 2015 http://dx.doi.org/10.1590/S1984-82502015000400008
Validation of high performance liquid chromatography method for
determination of meloxicam loaded PEGylated nanocapsules
Francine Rodrigues Ianiski
1, Luciane Varini Laporta
2, Alexandre Machado Rubim
2,
Cristiane Luchese
3,*1Graduate Program in Nanoscience, Franciscan University Center, Santa Maria, RS, Brazil, 2Laboratory of Control of Drug Quality, Franciscan University Center, Santa Maria, RS, Brazil, 3Center for Chemical Sciences, Pharmaceutical and Food,
Federal University of Pelotas, Pelotas, RS, Brazil
A method to ensure that an analytical method will produce reliable and interpretable information about the sample must irst be validated, making sure that the results can be trusted and traced. In this study, we propose to validate an analytical high performance liquid chromatography (HPLC) method for the quantitation of meloxicam loaded PEGylated nanocapsules(M-PEGNC). We performed a validation study, evaluated parameters including speciicity, linearity, quantiication limit, detection limit, accuracy, precision and robustness. PEGylated nanocapsules were prepared by interfacial deposition of preformed polymer, and the particle size, polydispersity index, zeta potential, pH value and encapsulation eiciency were characterized. The proposed HPLC method provides selective, linear results in the range of 1.0-40.0 μg/mL; quantiication and detection limits were 1.78 μg/mL and 0.59 μg/mL, respectively; relative standard deviation for repeatability was 1.35% and intermediate precision was 0.41% and 0.61% for analyst 1 and analyst 2, respectively; accuracy between 99.23 and 101.79%; robustness between 97.13 and 98.45% for the quantiication of M-PEGNC. Mean particle diameters were 261 ± 13 nm and 249 ± 20 nm, polydispersity index was 0.15 ± 0.07 and 0.17 ± 0.06, pH values were 5.0 ± 0.2 and 5.2 ± 0.1, and zeta-potential values were -37.9 ± 3.2 mV e -31.8 ± 2.8 mV for M-PEGNC and placebo(B-PEGNC), respectively. In conclusion, the proposed analytical method is suitable for the quality control of M-PEGNC. Moreover, suspensions showed monomodal size distributions and low polydispersity index indicating high homogeneity of formulations with narrow size distributions, and appropriate pH and zeta potential. The extraction process was eicient for release of meloxicam from nanostructured systems.
Uniterms: High performance liquid chromatography/quantitative analysis. Meloxicam/determination.
PEGylated nanocapsules/quality control. Nanoparticles. Poly(ethylene glycol).
de tamanho monomodal e baixo índice de polidispersão, indicando alta homogeneidade das formulações com distribuição estreita de tamanho, pH e potencial zeta apropriados. O processo de extração foi eiciente para a liberação do meloxicam dos sistemas nanoestruturados.
Unitermos: Cromatograia líquida de alta eiciência/análise quantitativa. Meloxicam/determinação.
Nanocápsulas PEGuiladas/controle de qualidade. Nanopartículas. Poli(etileno glicol).
INTRODUCTION
B i o d e g r a d a b l e p o l y m e r s , s u c h a s p o l y (ε-caprolactone) (PCL) and their copolymers diblocked or multiblocked with poly(ethylene glycol) (PEG), have been commonly used to form polymeric nanoparticles and to encapsulate a variety of therapeutic compounds (Chan et al., 2010; Plapied et al., 2011). Nanoparticles
feature dimensions from one to hundreds of nanometers, and remarkable applications in biomedicine due to the unique way in which they interact with matter (Wagner
et al., 2006; Kim, Rutka, Chan, 2010). However, several
challenges hamper the use of nanoparticles in clinical practice, such as their uptake by the reticuloendothelial system (Knop et al., 2006). The addition of PEG to the
surface of nanoparticles (PEGylation) can reduce many of these challenges. Furthermore, PEG is one of few polymers approved for internal use in humans by the FDA, which is an important consideration in developing new pharmaceutical formulations (USP-NF, 2013).
PEGylated nanoparticles increase the potential for drug delivery and targeting system, besides crossing the blood-brain barrier interacting with microvascular transport proteins. Also, PEG chains can create a barrier layer with the finality of camouflage the phagocytic cells, thus prolonging the circulation period in the blood (Owens III, Peppas, 2006; Grover, Hirani, Sutariya, 2013; Rabanel, Hildgen, Banquy, 2014). Moreover, PEG provides a system with adequate stability in physiological media, which is useful to target tumoral and inflamed regions (Beduneau et al., 2007; Diaz-Lopez et al., 2010;
Hervella et al., 2014). Accordingly, the nanoencapsulation
of anti-inlammatory drugs is very promising for use as adjuvant treatment of various diseases. In this context, meloxicam [4-hydroxy-2-methyl-N
-(5-methyl-2-thiazolyl)-2H
-1,2-benzothiazine-3-carboxamide-1,1-dioxide] is a nonsteroidal anti-inlammatory drug with analgesic and antipyretic efects that preferentially inhibits cyclooxygenase-2 (Megan, 2006).
However, nanoencapsulation requires considerable quality control. The choice of an appropriate analytical methodology is crucial for eicient quality control of an active substance, as such, or in a certain pharmaceutical
form (Ermer, 2001). In order to ensure that an analytical method will generate reliable and interpretable information about a sample, this method must first be validated, ensuring the reliability and traceability of results (Ribani
et al., 2004). In fact, according to Brazilian legislation,
an analytical methodology for analysis of a drug or pharmaceutical form should be validated when it is not described in pharmacopeias or oicial forms recognized by the National Health Surveillance Agency (ANVISA, 2003). No previous data in the literature demonstrated the development and validation of a quantitative bioanalytical high-performance liquid chromatography (HPLC) method for the quantiication of meloxicam-loaded PEGylated nanocapsules(M-PEGNC).
Moreover, experimental studies should ensure that the method meets the requirements of analytical applications, demonstrating the reliability of the results (ANVISA, 2003). The characterization of nanostructured materials is carried out by different methods. These methods are essential to determine the drug content incorporated into them. Some methods for the quantification of meloxicam in pharmaceutical forms by HPLC method are described in the literature (Zhang, Choi, 2008; Bandarkar, Vavia, 2009; Sahoo et al., 2014). However, there is no speciic methodology for
nanostructured systems containing meloxicam. Therefore, in this study, we revalidate the analytical HPLC method for quantitation of M-PEGNC prepared according to the interfacial deposition of preformed polymer. This method was validated according to the oicial guidelines (ANVISA, 2003; ICH, 2005).
MATERIAL AND METHODS
Reagents and chemicals
Meloxicam (Henrifarma® - Brazil). Caprylic/
capric triglyceride and polysorbate 80 (Delaware®
- Brazil). Span 60® (sorbitan monostearate) (Sigma
Aldrich® - USA). Polyethylene glycol 4000 (PEG)
(Galena® – Brazil). Poly(ε-caprolactone) (PCL) (70000)
(Sigma-Aldrich® - USA). HPLC-grade methanol
Corporation®). All other chemicals and solvents used
were of analytical or pharmaceutical grade. All reagents were used as received.
Preparation of loaded PEGylated nanocapsules
M-PEGNC were prepared by interfacial deposition of preformed polymer according to Fessi et al. (1989).
Meloxicam was dissolved in acetone with the polymer (PCL), the oil (caprylic/capric triglyceride) and sorbitan monostearate at 40 ºC. This organic phase was poured into an aqueous phase composed of polysorbate 80 and PEG under stirring, leading to the immediate formation of a milky dispersion. Lastly, the organic solvents were removed under vacuum, and the M-PEGNC was concentrated to 0.3 mg/mL (w/v) and a fixed volume of 25 mL. The placebo suspension (drug-unloaded B-PEGNC) was prepared as described above without adding meloxicam.
Physico-chemical characterization of loaded PEGNC
The particle size, polydispersity index and zeta potential of M-PEGNC and B-PEGNC were measured by photon correlation spectroscopy. Samples were diluted in Milli-Q water and the analysis was performed at 25 ºC, using a Zetasizer® (Nanoseries, Malvern, UK). The pH values of the suspensions were determined using a Denver® (Ultrabasic) potentiometer. Each sample was analyzed in triplicate.
Extraction of meloxicam from the nanocapsules
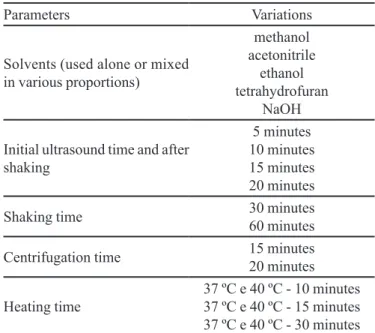
After preparation, several tests were performed for drug extraction from nanocapsules with change of solvents, ultrasound, agitation, heating and centrifugation time (Table I). The amount of meloxicam was determined by the straight-line equation of the standard curve obtained.
Encapsulation efficiency of M-PEGNC
The amount of the encapsulated drug was determined in the clear supernatant following separation of the M-PEGNC from the aqueous medium by a combined iltration and centrifugation technique. The meloxicam content in the M-PEGNC was calculated by the diference between the total and free estimated drug concentrations. Measurements were performed in triplicate for all prepared batches.
TABLE I - Altered parameters for drug extraction from the nanocapsules
Parameters Variations
Solvents (used alone or mixed in various proportions)
methanol acetonitrile
ethanol tetrahydrofuran
NaOH
Initial ultrasound time and after shaking
5 minutes
10 minutes
15 minutes
20 minutes
Shaking time 30 minutes
60 minutes
Centrifugation time 15 minutes
20 minutes
Heating time 37 37 ºC e 40 ºC - 10 minutes ºC e 40 ºC - 15 minutes
37 ºC e 40 ºC - 30 minutes
Chromatographic conditions and instruments
The assay was developed and validated on a Shimadzu LC system (Kyoto Japan), with an LC-20AT pump, SIL-20A ht automatic injector, CTO-SIL-20AC column oven, SPD-M20A photodiode array detector (PDA) and CBM-20A controller with LC solution software. Chromatographic separations were achieved using a Phenomenex® Luna C18 (250 x 4.6 mm, 5 μm) column. The mobile phase and diluent contained a mixture of methanol:aqueous phosphoric acid (1%, v/v) pH 2.5 (70:30 v/v), 1.0 mL/min low, PDA detection at 360 nm (Zhang, Choi, 2008; Patel et al., 2011). The injection volume was 20 μL and the column
temperature was set at 25 ºC.
Validation study
Parameters evaluated included speciicity, linearity, quantiication limit, detection limit, accuracy, precision and robustness.
System suitability
System suitability was evaluated by ive replicate analyses of a meloxicam reference substance and sample at a concentration of 10.0 μg/mL. The parameters calculated were: number of theoretical plates, tailing factor and asymmetry.
Specificity
meloxicam reference chemical substance (RCS) and placebo (B-PEGNC) was prepared. All analyses were performed in triplicate. The purity of the chromatographic peak with respect to meloxicam was determined with the aid of PDA.
Linearity and range
Method linearity was evaluated through a calibration curve in the 1.0-40.0 μg/mL concentration range. An initial solution of meloxicam (1000 μg/mL) was prepared in a volumetric flask with methanol and 1 mL NaOH. This solution was diluted appropriately in the range from 1.0 to 40.0 μg/mL, with an average concentration of 10.0 μg/mL. The linear working range was obtained by plotting the area ratio of meloxicam as a function of the meloxicam concentration, and a least square linear regression analysis was conducted.
Quantification limit and detection limit
The quantiication and detection limits were based on standard deviation of response and mean slope of three calibration curves.
Precision and accuracy
The precision assay was investigated with respect to repeatability (intra-day) and intermediate precision (inter-day). The repeatability was evaluated by assaying six determinations at a concentration of 10.0 μg/mL, during same day and under the same experimental conditions. The same analysis was performed on 3 diferent days to assess intermediate precision. Precision was expressed as % of relative standard deviation (RSD).
A c c u r a c y w a s e v a l u a t e d b y t h e a m o u n t o f meloxicam RCS. The study was performed by adding a known amount of meloxicam standard solution to sample solution, to obtain the inal concentrations of 5.0, 7.0, 10.0, 12.0 and 15.0 µg/mL. The experiments were repeated three times.
Robustness
Four analytical parameters were selected and small variations were induced in nominal values of the method. The parameters employed, as well as the variations introduced are shown in Table II.
An appropriate amount was transferred into an individual 10 mL volumetric flask, diluted to volume with diluents, and iltered through a 0.45 μm membrane filter (Millipore, Bedford, USA), obtaining the final concentration of 10.0 μg/mL of the active pharmaceutical ingredient. The concentrations of meloxicam presented in samples were determined from the standard curve.
RESULTS AND DISCUSSION
In this study, we developed a suspension that enables controlled release through nanocarriers. M-PEGNC consisting of an oily core stabilized with a PEG, M-PEGNC was characterized with respect to their mean particle diameter, polydispersity index, pH, zeta potential and encapsulation eiciency. Furthermore, the analytical HPLC method was validated for quantitation of M-PEGNC. In fact, nanostructured systems coated with polymers, such as PEG, can increase drug half-life in the blood circulation, prevent opsonizing proteins from adhering to the nanomaterial surface, and reduce rapid metabolism and clearance (Kim, Rutka, Chan, 2010; Bender et al., 2012).
Physico-chemical characterization of loaded PEG-NC
We designed M-PEGNC based on a PCL and capric/ caprylic triglyceride materials known to be useful for the encapsulation of drugs (Jornada et al., 2012). In fact,
PCL and PEG meet drug delivery device requirements of biodegradability, biocompatibility and absence of immunogenicity (Chan et al., 2010; Lepeltier, Bourgaux,
Couvreur, 2014). M-PEGNC and B-PEGNC suspensions were prepared by interfacial deposition of preformed polymer and did not require subsequent purification. Both suspensions (M-PEGNC and B-PEGNC) were macroscopically homogeneous bluish-white opalescent liquids.
After preparation, the mean particle diameters (Z-average) were 261 ± 13 nm for M-PEGNC and 249 ± 20 nm for B-PEGNC (Figure 1). In fact, the mean particle sizes of nanocapsules prepared from pre-formed polymers are generally between 250 and 500 nm (Mora-Huertas, Fessi, Elaissari, 2010). Furthermore, particle sizes smaller than 500 nm and composed of biocompatible materials are very important characteristics for therapeutic applications (Bender et al., 2012). However, the size of
TABLE II -Analytical parameters and variations to evaluate
the robustness of the chromatographic method for meloxicam quantiication
Parameter Variation
Mobile phase low rate(mL min-1) 1.2 0.8
Column supplier Phenomenex Gemini
Column temperature (ºC) 25 30
individual particles tested for drug delivery of therapeutic and imaging agents may range from 2 to 1000 nm (Plapied et al., 2011). According to Kreuter (2014), for
pharmaceutical purposes nanoparticles ranging in size from 1 to 1000 nm consist of macromolecular materials in which the active principle is dissolved, entrapped, or encapsulated, or to which the active principle is adsorbed or attached.
T h e s u s p e n s i o n s s h o w e d m o n o m o d a l s i z e distributions and a polydispersity index of 0.15 ± 0.07 for M-PEGNC and 0.17 ± 0.06 for B-PEGNC, indicating that the formulations were highly homogeneous with narrow size distributions. Accordingly, nanoparticles produced by the nanoprecipitation method feature a well-deined size and are characterized by an instantaneously formed narrow distribution (Rao, Geckeler, 2011). The pH values were 5.0 ± 0.2 for M-PEGNC and 5.2 ± 0.1 for B-PEGNC.
FIGURE 1 - Particle diameters of placebo and M-PEGNC.(A) M-PEGNC; (B) Placebo(B-PEGNC).
In general, pH values of nanocapsule dispersion are within a range of 3.0–7.5 when nanoprecipitation occurs. Furthermore, the medium pH may play an important role in relation to the size of the nanoparticles as well as their biodistribution (Mora-Huertas, Fessi, Elaissari, 2010).
Zeta potential is an indicator of surface charge, which determines particle stability in dispersion (Win, Feng, 2005). The zeta-potential values were -37.9 ± 3.2 mV e -31.8 ± 2.8 mV, for M-PEGNC and B-PEGNC respectively (Figure 2). The zeta-potential of nanocapsules depends mainly on the chemical nature of polymer and stabilizing agent, and medium pH (Mora-Huertas, Fessi, Elaissari, 2010). Physicochemical analyses demonstrated that suspensions showed homogeneity with a narrow distribution of mean diameter and low polydispersity. Additionally, suspensions demonstrated appropriate zeta potential and pH. According to a study by Win and Feng
(2005), stable nanoparticules were found in a state of dispersion, with high absolute values of zeta potential and negative surface charges.
Extraction of M-PEGNC
Several tests were performed for the extraction of meloxicam from the nanocapsules. The best way to mine meloxicam in several tests was by adding nanocapsules in suspension in a volumetric lask with 3 mL methanol and subjecting it to ultrasound for 15 minutes, followed by heating at 40 °C for another 15 minutes. Next this solution was subjected to shaking for 60 minutes. To this solution were added 1 mL NaOH 0.5 M methanolic and 6 mL tetrahydrofuran and it was subjected to ultrasound for another 15 minutes. Then, this solution was added in another volumetric lask and supplemented with methanol. This solution was centrifuged at 4000 rpm for 10 minutes in order to extract the drug present in the nanostructures. The changes in some method parameters, such as solvents, ultrasound, agitation, heating and centrifugation during the optimization of drug extraction process from nanocapsules were rejected for diferent reasons, e.g. precipitation of the polymer or drug degradation. The extraction process proved to be efficient and the proposed method was simple and eicient for quantiication and quality control of M-PEGNC.
Quantification of M-PEGNC
The extraction method described above was used to determine meloxicam in nanocapsules. After extraction,
the samples were iltered and then analyzed by HPLC, using the previously validated method. The theoretical concentration obtained was 10.0 mg/mL.
Encapsulation efficiency of M-PEGNC
The calculation of the difference between total amount of drug present in the suspension and free drug found in the supernatant after centrifugation was used to check the encapsulation efficiency of M-PEGNC. The encapsulation eiciency was close to 99% for all batches. Agreement about nanoprecipitaton methods generated good results for nanocapsule encapsulation (80% or more). In addition, drug encapsulation eiciency is determined by different factors, such as chemical nature and polarity of the drug (Mora-Huertas, Fessi, Elaissari, 2010).
Validation method
System suitability
To obtain the best chromatographic method, the mobile phase containing methanol and aqueous phosphoric acid (70:30 v/v, pH 2.5) was utilized to provide adequate peak and satisfactory results. A 250 mm length octylsilane column was able to obtain a resolution and peak asymmetry and short analysis time.
Specificity
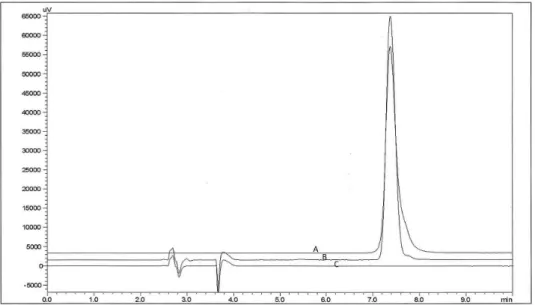
The chromatograms obtained with the speciicity test (Figure 3), showed that none of the formulation excipients eluted in the same retention time as the
FIGURE 3 - Chromatograms corresponding to: (A) solution of meloxicam reference substance; (B) M-PEGNC; (C) Placebo
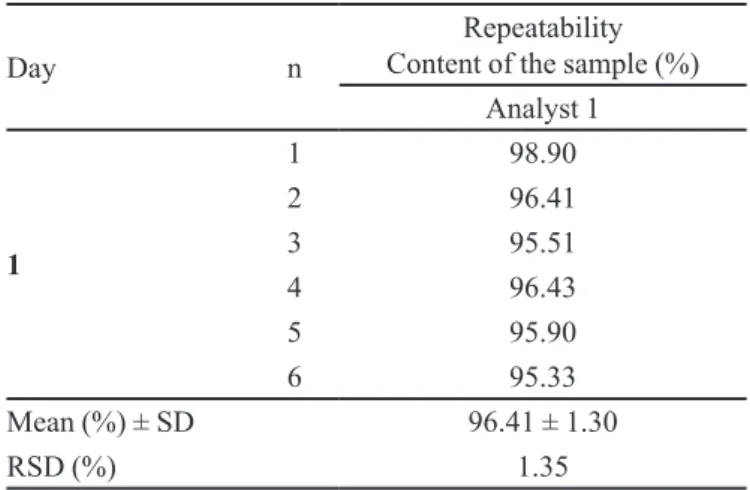
TABLE III - Analytical parameters and variations to evaluate the
repeatability of the chromatographic method for meloxicam quantiication
Day n
Repeatability
Content of the sample (%)
Analyst 1
1
1 98.90
2 96.41
3 95.51
4 96.43
5 95.90
6 95.33
Mean (%) ± SD 96.41 ± 1.30
RSD (%) 1.35
*p<0,05; SD – standard deviation; RSD – relative standard deviation.
meloxicam. Therefore none of the excipients interfered in the quantitative analysis of the meloxicam.
Linearity and range
Linearity corresponds to the ability of the methodology to demonstrate that values obtained are directly proportional to the drug concentration in the sample within a speciied range. In fact, it is recommended that it be composed of at least ive concentration levels within a range corresponding to at least 80 to 120 % of the working concentration (ANVISA, 2003; ICH, 2005).
Linearity was observed over the concentration range of 1.0 - 40.0 μg/Ml (Figure 4), with a correlation coefficient of r = 1.0000 according to the criteria established for r = 0.99 and the linear regression equation y = 72888x –2717 (where, x is concentration and y is the peak absolute area). Assay validity was veriied by means of the ANOVA. According to the statistical data, there is a linear relationship between the variables and there is no deviation from linearity (p<0.05). It was shown that it could be used for interpolation of the experimental values, aiming at quantitative determination of this substance. Quantiication and detection limits were 1.78 μg/mL and 0.59 μg/mL respectively, showing method sensibility.
Precision and accuracy
Precision is the scattering of results among diferent studies, repeated from the same sample, or samples of similar patterns under defined conditions (ANVISA, 2003).
Method precision was evaluated as repeatability and intermediate precision and was expressed as RSD %. Mean results were 1.35% and 0.51% of RSD respectively. The limit is RSD maximum of 2.0% (USP, 2012).
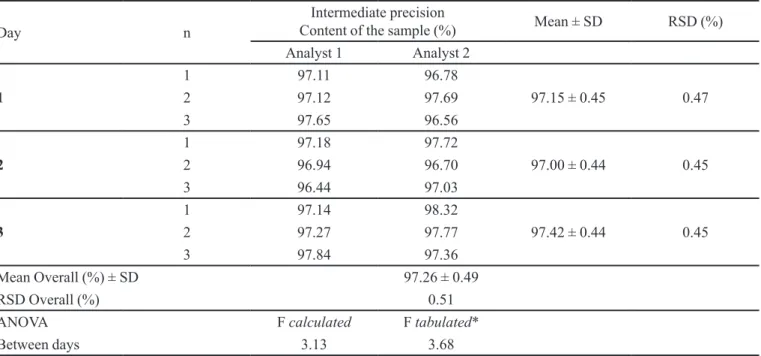
Experimental results for intermediate precision were evaluated statistically by analysis of variance (ANOVA) in order to determine whether there is a signiicant diference
FIGURE 4 - Graphic representation of the average standard
curve reference chemical substance(RCS) meloxicam.
in the values obtained on different days. As shown in Tables III and IV, the value obtained for calculated F is lower than the tabulated value F, indicating no signiicant diference between the results for p<0.05.
From RSD values obtained, it can be seen that the developed method provides an accurate determination to show when it was performed on diferent days and by diferent analysts, and adequate repeatability for analysis on the same day.
The test was carried out accurately by retrieving the amounts of RCS added to the sample, obtaining a mean value of 100.25% (Table V). The recommended value for diferent levels of concentration must be in the range of 98.0% to 102.0% (ANVISA, 2003; ICH, 2005). The method showed adequate strength when subjected to small variations in the parameters established.
Robustness
After variation of some parameters of the method proposed, these variations were not able to signiicantly change the meloxicam content in the sample, average levels of meloxicam ranging from 97.13 to 98.45%.
robust results. Furthermore, the method is linear over a wide range, inexpensive and utilizes a mobile phase that can be easily prepared. Moreover, some studies indicated that use of methanol as an organic solvent is less harmful for the environment and it is even considered favorable when a methanol-water mixture is used (Capello, Fischer, Hungerbuhler, 2007). A 250 mm length octylsilane column was able to obtain a resolution, peak asymmetry and short analysis time. All these factors make this method suitable for quantiication of M-PEGNC.
CONCLUSION
In conclusion, the suspensions showed mean particle sizes according to the literature, monomodal size
distributions and low polydispersity index indicating highly homogeneous formulations with narrow size distributions and appropriate pH and zeta potential. The extraction process proved to be eicient for the release of meloxicam nanostructured systems. The proposed liquid chromatography method provides selective, linear, precise, accurate and robust results for the quantiication of M-PEGNC. The proposed method is suitable to determine meloxicam in the quality control for M-PEGNC.
ACKNOWLEDGEMENTS
The financial support by FAPERGS (#1924-2551/13-1), CAPES, UFPel and UNIFRA is gratefully acknowledged.
TABLE IV - Analytical parameters and variations to evaluate the intermediate precision of the chromatographic method for
meloxicam quantiication
Day n
Intermediate precision
Content of the sample (%) Mean ± SD RSD (%)
Analyst 1 Analyst 2
1
1 97.11 96.78
2 97.12 97.69 97.15 ± 0.45 0.47
3 97.65 96.56
2
1 97.18 97.72
2 96.94 96.70 97.00 ± 0.44 0.45
3 96.44 97.03
3
1 97.14 98.32
2 97.27 97.77 97.42 ± 0.44 0.45
3 97.84 97.36
Mean Overall (%) ± SD 97.26 ± 0.49
RSD Overall (%) 0.51
ANOVA Fcalculated Ftabulated*
Between days 3.13 3.68
*p<0,05; SD – standard deviation; RSD – relative standard deviation.
TABLE V - Experimental values obtained for the accuracy test
Samples Final concentration (µg/mL) Average number of RCS recovered*
(µg/mL) (% +SD)
R1 7 6.95 99.23 ± 0.12
R2 10 10.07 100.70 ± 0.29
R3 12 12.41 99.30 ± 0.12
R4 15 15.27 101.79 ± 0.47
REFERENCES
AGÊNCIA NACIONAL DE VIGILÂNCIA SANITÁRIA. Resolução RE nº 899, de 29 de maio de 2003. Guia para validação de métodos analíticos e bioanalíticos. Brasília:
Visalegis, 2003. p.15.
BANDARKAR, F.S.; VAVIA, P.R. A stability indicating HPLC method for the determination of meloxicam in bulk and
commercial formulations. Trop. J. Pharm. Res., v.8, n.3,
p.257-264, 2009.
BEDUNEAU, A.; SAULNIER, P.; HINDRE, F.; CLAVREUL, A.; LEROUX, J.C.; BENOIT, J.P. Design of targeted lipid nanocapsules by conjugation of whole antibodies and antibody Fab’ fragments. Biomaterials., v.28, n.33, p.4978-4990, 2007.
BENDER, E.A.; ADORNE, M.D.; COLOMÉ, L.M.; ABDALLA, D.S.P.; GUTERRES, S.S.; POHLMANN, A.R. Hemocompatibility of poly(e-caprolactone) lipid-core nanocapsules stabilized with polysorbate 80-lecithin and
uncoated or coated with chitosan. Int. J. Pharm., v.426,
n.1-2, p.271-279, 2012.
CAPELLO, C.; FISCHER, U.; HUNGERBUHLER, K. What is a green solvent? A comprehensive framework for the
environmental assessment of solvents. Green Chem., v.9,
p.927-934, 2007.
CHAN, J.M.; VALENCIA, P.M.; ZHANG, L.; LANGER, R.; FAROKHZAD, O.C. Polymeric nanoparticles for drug
delivery. Methods Mol. Biol., v.624, p.163-175, 2010.
DIAZ-LOPEZ, R.; TSAPIS, N.; SANTIN, M.; BRIDAL, S.L.; NICOLAS, V.; JAILLARD, D.; LIBONG, D.; CHAMINADE, P.; MARSAUD, V.; VAUTHIER, C.; FATTAL, E. The performance of PEGylated nanocapsules of perluorooctyl bromide as an ultrasound contrast agent. Biomaterials., v.31 n.7, p.1723-1731, 2010.
ERMER, J. Validation in pharmaceutical analysis. Part I: an integrated approach. J. Pharm. Biomed. Anal., v.24, n.5-6, p.755-767, 2001.
FESSI, H.; PUISIEUX, F.; DEVISSAGUET, J.P.; AMOURY, N.; BENITA, S. Nanocapsules formation by interfacial polymer deposition following solvent displacement. Int. J. Pharm., v.113, p.1-4, 1989.
GROVER, A.; HIRANI, A.; SUTARIYA, V. Nanoparticle-Based
Brain Targeted Delivery Systems. J. Biomol. Res. Ther.,
v.2, p.1-3, 2013.
HERVELLA, P.; ALONSO-SANDE, M.; LEDO, F.; LUCERO, M.L.; ALONSO, M.J.; GARCIA-FUENTES, M. PEGylated lipid nanocapsules with improved drug encapsulation and
controlled release properties. Curr. Top. Med. Chem., v.14,
n.9, p.1115-1123, 2014.
INTERNATIONAL CONFERENCE ON HARMONIZATION. ICH. Q2(R1) Validation of Analytical methods: Text and Methodology. International Conference on Harmonization of Technical Requirements for Registration of Pharmaceuticals for Human Use. Geneva, 2005.
JORNADA, D.S.; FIEL, L.A.; BUENO, K.; GERENT, J.F.; PETZHOLD, C.L.; BECK, R.C.R.; GUTERRES, S.S.; POHLMANN, A.R. Lipid-core nanocapsules: mechanism of self-assembly, control of size and loading capacity. Soft Matter., v.8, p.6646-6655, 2012.
KIM, B.Y.S; RUTKA, J.T.; CHAN, W.C.W. Nanomedicine. N. Eng. J. Med., v.363, n.25, p.2434-2443, 2010.
KNOP, K.; HOOGENBOOM, R.; FISCHER, D.; SCHUBERT, U.S. Poly(ethylene glycol) in drug delivery: pros and cons
as well as potential alternatives. Angew. Chem. Int. Ed. Engl., v.49, n.36, p.6288-6308, 2006.
KREUTER, J. Drug delivery to the central nervous system by polymeric nanoparticles: What do we know? Adv. Drug. Deliv. Rev., v.71, p.2-14, 2014.
LEPELTIER, E.; BOURGAUX, C.; COUVREUR, P. Nanoprecipitation and the “Ouzo efect”: Application to drug delivery devices. Adv. Drug. Deliv. Rev., v.71, p.86-97, 2014.
MEGAN, S.K. Meloxicam. J. Exotic. Pet. Med., v.15, n.4, p.281-283, 2006.
MORA-HUERTAS, C.E.; FESSI, H.; ELAISSARI, A. Polymer-based nanocapsules for drug delivery. Int. J. Pharm.,v.385,
n.1-2, p.113-142, 2010.
PATEL, M.; JOSHI, A.; HASSANZADETH, H.; JULURU, R.; STAGNI, G. Quantiication of dermal and transdermal delivery of meloxicam gels in rabbits. Drug Dev. Ind. Pharm., v.37, n.5,p.613-617, 2011.
PLAPIED, L.; DUHEM, N.; RIEUX, A.; PRÉAT, V. Fate of polymeric nanocarriers for oral drug delivery. Curr. Opin. Colloid Interface Sci , v.16, n.3, p.228-237, 2011.
RABANEL, J.M.; HILDGEN, P.; BANQUY, X. Assessment of PEG on polymeric particles surface, a key step in drug
carrier translation. J. Controll. Release., v.185, p.71-87, 2014.
RAO, J.P.; GECKELER, K.E. Polymer nanoparticles: Preparation techniques and size-control parameters. Prog. Polym. Sci.,v.36, n.7, p.887-913, 2011.
RIBANI, M.; BOTTOLI, C.B.; COLLINS, C.; JARDIM, I.C.; MELO, L. Validação em métodos cromatográicos e eletroforéticos. Quim. Nova., v.27, n.5, p.771-780, 2004.
SAHOO, N.K.; SAHU, M.; RAO, P.S.; RANI, N.S.; DEVI, J.I.; GHOSH, G. Validation of assay indicating method development of meloxicam in bulk and some of its tablet dosage forms by RP-HPLC. Springerplus., v.3, n.95,
p.1-6, 2014.
UNITED STATES PHARMACOPEIA.USP. United States Pharmacopeia Convention: Validation of Compendial Methods. Rockville, 1999.
UNITED STATES PHARMACOPEIA. USP. United States Pharmacopeia Convention. 35.ed. Rockville, 2012. 4200 p.
UNITED STATES PHARMACOPEIA AND NATIONAL FORMULARY. USP-NF. Polyethylene glycol. Rockville, MD: The United States Pharmacopeial Convention, 2013.
p.2139-2141.
WIN, K.Y.; FENG, S.S. Effects of particle size and surface coating on cellular uptake of polymeric nanoparticles for
oral delivery of anticancer drugs. Biomaterials., v.26, n.15,
p.2713-2722, 2005.
WAGNER, V.; DULLAART, A.; BOCK, A.; ZWECK, A. The
emerging nanomedicine landscape. Nat. Biotechnol., v.24,
n.10, p.1211-1218, 2006.
ZHANG, H.; CHOI, H.K. Analysis of meloxicam by high-performance liquid chromatography with cloud-point extraction. Anal. Bioanal. Chem., v.392, n.5, p.947-953, 2008.
Received for publication on 29th March 2015