Quality of life and participation restrictions, a study in elderly
Abstract
Ruth Magalhães1, Maria Cecilia Martinelli Iório2
1 Master’s degree in science, Sao Paulo Federal University (Universidade Federal de São Paulo, Unifesp). Speech therapist, Auditory Health Clinic, Santo Amaro Holy House of Mercy
(Santa Casa de Misericórdia de Santo Amaro).
2 Assistant professor, Sao Paulo Federal University (Universidade Federal de São Paulo). Head of the Phonoaudiology Department.
Send correspondence to: Ruth Magalhães - Av. Adolfo Pinheiro 760, ap. 222A, Santo Amaro. CEP: 04.734-001. São Paulo - SP. Phone. (550xx21) 9846 - Cel. 7644-8896 - E-mail: [email protected]
Paper submited to the BJORL-SGP (Publishing Management System – Brazilian Journal of Otorhinolaryngology) on August 30, 2010; and accepted on November 4, 2010. cod. 7295
A
ccording to the IBGE, Brazil had 21 million elderly persons in 2008.Objective: To study the effects of speech therapy - fitting of hearing aids - on the quality of life of elderly persons and restriction of participation according to sex and age.
Material and Method: 50 elderly subjects, 23 females and 27 males, were allocated to Group 1 and Group 2, and were assessed with questionnaires (HHIE and SF 36) before and one year after fitting hearing aids; subjects were monitored every two months.
Results: The HHIE Social and Emotional Scale was significant with regards to sex and age after fitting hearing aids. The SF 36 results after fitting hearing aids were significant in six of eight test aspects. Two test aspects were not significant after fitting hearing aids; pain, however, was significant in the elderly group 2.
Conclusion: There is little awareness of participation restrictions after the HHIE intervention. There is improvement in quality of life after rehabilitation. Retrospective study.
ORIGINAL ARTICLE
Braz J Otorhinolaryngol. 2011;77(5):628-38.
BJORL
Keywords:
health of the elderly, hearing aids, hearing loss, quality of life, questionnaires.
INTRODUCTION
One of the most devastating and incapacitating deficiencies of old age is presbiacusis. Hearing loss causes difficulties in understanding speech, affects communica-tion, and compromises family and social life. Thus, auditory loss in the elderly affects not only hearing but also has marked psychosocial implications1.
According to the Pan-American Health Organization (PAHO), healthy and active aging implies valuing auto-nomy and preserving physical and psychic autoauto-nomy, among other factors, and preventing functional losses or reducing their negative effects2.
In the Brazilian Unified Health System (Sistema Unico de Saude, or SUS), it is considered essential to as-sure full care to the elderly population and to emphasize healthy and active aging (No. 2,528, 19 October 2006). It is thus necessary to learn about the Brazilian elderly popu-lation; according to the Brazilian Geography and Statistical Institute (Instituto Brasileiro de Geografia e Estatística, or IBGE) there are nearly 21 million elderly people in Brazil3.
The national policy for the elderly aims to assu-re social rights for this population group by promoting autonomy and effective participation in society with the purpose of maintaining quality of life. According to the IBGE, if the fertility and longevity trends continue in Brazil, the number of elderly people is estimated to be over 30 million in the next 20 years, which comprises nearly 13% of the population.
Living longer may imply in a life of physical inca-pacity and dependence. There is a further challenge for healthcare professionals working with elderly people: to assess quality of life rather than only to measure aging, and the impact of treatments and public policies for this age group4.
In this context, healthcare professionals need to specifically study this age group. Questionnaires have been used as evaluation tools to measure the difficulties of elderly individuals and their perception of these handi-caps. One of these questionnaires is the Hearing Handicap Inventory for the Elderly; it aims to assess the impact of hearing loss on the emotional and social realities of elderly subjects. Another such questionnaire is the Short Form Health Survey - SF 36, which aims to assess health and quality of life; it consists of two parts: the first investigates the health status (questions about physical mobility, pain, sleep, energy, social isolation, and emotional reactions) and the second evaluates the impact of disease on the patient’s daily life.
A few questions were subsequently raised: what is the impact of hearing loss on the quality of life of elderly individuals? Do men or women have more perception of
restrictions in daily life? Which age group has the most compromised quality of life?
It is evident that a protocol for assessing the quality of life of elderly individuals and their opinion about issues they consider important is needed.
Therefore, the purpose of this study was to investi-gate the effects of phonoaudiological interventions (fitting hearing aids) in relation to restricted participation in daily life activities and quality of life of elderly individuals; the variables were sex and age.
MATERIAL AND METHODS
The institutional review board assessed and ap-proved the study design (no. CEP 0913/08). Patients that agreed to participate signed a free informed consent form (based on the Resolution 196/96 on guidelines about re-search in human beings).
The following inclusion criteria were defined: age over 60 years, up to severe bilateral symmetrical sensori-neural hearing loss, speech recognition score over 50%, indication for adapting binaural hearing aids, no evidence of other conditions, and being literate.
The sample comprised 50 elderly subjects - 23 fe-male (46%) and 27 fe-male (54%) - aged 60 years or above. The subjects were allocated to two age groups, as follows: Group 1 (G1), which consisted of 24 subjects (48%) aged from 60 to 74 years, of which 11 were female and 13 were male, and Group 2 (G2), which consisted of 26 subjects (52%) aged 75 years and above, of which 12 were female and 14 were male.
Audiological testing consisted of pure tone audi-ometry, play audiaudi-ometry, and immittance testing, which were done at our Clinic by expert staff speech therapists.
The self-assessment questionnaires used in this study were the Hearing Handicap Inventory for the Elderly (HHIE) and the Medical Outcome Study 36-Item Short Form Health Survey (SF 36).
The HHIE questionnaire was developed to assess the psychosocial, emotional, and social consequences of hearing loss in elderly patients. It was originally devel-oped in English language and adapted to Portuguese by Wieselberg (1997). We used the pencil and paper applica-tion technique.5
auditory and non-auditory difficulties. The scores are dis-tributed as follows: no perception of a handicap = 0 to 16; mild to moderate perception of a handicap = 18 to 42; and severe/significant perception of a handicap = > 42 points.
The Medical Outcome Study 36-Item Short Form Health Survey (SF 36) was first developed and then translated for the Brazilian population6,7. It is a generic
tool that is used to assess the quality of life of patients; it consists of 11 questions and 36 items on different topics, as follows: functional ability, physical aspects, emotional aspects, intensity of pain, general health status, vitality, social aspects, and mental health. The application techni-The application techni-que was paper and pencil.
Eight aspects were evaluated, as follows: functional capacity - 10 items; physical aspects and vitality - four items; emotional aspects - three items; pain and social aspects - two aspects; general health status and mental health - five items. Each subject is scored in each aspect, which is then consolidated in a 0 to 100 scale where 0 is the worst score and 100 is the best; thus, higher scores indicate better quality of life.
Seven meetings with two-month intervals between each were scheduled to monitor the patients as they adap-ted to hearing aids. During these meetings patients were oriented about the use, care, and handling of hearing aids, as well as communication strategies.
1st meeting - The elderly subjects answered the
printed SF 36 and HHIE questionnaires. After this meeting and during August 2008, retroauricular bilateral hearing aids were fitted; all were of the same brand and type, and had been selected beforehand by the institution staff.
2nd meeting - Elderly subjects at this point were
adapted to their hearing aids and could clear up any dou-bts about their use, handling, and care. In this meeting, each subject was given the opportunity to describe his or her difficulties and victories with using hearing aids up to this point.
3rd meeting - Subjects were given instructions about
how to use telephones. Doubts about handling and care of hearing aids were discussed.
4th meeting - In this meeting each subject was
gi-ven a dehumidifier and a device for cleaning the molds. Verbal and practical instructions were given about how to use these materials, and an explanatory folder was also handed out.
5th meeting - Elderly subjects now have used the
hearing aids for over six months; but instructions about their use, care, and handling were repeated. The group could be seen to interact; those that had adapted better helped other with difficulties.
6th meeting - Each subject was given a key ring
that tested the hearing aid battery; verbal and practical
instructions about how to use this device were given; an explanatory folder was also handed out.
7th meeting - In this last meeting, after about one
year of bilateral hearing aid use, all elderly subjects were answered the SF 36 and HHIE questionnaires.
STATISTICS
The sample was characterized according to sex and age. Tables containing descriptive statistical values for the HHIE and SF 36 scores were made for each period, sex, and age group.
Analysis of variance with repeated measures was applied to compare the mean scores of questionnaires (two evaluations), sex, and age groups8. After this analysis, the
means of differences between both tests (pre and post) were estimated, and 95% confidence intervals were made for these means.
The statistics software Minitab version 15 and the SPSS version 11 were used in the statistical analysis. The significance level for each hypothesis was 0.05, and the significant p-values were marked with an asterisk (*).
RESULTS
The study sample comprised 50 elderly subjects, 23 female (46%) and 27 male (54%). There were 24 subjects aged from 60 to 74 years (48%) and 26 subjects aged over 75 years (52%).
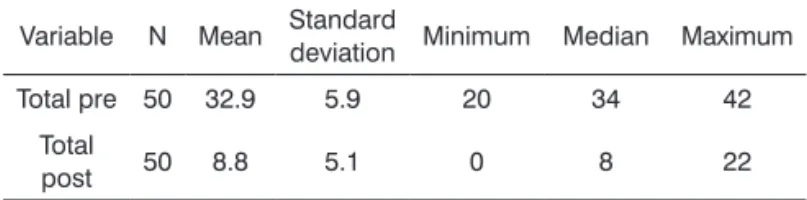
Descriptive statistics were made for the HHIE questionnaire scores before (pre) and after (post) the intervention (Table 1).
Table 1. Descriptive statistics for total HHIE scores before and after the intervention.
Variable N Mean Standard
deviation Minimum Median Maximum
Total pre 50 32.9 5.9 20 34 42
Total
post 50 8.8 5.1 0 8 22
Pré x Pós - p = 0, 000*
Tables 2 and 3 show the questionnaire scores for the emotional and social scales.
DISCUSSION
The increasing elderly population in Brazil requires healthcare programs to provide adequate quality of life for this age group.
The impact of auditory loss on the quality of life of individuals may be measured by the configuration and degree of hearing loss, as well as the age of patients when this condition arises. Thus, decreased participation in acti-vities of daily life due to hearing loss compromises social and professional performance, and therefore quality of life.
The mean values of the total HHIE score were 32.9% (pre-intervention) and 8.8% (post-intervention), which was a significant improvement. These results are compatible with the self-awareness of moderate participation restric-tion in the pre-adaptarestric-tion period and non-awareness in the post-adaptation period.
Authors in several studies that applied the HHIE questionnaire have reported that elderly individuals need to be included in hearing rehabilitation programs
to minimize the psychosocial reactions to hearing loss. These authors have also found that elderly subjects show effectively fewer restrictions to participation after taking part in hearing rehabilitation programs. The importance of hearing aid fitting is also underlined10.
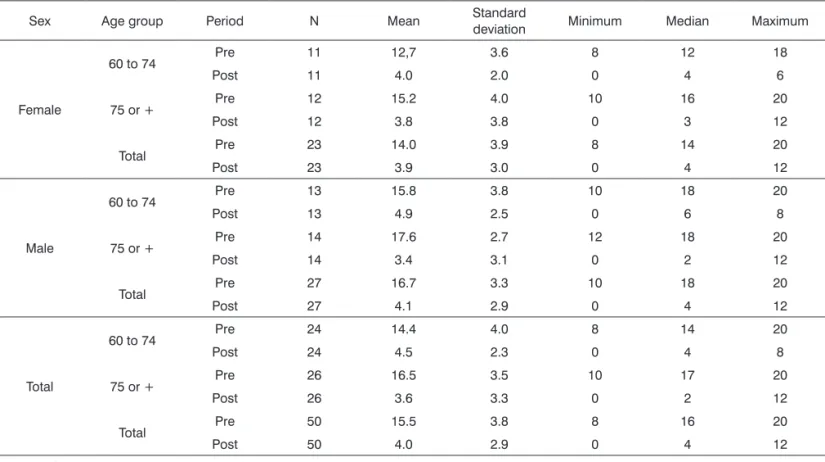
A separate analysis of the emotional and social/ situational scores revealed that the mean post-intervention (one year later) scores of the emotional scale were sig-nificantly lower than pre-intervention scores in both age groups (60 to 74 years and 75 years or more) in both males and females.
The mean score in elderly male subjects was sig-nificantly higher in the pre-intervention period compared to females; this difference in means disappeared in the post-intervention period. The decrease between the pre- and post-intervention period was larger in males than in females, which showed that elderly male subjects per-ceived more their restrictions to participation before the intervention.
Table 2. Analysis of variance and descriptive statistics for the emotional scale scores in the HHIE, according to sex and age group.
Sex Age group Period N Mean Standard
deviation Minimum Median Maximum
Female
60 to 74 Pre 11 12,7 3.6 8 12 18
Post 11 4.0 2.0 0 4 6
75 or + Pre 12 15.2 4.0 10 16 20
Post 12 3.8 3.8 0 3 12
Total Pre 23 14.0 3.9 8 14 20
Post 23 3.9 3.0 0 4 12
Male
60 to 74 Pre 13 15.8 3.8 10 18 20
Post 13 4.9 2.5 0 6 8
75 or + Pre 14 17.6 2.7 12 18 20
Post 14 3.4 3.1 0 2 12
Total Pre 27 16.7 3.3 10 18 20
Post 27 4.1 2.9 0 4 12
Total
60 to 74 Pre 24 14.4 4.0 8 14 20
Post 24 4.5 2.3 0 4 8
75 or + Pre 26 16.5 3.5 10 17 20
Post 26 3.6 3.3 0 2 12
Total Pre 50 15.5 3.8 8 16 20
Post 50 4.0 2.9 0 4 12
Analysis of variance
Pre x Post x Sex → p = 0.021* Female x Pre x Post → p = 0.000* Male x Pre x Post → p = 0.000* Pre x Female x Male → p = 0.003* Pre x Post x Age group → p = 0.008* G1 (60 to 74 years) x Pre x Post → p = 0.000* G2 (75 years or +) x Pre x Post → p = 0.000*
Table 3. Analysis of variance and descriptive statistics for HHIE scores in the social/situational scale according to sex and age group.
Sex Age group Period N Mean Standard
de-viation Minimum Median Maximum
Female
60 to 74 Pre 11 14.2 4.2 8 16 20
Post 11 4.4 3.9 0 4 10
75 or+ Pre 12 17.0 2.6 12 16 20
Post 12 4.8 2.8 2 4 10
Total Pre 23 15.7 3.7 8 16 20
Post 23 4.6 3.3 0 4 10
Male
60 to 74 Pre 13 18.5 2.0 14 20 20
Post 13 5.1 3.0 0 6 8
75 or+ Pre 14 19.3 1.5 16 20 20
Post 14 4.7 2.8 2 4 12
Total Pre 27 18.9 1.8 14 20 20
Post 27 4.9 2.8 0 6 12
Total
60 to 74 Pre 24 16.5 3.8 8 18 20
Post 24 4.8 3.4 0 6 10
75 or+ Pre 26 18.2 2.4 12 20 20
Post 26 4.8 2.7 2 4 12
Total Pre 50 17.4 3.2 8 18 20
Post 50 4.8 3.0 0 4 12
Analysis of variance
Pre x Post x Sex →p = 0.004* Female x Pre x Post →p = 0.000* Male x Pre x Post →p = 0.000* Pre x Female x Male →p = 0.000*
Table 4. Analysis of variance and descriptive statistics for the functional ability aspect according to sex and age group.
Sex Faixa etária Período N Média Desvio padrão Mínimo Mediana Máximo
Female
60 to 74 Pre 11 53.2 20.4 30 50 90
Post 11 59.1 13.9 40 60 90
75 or+ Pre 12 49.2 25.5 0 47.5 80
Post 12 57.5 25.2 5 50 95
Total Pre 23 51.1 22.8 0 50 90
Post 23 58.3 20.1 5 50 95
Male
60 to 74 Pre 13 49.6 11.4 35 50 70
Post 13 56.9 19.7 30 50 100
75 or+ Pre 14 49.6 25.9 15 47.5 90
Post 14 54.3 22.5 15 50 90
Total Pre 27 49.6 19.9 15 50 90
Post 27 55.6 20.9 15 50 100
Total
60 to 74 Pre 24 51.3 15.9 30 50 90
Post 24 57.9 17.0 30 50 100
75 or+ Pre 26 49.4 25.2 0 47.5 90
Post 26 55.8 23.4 5 50 95
Total Pre 50 50.3 21.1 0 50 90
Post 50 56.8 20.4 5 50 100
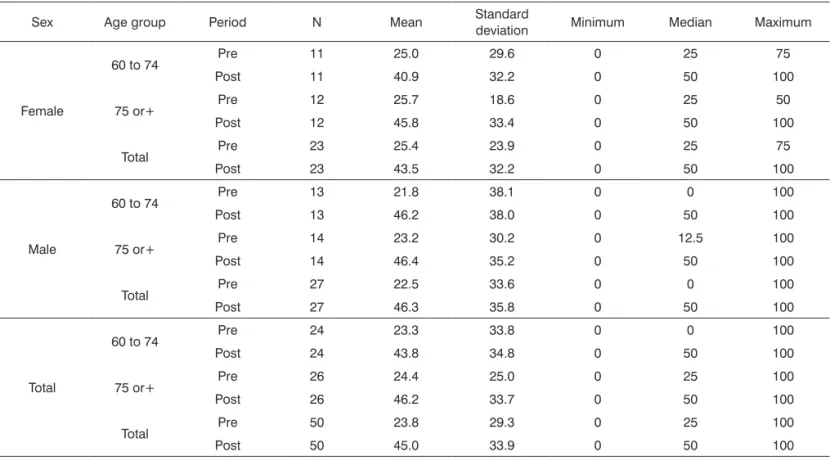
Table 5. Analysis of variance and descriptive statistics for the physical status aspect according to sex and age group.
Sex Age group Period N Mean Standard
deviation Minimum Median Maximum
Female
60 to 74 Pre 11 25.0 29.6 0 25 75
Post 11 40.9 32.2 0 50 100
75 or+ Pre 12 25.7 18.6 0 25 50
Post 12 45.8 33.4 0 50 100
Total Pre 23 25.4 23.9 0 25 75
Post 23 43.5 32.2 0 50 100
Male
60 to 74 Pre 13 21.8 38.1 0 0 100
Post 13 46.2 38.0 0 50 100
75 or+ Pre 14 23.2 30.2 0 12.5 100
Post 14 46.4 35.2 0 50 100
Total Pre 27 22.5 33.6 0 0 100
Post 27 46.3 35.8 0 50 100
Total
60 to 74 Pre 24 23.3 33.8 0 0 100
Post 24 43.8 34.8 0 50 100
75 or+ Pre 26 24.4 25.0 0 25 100
Post 26 46.2 33.7 0 50 100
Total Pre 50 23.8 29.3 0 25 100
Post 50 45.0 33.9 0 50 100
Analysis of variance Pre x Post →p = 0.000*
Table 6. Analysis of variance and descriptive statistics of the pain aspect according to sex and age group.
Sex Age group Period N Mean Standard
deviation Minimum Median Maximum
Female
60 to 74 Pre 11 54.8 27.9 22 51 100
Post 11 57.5 32.2 12 51 100
75 or+ Pre 12 60.8 23.8 31 51.5 100
Post 12 62.8 17.0 42 56.5 100
Total Pre 23 58.0 25.4 22 51 100
Post 23 60.2 25.0 12 51 100
Male
60 to 74 Pre 13 48.6 22.2 12 51 84
Post 13 52.8 23.6 12 51 100
75 or+ Pre 14 57.4 18.8 11 56.5 100
Post 14 59.6 13.6 51 52 100
Total Pre 27 53.2 20.6 11 52 100
Post 27 56.3 19.0 12 51 100
Total
60 to 74 Pre 24 51.5 24.6 12 51 100
Post 24 54.9 27.4 12 51 100
75 or+ Pre 26 59.0 20.9 11 52 100
Post 26 61.0 15.1 42 52 100
Total Pre 50 55.4 22.8 11 51 100
Post 50 58.1 21.8 12 51 100
Analysis of variance
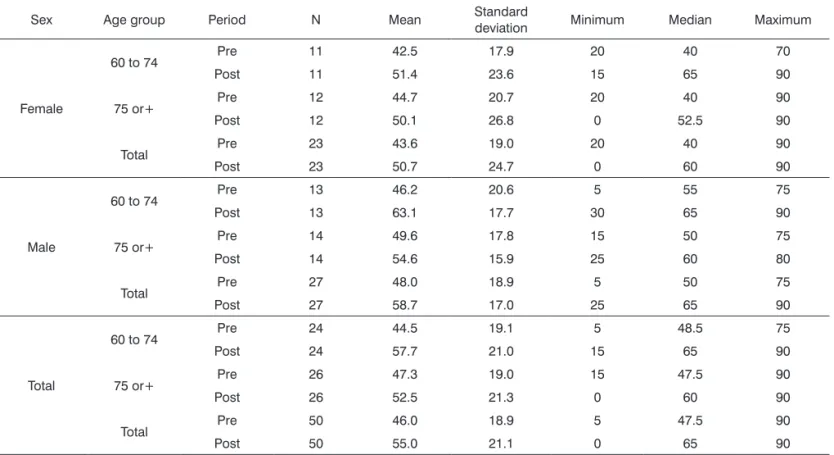
Table 7. Analysis of variance and descriptive statistics for the vitality aspect according to sex and age group.
Sex Age group Period N Mean Standard
deviation Minimum Median Maximum
Female
60 to 74 Pre 11 42.5 17.9 20 40 70
Post 11 51.4 23.6 15 65 90
75 or+ Pre 12 44.7 20.7 20 40 90
Post 12 50.1 26.8 0 52.5 90
Total Pre 23 43.6 19.0 20 40 90
Post 23 50.7 24.7 0 60 90
Male
60 to 74 Pre 13 46.2 20.6 5 55 75
Post 13 63.1 17.7 30 65 90
75 or+ Pre 14 49.6 17.8 15 50 75
Post 14 54.6 15.9 25 60 80
Total Pre 27 48.0 18.9 5 50 75
Post 27 58.7 17.0 25 65 90
Total
60 to 74 Pre 24 44.5 19.1 5 48.5 75
Post 24 57.7 21.0 15 65 90
75 or+ Pre 26 47.3 19.0 15 47.5 90
Post 26 52.5 21.3 0 60 90
Total Pre 50 46.0 18.9 5 47.5 90
Post 50 55.0 21.1 0 65 90
Analysis of variance Pre x Post →p = 0.006*
Table 8. Analysis of variance and descriptive statistics for the social aspect according to sex and age group.
Sexo Age group Period N Mean Standard
de-viation Minimum Median Maximum
Female
60 to 74 Pre 11 43.1 21.1 0 50 75
Post 11 70.5 29.7 12.5 87.5 100
75 or+ Pre 12 59.3 24.0 25 50 100
Post 12 67.7 25.3 25 68.75 100
Total Pre 23 51.6 23.6 0 50 100
Post 23 69.0 26.9 12.5 75 100
Male
60 to 74 Pre 13 52.9 17.8 25 50 75
Post 13 78.8 18.7 25 87.5 100
75 or+ Pre 14 59.5 25.8 0 56.25 100
Post 14 65.2 30.3 0 75 100
Total Pre 27 56.3 22.2 0 50 100
Post 27 71.8 25.8 0 87.5 100
Total
60 to 74 Pre 24 48.4 19.6 0 50 75
Post 24 75.0 24.2 12.5 87.5 100
75 or+ Pre 26 59.4 24.5 0 50 100
Post 26 66.3 27.6 0 68.75 100
Total Pre 50 54.1 22.7 0 50 100
Post 50 70.5 26.1 0 87.5 100
Analysis of variance Pre x Post → p = 0.000*
Table 9. Analysis of variance and descriptive statistics for the emotional aspect according to sex and age group.
Sex Age group Period N Mean Standard
deviation Minimum Median Maximum
Female
60 to 74 Pre 11 18.2 27.3 0 0 66.6
Post 11 42.4 36.8 0 66.6 100
75 or+ Pre 12 38.9 42.2 0 33.3 100
Post 12 58.3 37.9 0 66.6 100
Total Pre 23 29.0 36.6 0 0 100
Post 23 50.7 37.4 0 66.6 100
Male
60 to 74 Pre 13 30.8 44.0 0 0 100
Post 13 61.5 35.6 0 66.6 100
75 or+ Pre 14 30.9 30.5 0 33.3 100
Post 14 52.4 40.7 0 66.6 100
Total Pre 27 30.8 36.9 0 33.3 100
Post 27 56.8 37.9 0 66.6 100
Total
60 to 74 Pre 24 25.0 37.1 0 0 100
Post 24 52.7 36.7 0 66.6 100
75 or+ Pre 26 34.6 35.9 0 33.3 100
Post 26 55.1 38.8 0 66.6 100
Total Pre 50 30.0 36.4 0 16.65 100
Post 50 54.0 37.4 0 66.6 100
Analysis of variance Pre x Post →p = 0.000* Sex x Age group →p = 0.049* Female x Age group →p = 0.050*
Table 10. Analysis of variance and descriptive statistics for the mental health aspect according to sex and age group.
Sex Age group Period N Mean Standard
deviation Minimum Median Maximum
Female
60 to 74 Pre 11 18.2 27.3 0 0 66.6
Post 11 42.4 36.8 0 66.6 100
75 or+ Pre 12 38.9 42.2 0 33.3 100
Post 12 58.3 37.9 0 66.6 100
Total Pre 23 29.0 36.6 0 0 100
Post 23 50.7 37.4 0 66.6 100
Male
60 to 74 Pre 13 30.8 44.0 0 0 100
Post 13 61.5 35.6 0 66.6 100
75 or+ Pre 14 30.9 30.5 0 33.3 100
Post 14 52.4 40.7 0 66.6 100
Total Pre 27 30.8 36.9 0 33.3 100
Post 27 56.8 37.9 0 66.6 100
Total
60 to 74 Pre 24 25.0 37.1 0 0 100
Post 24 52.7 36.7 0 66.6 100
75 or+ Pre 26 34.6 35.9 0 33.3 100
Post 26 55.1 38.8 0 66.6 100
Total Pre 50 30.0 36.4 0 16.65 100
Post 50 54.0 37.4 0 66.6 100
The mean post-intervention score in the emotio-nal scale was significantly lower compared to the pre-intervention period in the two age groups (60 to 74 years and 75 years or more). The mean decrease between the pre- and post-intervention periods was larger in elderly subjects aged 75 years or more, showing that this group perceived better their restrictions before the intervention, and therefore benefitted more from it.
The mean scores in the social/situational scale in both periods were significant; they were lower after the intervention in males and females. The mean scores in elderly male subjects were higher compared to females. Thus, the mean decrease between the pre- and post-intervention periods was significantly higher in males, who once again perceived more their restrictions to participa-tion, and therefore benefitted more after the phonological intervention.
Other studies have shown that elderly males per-ceive more their restrictions than elderly females, which is similar to our findings in the present study.11
It is thought that elderly males have a better per-ception of their restrictions because this group - culturally in our society - is often the family provider even when aged; thus, restrictions to participation are perceived as a handicap.
A few authors have found that benefits of hearing aids use may be evaluated after six months of effective use.12 For some authors, however, there were no significant
benefits from hearing aids used for less than three months; thus, short intervals between questionnaires would not show the benefits of hearing aids13.
It is thought that adaptation time could have an in-fluence on benefits; the reevaluation interval in the present study was one year, which was considered sufficient time to reapply the questionnaire.
Our findings showed that self-awareness of restric-tions to participation in elderly subjects decreases after one year of hearing aid use. Such improvement may be attributed only to hearing aid fitting, as reported in several papers. On the other hand, it is important to underline that we monitored our subjects every two months in meetings in which they were able to clear their doubts about hearing aids, receive instructions about communication strategies, and mainly generate affective bonds - a relationship of trust - with the researcher. This procedure undoubtedly influenced the positive outcome of this study.
Among the results of the SF 36 questionnaire, in which higher scores equate with better quality of life, the mean functional ability scores after the intervention were significantly higher irrespective of sex and age, compared to the pre-intervention period.
It should be pointed out that the number (N) of
elderly subjects was about half of the total N (50) when the analyses were made according to the variables sex and age group. This reduction may have contributed to the observed lack of significance.
The SF 36 questionnaire showed that the highest number of clinical correlations and statistically significant results among the data was found in the functional ability aspect7.
The mean physical aspect scores after the inter-vention were significantly higher compared to the pre-intervention scores. Our analysis showed that the activities included in the physical aspect improved significantly in the context of general data; they were not affected by the variables sex and age group. This was also observed in the functional ability aspect.
The worse scores in a study that applied the WHOQOL-bref questionnaire were found in the physical domain irrespective of sex. The authors concluded that there were no relationships between hearing loss and the quality of life of elderly subjects in their sample. They found a correlation between age and social relationships, in which more advanced age correlated with less partici-pation in social activities14.
The lowest scores in the present study were found in the physical aspect, which was associated with the ability of subjects to perform physical activities such as climbing stairs, walking, and carrying out household chores.
The results of the pain aspect revealed no differen-ces in the mean scores before and after the intervention, irrespective of sex and age group. The mean scores for the age group aged 75 years or more were significantly higher, showing that their quality of life was better compared to the 60 to 74 year age group irrespective of sex and pre- and post-intervention periods. The elderly subjects in the more advanced age group were more active; their energy and well-being were probably the result of better physical status and less pain, which could explain these findings.
The results according to age revealed that subjects at more advanced age had the best scores. According to the authors, this showed that older subjects had a better quality of life. These results also showed that the SF 36 questionnaire was an adequate tool for assessing the quality of life of retired individuals in the study15. Results
according to age are similar to our finding that subjects at more advanced age (75 years or more) had better scores, therefore better quality of life.
The mean pre- and post-intervention scores of the general health status did not differ; these results were in-dependent of sex and age group. This was expected, as elderly subjects are undergoing a natural aging process.
elderly subjects had better scores in nearly all aspects except for general health status and emotional aspect. In our study, elderly female subjects considered their health worse compared to elderly male subjects16. Our results are
similar to these findings in that elderly male subjects score better than elderly female subjects.
The vitality aspect scores were significantly higher in the post-intervention period compared to the pre-inter-vention period irrespective of sex and age group. This is evidence that effective hearing aid use helped improve the quality of life, which was evidenced as better vitality. How do we explain increased vitality associated with hearing amplification? Amplification may foster interaction and better communication, which translates into more energy for activities of daily life.
The elderly subjects performed better in the social aspect after the intervention. The mean post-intervention scores were significantly higher than before the interven-tion; this result was independent of sex. The difference in mean scores before and after the intervention was age-dependent; it was significantly higher in the 60 to 74 year age group. In the 75 year age group there were no differences in the means of both periods.
Several studies have investigated the relationship between hearing loss and quality of life by using the WHOQOL-bref self-assessment tool; the physical, psycho-logical, social and environmental relationships were asses-sed. The best scores were seen in the social relationship domain. This was a surprise for researchers, who thought that aging would be a time for social withdrawal, and that the elderly subjects presented hearing loss16. In the present
study, elderly subjects significantly improved their social aspect scores after the phonoaudiological intervention.
The mean emotional aspect scores were signifi-cantly higher after the intervention compared to the pre-intervention period irrespective of sex and age group. Our results showed that the mean score was higher in females aged 75 years or more compared to those aged 60 to 74 years; this result indicated that females are more sensitive to emotional issues. There were no age-related differences in self-awareness of quality of life among male subjects.
Effective use of hearing aids improved commu-nication, which made it possible for elderly individuals to reassume their family and social interactions, thereby improving their quality of life. The author found that the quality of life improved after hearing aids were fitted, especially in the psychological domain, which underlines the importance of hearing - and interventions on hearing - for quality of life and general health in the elderly. The results in the psychological domain improved significantly in both males and females; thus, the variable sex did not affect the results16.
The emotional aspect scored low in the present study; the worse results were seen in elderly females, indicating that these individuals were more susceptible to emotional issues.
The mean scores for the mental health aspect were significantly higher after the intervention compared to the pre-intervention period irrespective of sex and age group.
The mean scores in the post-intervention period were higher than in the pre-intervention period in six of eight aspects in the general population (total N), which shows that quality of life improved after the phonoaudio-logical intervention. Sex and age group differences were in general not seen, which may be explained by the small sample size. On the other hand, analysis of the quality of life by the SF 36 showed that this type of study is relevant for elderly subjects with hearing loss; although it did not include specific questions on communication and hearing, it was sensitive enough to identify an improvement in the quality of life because of amplification. Only two of eight aspects did not improve after one year of hearing aid use and monitoring, namely pain and general health status. This may be explained by the fact that elderly persons experience a chronic condition that gradually restricts their activities of daily life. The aspect vitality improved significantly after one year of hearing aid amplification. This improvement may be attributed to an increased will to participate in activities, as elderly individuals feel safer and become more confident simply by being able to listen and understand speech.
Because the study sample comprised elderly aging subjects with hearing loss and some degree of awareness of their restrictions, the results were both important and expected. The subjects underwent a phonoaudiological intervention - fitting hearing aids - and were monitored during one year.
In the present study, the assessment protocol con-sisted of self-assessment questionnaires; the results showed that these questionnaires adequately measured changes in quality of life and restrictions to participation in daily life. The HHIE questionnaire, which specifically evaluates hearing, has been used frequently by researchers in this area of study. We found no references in the literature about the use of the SF 36 questionnaire - which evalua-tes health in general - for assessing the quality of life of individuals with hearing loss. Thus, the results were both surprising and expected; it was possible to measure qua-lity of life improvements and a reduction in restrictions to participation because of a phonoaudiological intervention.
CONCLUSION
participation after the phonoaudiological intervention in the social and emotional scales in the HHIE questionnaire. Elderly male subjects were more self-aware of restrictions to participation in the emotional and social scales before the phonological intervention. Elderly subjects in the older age group were more self-aware about restrictions to participation in the emotional scale before the phono-audiological intervention.
The quality of life was shown to improve after the phonoaudiological intervention in the functional ability, physical ability, vitality, emotional, social, and mental health aspects of the SF36 questionnaire irrespective of sex and age.
REFERENCES
1. Russo ICP. Distúrbios da Audição: A presbiacusia. In: Russo ICP. Intervenção Fonoaudiológica na Terceira Idade. Rio de Janeiro: Ed. Revinter; 1999. p. 51-92.
2. Saúde do idoso - Organização Pan-Americana da Saúde - OPAS - acesso em outubro2009. http://new.paho.org/bra/index. php?option=com_contentetask=vieweid=279eItemid=259 3. Síntese dos Indicadores Sociais 2009 - Uma análise das
condi-ções de vida da população brasileira - Instituto Brasileiro de Geografia e Estatística - IBGE - acesso e outubro/2009 http:// www.ibge.gov.br/home/presidencia/noticias/noticia_visualiza. php?id_noticia=1476eid
4. Paschoal SM. Qualidade de vida do idoso: elaboração de um instrumento que privilegia sua opinião, Dissertação de Mestrado - Faculdade de Medicina - USP, 2001.
5. Ventry IM, Weinstein B. Identification of elderly people with hearing problems. ASHA. 1983;25(1):37-42.
6. Weiselberg MB. A autoavaliação do handicap em idosos porta-dores de deficiência auditiva o uso do HHIE, Tese de Mestrado, Pontifícia Universidade Católica SP, 1997.
7. Ciconelli RM, Ferraz MB, Santos W, Meinão I, Quaresma MR. Tradução para a língua portuguesa e validação do questionário genérico de avaliação de qualidade de vida SF 36 (Brasil SF 36). Rev Bras Reumatol. 1999;39(3):143-50.
8. Neter J, Kutner MH, Nachtsheim CJ, Li W. Applied Linear Statisti-cal Models. 5th ed, Irwin, Chicago. 2005.
9. Bucuvic EC. Iório MCM. Benefício e dificuldades auditivas: um estudo em novos usuários de prótese auditiva após dois e seis meses de uso. Rev Fono Atual. 2004;29(1):19-29.
10. Marques ACO, Kozlowski L, Marques JM. Reabilitação auditiva no idoso. Rev Bras Otorrinolaring. 2004;70(6):806-12.
11. Pizan-Faria VM, Iório MCM, Sensibilidade auditiva e autoper-cepção do handicap: um estudo em idosos. Rev Dist Comun. 2004;16(3):289-99.
12. Buzo BC,. Ubrig MT, Novaes BC. Adaptação de aparelho de amplificação sonora individual: relações entre a auto-percepção do handicap auditivo e a avaliação da percepção da fala. Rev Dist Comun. 2004;16(1):17-25.
13. Silman S, Iório MCM, Mizhahi MM, Parra VM. Próteses auditivas: um estudo sobre seu benefício na qualidade de vida de indivíduos portadores de perda auditiva neurossensorial. Disturb Comum. 2004;16(2):153-65.
14. Teixeira AR, Freitas CR, Millão LF, Gonçalves AK, Becker Junior B, Vieira AF, et al. Relação entre deficiência auditiva, idade, gênero e qualidade de vida dos idosos. Arq Int Otorrinolaring. 2008;12(1):62-70.
15. Pimenta FAP, Simil FF, Tôrres HOG, Amaral CFS, Rezende CF, Coelho TH, et al. Avaliação da qualidade de vida de aposentados com a utilização do questionário SF-36. Rev Assoc Med Bras. 2008;54(1):55-60.