Analysis of laboratory tests results of patients
submitted to a clinical screening program
Análise de resultados de exames laboratoriais de pacientes
submetidos a um programa de rastreamento clínico
Raphaela M. Zapelini1; Kaiser S. Koch1; Geraldo César C. Althoff2; Camila S. Duarte1; Eloysa M. João3; Sérgio Silveira Jr.4
1. Universidade do Sul de Santa Catarina (Unisul), Santa Catarina, Brazil. 2. Santa Casa de Misericórdia Porto Alegre, Porto Alegre, Brazil. 3. Hospital Nossa Senhora da Conceição, Santa Catarina, Brazil. 4. Universidade de São Paulo (USP), São Paulo, Brazil.
First submission on 10/06/16; last submission on 22/10/16; accepted for publication on 23/10/16; published on 20/12/16
ABSTRACT
Introduction: There are not studies demonstrating the major changes in biochemical tests performed in screening programs. Objective: Identify the results found in laboratory tests of patients submitted to medical check-up program, showing the main abnormal tests and
correlating it with the age groups in which they were performed. Method: A cross-sectional study carried out with patients undergoing
a screening service, from January to July 2015. Results: The study evaluated 738 patients. Form these, 53.3% were men and 46.7% were
women. Body mass index (BMI) > 25 kg/m2 was present in 43.4% of patients aged 18-39 years; 46% aged 40-59 years and 10.5% aged
≥ 60 years. Levels of fasting plasma glucose between 100-125 mg/dl were found in 10.2%. Decreased levels of high-density lipoprotein cholesterol (HDL-c) were observed in 14% and high triglyceride values in 12.7%. Changes in blood count were found in 12.6%, 7.7% of which with anemia. Among the patients, 39% of had an qualitative urine testing (QUT). Of which, 21.2% presented microscopic hematuria. Glutamic-pyruvic transaminase (GPT) was decreased in 22.5%. Urea was increased in 11%. Vitamin D insuficiency and deiciency was
present in 41.2% and 19.4%, respectively. Conclusion: The main biochemical tests that showed changes, in sequence, were: vitamin D;
qualitative urine testing; GPT; HDL-c; triglycerides; blood count; fasting glycemia and urea. The only tests that had the most abnormal rates in young adults, aged 18-39 years, were: parasitological examination of stool; decreased serum levels of urea and glutamic-oxaloacetic transaminase (GOT) and increased values of GPT.
Key words: diagnosis; screening; screening programs; preventive medicine; disease prevention.
INTRODUCTION
Regarding the disease screening, there are ive criteria that deine the ideal conditions for the screening of any disorder, namely: 1) disease is an important public health issue; 2) there is an asymptomatic stage; 3) there is an appropriate screening test; 4) there is a treatment available; and 5) early treatment during the asymptomatic stage improves the long-term outcome and should be more effective than the treatment of an illness diagnosed during the symptomatic phase(1).
It should be noted that several situations have been contributing to the growth of screening tests in screening programs, also known as screening or medical check-up. Among
the possible factors, we highlight the aging of the Brazilian population, leading to a higher prevalence of chronic diseases(2),
which, mostly, remain asymptomatic for a long period and, when diagnosed, come across complications. Moreover, lowering unemployment and increasing the income of citizens enables more comprehensive access to health and, thus, increases the
demand for screening programs(3).
In the United States, more than 20% of the population
is submitted annually to a periodic health assessment(4).
International organizations do not advocate the annual practice for comprehensive testing, but instead, recommend only that tests of proven preventive value should be performed in the screening programs(5, 6).
It is believed that physicians should prioritize and resolve the various preventive services available to recommend, in order
preventing harm or inappropriate interventions(7). However,
both physicians and patients, mostly, agree that annual global examinations are relevant(8, 9). In addition, they note that general
laboratory tests such as blood count, lipid proile, partial urine, blood glucose, liver and renal function, and thyroid disease should be performed as part of an annual screening(9).
Although certain biochemical tests in screening programs demonstrate proven preventive values for certain age and sex groups, it is observed that a number of complex questions remain unanswered, particularly regarding situations where a comprehensive routine examination could provide the maximum beneit. Research is critical to deining the frequency and intensity of periodic examinations required to consistently improve outcomes, as well as to demonstrate which patients could beneit most from a periodic health assessment(7, 8).
It is known that annual exams are not recommended for
the majority of younger patients(5-7). In the absence of chronic
morbidities, medical appointments and periodic examinations are suggested, every three years, in apparently healthy adult patients younger than 50 years, and annually in adults aged 50 years older(7).
This fact shows the growing concern of the population regarding healthy lifestyle, prevention and early detection of diseases. However, there are no papers that demonstrate the major changes in biochemical tests performed in medical check-up programs. Therefore, this study aims to identify the results found in laboratory tests of patients who undergo screening programs, showing the main altered/changed/abnormal tests and correlating them with the age groups in which they were performed.
METHOD
This is an observational study with a cross-sectional design, in which all patients undergoing routine laboratory exams were studied in a private medical clinic in the city of Tubarão (SC), Brazil, from January to July 2015. In the study were included all patients aged 18 years or older who spontaneously sought the screening service proposed in the above mentioned clinic. On the other hand, patients who, although enrolled in the program, did not perform any of the exams were excluded.
It should be emphasized that the screening tests are proposed according to the patient’s age and gender group, according to the protocol established by the clinic. For all age groups and
both sexes, laboratory tests for diabetes mellitus (DM) and
thyroid disorders screening were performed, as well as exams for liver function, renal function, blood count, serum uric acid measurement and lipid proile. It becomes different from the age of 30 years, which includes the partial urine and the parasitological stool examinations and, from the age of 40 years, in addition to those already mentioned, are performed the study of occult blood in the stool, the prostate-speciic antigen test in men and the measurement of B12 and D vitamins in women.
Data were collected on two occasions. First, the patients undergoing routine laboratory exams received by the clinic a monthly list, containing the following information: name, age, sex and body mass index (BMI). With the listing of the patients in hand, the researchers had access to the computerized system of the Clinical Analysis Laboratory of the Universidade do Sul de Santa Catarina, where the results of the biochemical tests were obtained. To identify the prevalence of changes in such exams, the reference values used by the above mentioned laboratory were used.
In addition, it should be noted that in the present study it was not possible to establish the diagnosis of certain diseases that require conirmatory tests, such as DM. However, the criteria established by the American Diabetes Association (ADA) were used as cut-off points to consider changes in fasting plasma
glucose (FG)(10), which included: FG levels ≥ 126 mg/dl and FG
levels between 100-25 mg/dl, which would diagnose DM and pre-diabetes, respectively, since there are conirmatory tests.
Regarding the lipid proile, the present study maintained the reference values used by the above mentioned laboratory, since
they follow the latest Brazilian guidelines for dyslipidemia(11),
despite the recent changes established by the American Heart
Association (AHA)(12), regarding the new groups of patients who
are more likely to beneit from the therapy.
In addition, to classify patients with possible chronic kidney disease (CKD), this study followed the diagnostic criteria established by the guideline of the Brazilian Nephrology Society, which considers, for this purpose, a glomerular iltration rate
(GFR) < 60 ml/min/1.73 m2 for a period equal to or longer than
three months, with or without renal damage. The Cockcroft-Gault formula, method of choice for the present study, can be used to
estimate the GFR(13). However, it should be pointed out that this
study can not state that these patients actually had CKD, since the data were collected only in a single moment, and it is not possible to monitor these indings for a period longer than three months.
for Windows v 20 Chicago, IL, USA). The quantitative variables were described by measures of central tendency and dispersion, according to the normality of the data, and the qualitative by prevalence (%) and 95% of conidence interval (CI).
The research was approved by the Research Ethics Committee, with CAAE 44192415.5.0000.5369, under opinion number 1.069.513. The reliability of the data and the conidentiality of the information were guaranteed without the identiication of the participants, respecting the ethical precepts of resolution 466/2012 of the National Health Council. The data collected were analyzed and registered in the laboratory mentioned previously, after authorization provided by the guardians responsible.
RESULTS
The present study evaluated the results of laboratory tests of 738 patients, of which 393 (53.3%) were men and 345 (46.7%), were women. The age ranged from 18 to 84 years, with a mean of 41; 360 (48.7%) patients were younger than 40 years, 311 (42.1%) were 40-59 years, and 67 (9%) aged ≥ 60 years. With regard to BMI, 13 (1.8%) patients were underweight, 249 (33.7%) were eutrophic, 293 (39.7%) were overweight, and 183 (24.8%) were obese.
In Tables 1 and 2, the prevalence of results found in
biochemical tests is observed.
Table 3 shows that the highest prevalence of changes in total
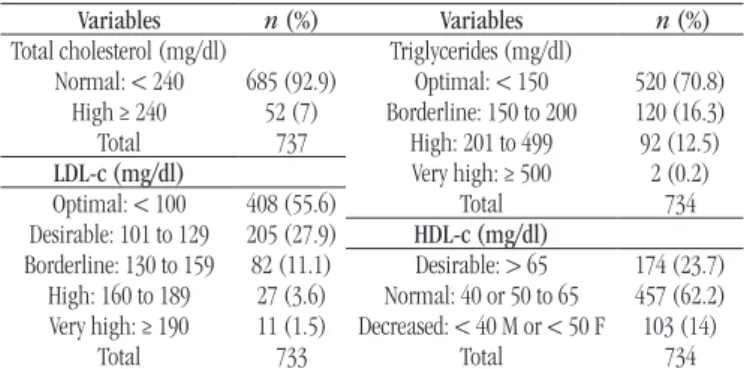
cholesterol (TC) levels and in low-density lipoprotein cholesterol (LDL-c) levels occurred in the group equal to or older than 60 years, followed by those aged 40-59 years. In contrast, abnormal levels of triglycerides (TG) and high-density lipoprotein (HDL) were identiied primarily in adult patients aged 40-59 years and 18-39 years.
In addition, it was observed that BMI ≥ 25 kg/m2 was present
in43.4% of patients aged 18-39 years (young adults); in 46% aged
40-59 years (adults); and in 10.5% of those belonging to the group aged equal to or older than 60 years (elderly).
In the analysis by age group (Table 4), it was observed that
the qualitative urine testing (QUT), including the presence of nitrite and microscopic hematuria, was mainly altered in the age group of patients equal to or older than 60 years. The abnormal FG was present in the older age group and FG as a criterion for DM (≥ 126 mg/dl), in the group 40-59 years. Moreover, with regard to the blood count, it is noticed that the changes were more frequent as the age advanced. However, anemia was more present in young adults than in those aged 40-59 years.
TABLE 1 − Prevalence of results in laboratory tests
Variables n (%) Variables n (%)
FG (mg/dl) Urea (mg/dl)
< 100 640 (87.4) Normal M: 19 to 43 and F: 15 to 36 646 (88.3) 100 to 125 75 (10.2) Decreased 4 (0.5)
≥ 126 17 (2.3) Increased 81 (11)
Total 732 Total 731
TSH (uUI/ml) GFR (mg/dl)
0.465 to 4.680 690 (94.1) Normal 726 (98.6) < 0.465 13 (1.7) Abnormal (< 60 mg/dl) 10 (1.3) > 4.680 30 (4.1) Total 736
Total 733 Uric acid (mg/dl) Blood count Normal (M: 3.5 to 8.5 and F: 2.5 to 6.2) 686 (95.1)
Normal 641 (87.3) Decreased 11 (1.5) Abnormal* 93 (12.6) Increased 25 (3.4)
Total 734 Total 722
Anemia 57 (7.7) PSA ng/ml
QUT < 4 177 (98.8)
Normal** 427 (60.9) ≥ 4 2 (1.1)
Abnormal** 274 (39) Total 179
Total 701 Vitamin B12 (pg/ml) Nitrite 13 (1.8) 239 to 931 195 (90.6) Hematuria 149 (21.2) < 239 15 (6.9)
GOT (U/l) > 931 5 (2.3)
17 to 59 693 (94) Total 215 < 17 26 (3.5) Vitamin D (ng/ml) > 59 18 (2.4) Deiciency: < 20 40 (19.4) Total 737 Insuficiency: 21 to 29 85 (41.2) GPT (U/l) Suficiency: 30 to 100 81 (39.3) 21 to 72 530 (72.1) Total 206
< 21 166 (22.5) Fecal occult blood > 72 39 (5.3) Normal 149 (90.3) Total 735 Abnormal 16 (9.7)
PES Total 165
Normal 543 (94.1) Abnormal 34 (5.9)
Total 577
*:normal or abnormal blood count regarding the presence of: leukocytosis, leukopenia,
thrombocytosis or thrombocytopenia; **: normal or abnormal QUT for the presence of: glucose, albumin, ketone bodies, bilirubin, urobilinogen, nitrite, hemoglobin or leukocyte esterase in the biochemical test; or red blood cells and white blood cells in examination of urine sediment.
FG: fasting glycemia; TSH: thyroid stimulating hormone; QUT: qualitative urine testing; GOT: glutamic-oxaloacetic transaminase; GPT: glutamic-pyruvic transaminase; PES: parasitological examination of stool; GFR: glomerular filtration rate; PSA: prostate specific antigen; M: male; F: female.
TABLE 2 − Prevalence of results according to lipid proile
Variables n (%) Variables n (%) Total cholesterol (mg/dl) Triglycerides (mg/dl)
Normal: < 240 685 (92.9) Optimal: < 150 520 (70.8) High ≥ 240 52 (7) Borderline: 150 to 200 120 (16.3) Total 737 High: 201 to 499 92 (12.5) LDL-c (mg/dl) Very high: ≥ 500 2 (0.2) Optimal: < 100 408 (55.6) Total 734 Desirable: 101 to 129 205 (27.9) HDL-c (mg/dl) Borderline: 130 to 159 82 (11.1) Desirable: > 65 174 (23.7)
High: 160 to 189 27 (3.6) Normal: 40 or 50 to 65 457 (62.2) Very high: ≥ 190 11 (1.5) Decreased: < 40 M or < 50 F 103 (14)
Total 733 Total 734
TABLE 4 − Frequency of changes in laboratory tests in age groups
Age (years) Variables n (%) Age (years) Variables n (%)
QUT PES
Abnormal** Nitrite+ Hematuria Abnormal
30-39 125 (37.2) 3 (0.8) 62 (18.4) 18-39 17 (6.2) 40-59 117 (38.8) 5 (1.6) 71 (23.5) 40-59 15 (6)
≥ 60 32 (50) 5 (7.8) 16 (25) ≥ 60 2 (3.6)
FG (mg/dl) Urea (mg/dl)
100 a 125 ≥ 126 Decreased Increased 18-39 10 (2.7) 3 (0.8) 18-39 4 (1.1) 23 (6.4) 40-59 44 (14.3) 12 (3.9) 40-59 0 (0) 40 (12.9) ≥ 60 21 (31.8) 2 (3) ≥ 60 0 (0) 18 (27.6)
TSH Uric acid (mg/dl)
< 0.465 (uUI/ml) > 4.680 Decreased Increased 18-39 8 (2.2) 9 (2.5) 18-39 6 (1.6) 9 (2.5) 40-59 3 (0.9) 19 (6.1) 40-59 3 (1) 14 (4.6)
≥ 60 2 (2.9) 2 (2.9) ≥ 60 2 (3) 2 (3) Blood count Vitamin B12 (pg/ml)
Abnormal* Anemia Def.: < 239
18-39 43 (11.9) 29 (8) 18-39 0 40-59 39 (12.6) 21 (6.7) 40-59 11 (7.4)
≥ 60 11 (16.6) 7 (10.6) ≥ 60 4 (6.3) GOT (U/l) Vitamin D (ng/ml) < 17 > 59 Def: < 20 Insuf: 21 to 29 18-39 17 (4.7) 7 (1.9) 18-39 0 0 40-59 6 (1.9) 10 (3.2) 40-59 23 (16.6) 60 (43.4)
≥ 60 3 (4.5) 1 (1.5) ≥ 60 14 (22.5) 24 (38.7)
GPT (U/l) FOB
< 21 > 72 Abnormal
18-39 84 (23.3) 22 (6.1) 18-39 0 (0) 40-59 63 (20.4) 17 (5.5) 40-59 11 (10)
≥ 60 19 (28.4) 0 (0) ≥ 60 5 (9.2)
*: normal or abnormal blood count regarding the presence of: leukocytosis, leukopenia,
thrombocytosis or thrombocytopenia; **: normal or abnormal QUT for the presence of: glucose, albumin, ketone bodies, bilirubin, urobilinogen, nitrite, hemoglobin or leukocyte esterase in the biochemical test; or red blood cells and white blood cells in examination of urine sediment.
QUT: qualitative urine testing; PES: parasitological examination of stool; FG: fasting glycemia; TSH: thyroid stimulating hormone; GOT: glutamic-oxaloacetic transaminase; GPT: glutamic-pyruvic transaminase; Def: deficiency; Insuf: insufficiency; FOB: fecal occult blood.
TABLE 3 − Frequency of changes in lipid proile in age groups
Age (years) Variables
Total cholesterol ≥ 240 mg/dl
LDL ≥ 160 mg/dl
HDL < 40 mg/dl
Triglycerides ≥ 200 mg/dl 18-39 11 (3.1%) 6 (1.6%) 51 (14.2%) 42 (11.6%) 40-59 33 (10.6%) 21 (6.7%) 48 (15.4%) 45 (14.5%) ≥ 60 8 (11.9%) 11 (16.4%) 4 (6%) 7 (10.4%)
LDL: low-density lipoprotein; HDL: high-density lipoprotein.
DISCUSSION
Despite the growing demand for medical check-up services(4),
this research did not ind literature that discusses the proile of patients seeking such programs, as well as the results identiied in
the set of laboratory tests performed in these services. Therefore, the indings observed in the present study were compared with other studies that sought the prevalence of abnormalities in biochemical tests singly performed.
Regarding the proile of patients in this study, it was observed that the majority was men (53.3%), showing that there is a greater concern by males to prevent possible diseases or to detect them early. In addition, the majority (48.7%) were younger than 40 years, followed by the age group 40-59 years (42.1%). The lowest demand was for patients ≥ 60 years (9%). Therefore, it is observed that young adults have been more aware to preventive medicine programs.
With regard to obesity, it is noteworthy that from 1999 to 2014 its prevalence increased among adults and young people, and therefore, it is important to monitor it in public health programs
that focus on reducing or preventing overweight(14). The US
Preventive Services Task Force (USPSTF)(15) and the American
Academy of Family Physicians(16) recommend screening all adults
for obesity in routine medical visits.
The prevalence of obesity in this study (24.8%) is below the average estimated in the United States, since in that country it was slightly more than 36% during the period from 2011 to 2014, and was greater, in general, among adults aged 40-59 (40.2%) and elderly aged 60 years or older (37%)(14). In this study, the BMI
≥ 25 kg/m2 was present mainly in the group aged 40-59 (46%) and
in young adults aged 18-39 years (43.4%).
With regard to the presence of anemia, in a normal population, it would be expected that 2.5% of the individuals had decreased hemoglobin levels. Thus, iron deiciency anemia would be considered a health issue when the prevalence exceeded 5% of the population(17). In this research it was not possible to identify the
causes of anemia, although iron deiciency is the most common nutritional disorder worldwide(17, 18). However, it is still observed
that the prevalence of decreased hemoglobin concentration of 7.7% exceeds that expected for a normal population.
It was also observed that anemia was present mainly in the elderly group (10.6%), followed by patients aged 18-39 years (8%). In this age group of younger patients, this result may be considered relevant, since it is assumed that the participants of this study, in general, have better inancial conditions and, consequently, better eating habits and more access to health programs.
Abnormal biochemical and liver function tests are often detected in asymptomatic patients, since the screening programs
include them routinely(19). A survey conducted in the United
of patients had glutamic-pyruvic transaminase (GPT) values
above normality(20). In this study, the prevalence was 5.3% and
was present mainly in the age group of 18-39 years. This work did not ind literature that correlates the GPT levels with age, requiring further revisions to elucidate this issue.
Currently, there are few studies on the prevalence of
microscopic hematuria(21), which is becoming more frequent in
the routine exams(22). Malignancies are detected in up to 5% of
patients(23). In an adult population, a variation in the prevalence
of microscopic hematuria was estimated from 0.5%-22%(24).
Other studies showed a greater difference, around 2%-31%(25-27).
In this study, the prevalence was 21.2%, corroborating the literature data. It was also veriied that the greater the age groups of the participants, the greater the prevalence of microscopic hematuria. However, this study did not ind bibliographies correlating this inding with age.
In a study that used data from routine examinations of patients aged 40-74 years, a prevalence of 20.5% CKD was
found, which increased with age(28). In other studies, there was
a variation from 8.3%-19.2%(29-31). Compared with this study, the
prevalence of CKD was very small. In addition, this inding was observed only in patients aged ≥ 60 years.
The studies previously mentioned deined as patients with
CKD those who had GFR < 60 ml/min/1.73 m2 for this purpose,
as calculation of choice, was used the Modiication of Diet in Renal Disease study equation. Thus, the discrepancies seen between the studies above mentioned may be explained by the different equations for GFR estimation used with the number of people examined and the differences in the population, including race and age, since the majority of patients in this study were younger than 40 years.
With regard to vitamin D deiciency screening, the USPSTF(32)
and the American Academy of Family Physicians(33) concluded
that current evidence is insuficient to assess the balance between beneits and risks in asymptomatic adults. According to data from the National Health and Nutrition Examination Survey (NHANES), in the general population of the United States, 33% identiied vitamin D levels ≤ 20 ng/ml(34), and in 77%,
< 30 ng/ml(35). In this research, there was a lower prevalence
of deicits. In addition, we observed that vitamin deiciency was more prevalent in women aged 40-59 years (43.4%) than in the elderly group (38.7%). In addition, regarding the thyroid dysfunctions, the USPSTF concluded that, at present, there is insuficient evidence to show the balance between the beneits
and risks of screening in asymptomatic adults(36). There are
no studies that directly assess the effects of screening for
thyroid dysfunction on morbidity or mortality in the general
population(37, 38). Although there are no exact estimates in the
United States, it seems that screening for thyroid dysfunction by
primary care providers is a common practice(39).
About 5% of women and 3% of men in the United States have subclinical hypothyroidism(40). In the present study, very similar
results are observed, since TSH levels were found increased in 4.6% of the women and 3.5% of the men. Subclinical hyperthyroidism is present in about 0.7% of the United States
population(40). In this study, the TSH levels were decreased in
1.7% of patients.
With regard to DM, type 2 affects about 8% of the US
population, and 2%-3.2% of the cases are undiagnosed(41, 42).
World prevalence is estimated at 6.4% in adults, ranging from 3.8%-10.2% per region; the rates of undetected diabetes may
be as high as 50% in some areas(43). A study using NHANES
data(44) found a prevalence of 9.3% of DM in the United States,
where 2.8% were undiagnosed. An additional 26% of the studied population had alteration in fasting plasma glucose. The present study corroborates these indings, since a probable undiagnosed DM was observed in 2.3% of the patients. However, with regard to pre-diabetes, there was a lower prevalence of abnormal in FG.
Furthermore, in the current research, pre-diabetes was more present in the elderly (31.8%), followed by adults aged 40-59 years (14.3%). In the latter group, a greater prevalence of FG ≥ 126 mg/dl was observed among all age groups, which may be justiied by the size of the sample studied and the questions related to the test, such as patient’s proper fasting. These data show the importance of DM screening the older the patients are(10, 44, 45).
Regarding the lipid disorders, the USPSTF(46) stablishes that
in young adults who do not have an increased risk of coronary artery disease, there are no pros or cons to routine screening. In 2002, the National cholesterol Education Program published guidelines [Adult Treatment Panel III (ATP III)], in which screening for dyslipidemia is recommended for all men and
all women older than 20 years(47). Both the USPSTF(46) and
the ATP III(47) guidelines recommend usingTC and HDL levels
at the initial screening for lipid disorders. ATP III(47) further
recommends that the measurement of TG should be part of the initial screening panel.
Based on data from NHANES III, in the general population of the United States, during 2011 to 2014, 12.1% of adults had
high TC and 18.5%, had low HDL(48). In the present study, the
Also in the NHANES III, study, the percentage of patients with high TC was lower for adults aged 20-39 years (7.5%)
and higher for adults aged 40-59 years (16%)(48). In this study,
it was observed that the percentage was also lower in the age group 18-39 years (3.1%), but was higher especially in patients older than 60 years (11.9%). Regarding the HDL, NHANES III identiied that the percentage of its low levels was lower among those aged 60 years of age or older (15.3%) than among those
aged 20-39 (19.5%) or 40-59 (19.8%)(48). Similar results were
found in the present study.
In the United States about one quarter of adults aged 20 years or older had higher triglyceride levels. The trend for the decrease was observed in the percentage of adults with higher TG, from 33.3% in the period between 2001 and 2004 to 25.1% in 2009 and 2012(49). The prevalence was lowest in this study.
Finally, it is mentioned as limitations of this research to those inherent in the study design and those related to selection biases, since it is not possible to assume that the entire study population was asymptomatic, once such information was not collected directly from the participants.
CONCLUSION
The main biochemical tests performed in screening programs that showed changes were, in sequence, the following: vitamin D (60.6%); partial examination of urine (39%); GPT (27.8%); HDL-c (14%); TG (12.7%); blood count (12.6%); fasting plasma glucose (12.5%); and ureia (11.5%). From these, the most frequent indings were: vitamin D insuficiency (41.2%); decreased GPT values (22.5%); microscopic hematuria (21.2%); vitamin D deiciency (19.4%); decreased HDL-c levels (14%); high levels of TG (12.7%); high levels of urea (11%); fasting glucose levels between 100-125 mg/dl (10.2%); and anemia (7.7%).
In the analysis by age group, it was possible to verify that the laboratory tests that presented the highest prevalence of alteration in adults equal to or older than 60 years were: blood count; TC; LDL-c; partial examination of urine; fasting plasma glucose levels between 100 and 125 mg/dl; high serum urea levels; decreased TSH and uric acid values; vitamin D deiciency; and decreased GPT levels. The only exams that were altered mainly in young adults, aged between 18-39 years, were: parasitological examination of stool; decreased serum levels of urea and GOT; and increased GPT values.
RESUMO
Introdução: Não há trabalhos que demonstrem quais as principais alterações de exames bioquímicos empreendidos em programas
de check-up. Objetivo: Identificar os resultados encontrados em exames laboratoriais de pacientes submetidos a um programa de rastreamento, demonstrando os principais exames alterados e correlacionando-os com as faixas etárias em que foram realizados.
Método: Estudo transversal efetuado com pacientes submetidos a um serviço de screening entre janeiro e julho de 2015. Resultados:
O estudo avaliou 738 pacientes. Destes, 53,3% eram homens e 46,7%, mulheres. O índice de massa corporal (IMC) > 25 kg/m2
esteve presente em 43,4% dos pacientes com 18 a 39 anos, em 46% com 40 a 59 anos e em 10,5% com idade ≥ 60 anos. Níveis de glicose plasmática de jejum entre 100 e 125 mg/dl foram evidenciados em 10,2%. Níveis diminuídos de colesterol da lipoproteína de alta densidade (HDL-c) foram observados em 14% e valores elevados de triglicerídeos, em 12,7%. Alteração no hemograma foi encontrada em 12,6%, sendo 7,7% com anemia. Dos pacientes, 39% tinham um exame qualitativo de urina (EQU) alterado. Destes, 21,2% apresentaram hematúria microscópica. Transaminase glutâmico pirúvica (TGP) esteve diminuída em 22,5%. A ureia esteve elevada em 11%. Insuficiência e deficiência de vitamina D estiveram presentes em 41,2% e 19,4%, respectivamente.
Conclusão: Os principais exames bioquímicos que apresentaram alterações, em sequência, foram: vitamina D, exame parcial
de urina, TGP, HDL-c, triglicerídeos, hemograma, glicemia de jejum e ureia. Os únicos exames que tiveram taxas mais alteradas nos adultos jovens com idade entre 18 e 39 anos foram: exame parasitológico de fezes, níveis séricos diminuídos de ureia e de transaminase glutâmico oxalacética (TGO) e valores aumentados de TGP.
REFERENCES
1. Wilson JM, Junger G. Principles and practice of screening for disease. World Health Organ Tech Rep Ser. 1968; (34).
2. São Paulo (Estado). Instituto de saúde suplementar. Guia da saúde suplementar. São Paulo; 2014. Available at: http://www.iess.org.br/guia_ iess_tela.pdf. [Accessed in: Oct 2014].
3. Campana GA, Oplustil CP, Faro LB. Tendências em medicina laboratorial. J Bras Patol. 2011; 47(4): 399-408.
4. Mehrotra A, Zaslavsky AM, Ayanian JZ. Preventive health examinations and preventive gynecological examinations in the U.S. Arch Intern Med. 2007; 167(17): 1876-83.
5. Canadian Task Force on the Periodic Health Examination. The periodic health examination. Can Med Assoc J. 1979; 121(9): 1193-1254. 6. U.S preventive services task force. Guide to clinical preventive services: report of the preventive services task force. Intern Med Pub; 2002. 7. Harris R, Fletcher RH, Park L. Overview of preventive medicine in adults. Up to Date. 2014.
8 Boulware LE, Barnes GJ, Wilson RF, et al. Value of the periodic health evaluation. Evid Rep Technol Assess. 2006; 136: 1-134.
9. Prochazka AV, Lundahl K, Pearson W, Oboler SK, Anderson RJ. Support of evidence-based guidelines for the annual physical examination: a survey of primary care providers. Arch Intern Med. 2005; 165(12): 1347-52. 10. American Diabetes Association. Standards of medical care in diabetes. Diabetes Care. 2016; 39(1): 1-106.
11. Xavier HT, Izar MC, Faria Neto JR, et al. V diretriz brasileira de dislipidemias e prevenção da aterosclerose. Arq Bras Cardiol. 2013; 101(1): 1-20.
12. Stone NJ, Jennifer GR, Alice HL, et al. Guideline on the treatment of blood cholesterol to reduce atherosclerotic cardiovascular risk in adults. J Am Coll Cardiol. 2014; 63: 2889-2934.
13. Kirsztajn GM, Souza E, Romão Jr JE, Bastos MG, Meyer F, Andrada NC. Doença renal crônica (pré-terapia renal substitutiva): diagnóstico. J Bras Nefrol. 2011. Available at: http://www.projetodiretrizes.org.br/ substuicao10/doenca_renal_cronica_pre_terapia_renal_substitutiva_ diagnostico.pdf. [Accessed in: Oct 2015].
14. Cynthia LO, Margaret DC, Cheryl DF, Katherine MF. Prevalence of obesity among adults and youth: United States, 2011-2014. National Center Health Statistics. 2015; 219. Available at: http://www.cdc.gov/nchs/ products/databriefs/db219.htm. [Accessed in: Jan 2016].
15. U.S. preventive services task force. Final recommendation statement: obesity in adults: screening and management. U.S. Preventive Services Task Force; 2012. Available at: http://www.uspreventiveservicestaskforce. org/Page/Document/RecommendationStatementFinal/obesity-in-adults-screening-and-management. [Accessed in: Jan 2016].
16. Mckinney L, Skolnik N, Chrusch A, et al. Diagnosis and management of obesity. American Academy of Family Physicians; 2013. Available at: http://www.aafp.org/dam/AAFP/documents/patient_care/itness/obesity-diagnosis-management.pdf. [Accessed in: Jan 2016].
17. World Health Organization. Iron deiciency anemia: assessment, prevention and control. World Health Organ Tech Rep Ser. 2001. Available
at: http://www.who.int/nutrition/publications/en/ida_assessment_ prevention_control.pdf. [Accessed in: Jan 2016].
18. Scholl TO, Hediger ML. Anemia and iron-deiciency anemia: compilation of data on pregnancy outcome. Am J Clin Nutr. 1994; 59(2): 492-500. 19. Pratt DS, Kaplan MM. Evaluation of abnormal liver-enzyme results in asymptomatic patients. N Engl J Med. 2000; 342: 1266.
20. Friedman LS, Chopra S, Travis AC. Approach to the patient with abnormal liver biochemical and function tests. Up to Date. 2014. 21. Cohen RA, Brown RS. Microscopic hematúria. N Engl J Med. 2003; 348: 2330-8.
22. Vasconcellos LS, Penido MGM, Vidigal PG. Importância do dismorismo eritrocitário na investigação da origem da hematúria: revisão da literatura. J Bras Patol. 2005; 41(2): 83-94.
23. Khadra MH, Pickard RS, Charlton M, Powell PH, Neal DE. A prospective analysis of 1.930 patients with hematúria to evaluate current diagnostic practice. J Urol. 2000; 163(2): 524-7.
24. Bastos MG, Martins GA. Diagnóstico diferencial na hematúria. J Bras Nefrol. 1998; 20: 425-40.
25. Davis R, Jones JS, Barocas DA, et al. Diagnosis, evaluation and follow-up of asymptomatic microhematuria in adults: AUA guideline. Am Urol Assoc Educ Res. 2012; 1-30.
26. Topham PS, Jethwac A, Watkinsc M, Reesb Y, Feehallya J. The value of urine screening in a young adult population. Fam Pract. 2004; 21(1): 18-21.
27. Yamagata K, Takahashi H, Tomida C, Yamagata Y, Koyama A. Prognosis of asymptomatic hematuria and/or proteinuria in men. High prevalence of IgA nephropathy among proteinuric patients found in mass screening. Nephron. 2002; 91(1): 34-42.
28. Ohno Y, Ishimura E, Naganuma T. Prevalence of and factors associated with chronic kidney disease in Japanese subjects without notable chronic diseases, undergoing an annual health checkup. Kidney Blood Press Res. 2012; 36(1): 139-48.
29. Coresh J, Selvin E, Stevens LA, et al. Prevalence of chronic kidney disease in the united states. Jama. 2007; 298: 2038-47.
30. Imai E, Horio M, Watanabe T, et al. Prevalence of chronic kidney disease in the japanese general population. Clin Exp Nephrol. 2009; 13(6): 621-30.
31. Kim S, Lim CS, Han DC, et al. The prevalence of chronic kidney disease and the associated factors to ckd in urban korea: a population-based cross-sectional epidemiologic study. J Korean Med Sci. 2009; 24(1): 11-21. 32. U.S. preventive services task force. Final recommendation statement: vitamin D deiciency: screening. U.S. Preventive Services Task Force; 2015. Available at: http://www.uspreventiveservicestaskforce.org/Page/ Document/RecommendationStatementFinal/vitamin-d-deficiency-screening. [Accessed in: Jan 2016].
33. American Academy of Family Physicians. Recommendations by type: clinical preventive services. American Academy of Family Physicians; 2014. Available at: http://www.aafp.org/patient-care/browse/all-recommendations-type.html. [Accessed in: Feb 2016].
35. Ginde AA, Liu MC, Camargo CA. Demographic differences and trends of vitamin D insuficiency in the US population, 1988-2004. Arch Intern Med. 2009; 169: 626-32.
36. U.S. preventive services task force. Final recommendation statement: thyroid dysfunction: screening. Ann Intern Med. 2015; 162(9): 641-50. 37. Ross DS, Cooper DS, Mulder JEl. Diagnosis of and screening for hypothyroidism in nonpregnant adults. Up to Date. 2014.
38. Rugge JB, Bougatsos C, Chou R. Screening and treatment of thyroid dysfunction: an evidence review for the U.S. preventive services task force. Ann Intern Med. 2015; 162: 35-45.
39. Meyerovitch J, Rotman-Pikielny P, Sherf M, et al. Serum thyrotropin measurements in the community: five-year follow-up in a large network of primary care physicians. Arch Intern Med. 2007; 167(14):1533-8.
40. Hollowell JG, Staehling NW, Flanders WD, et al. Serum TSH, T(4) and thyroid antibodies in the United States population (1988 to 1994): National Health and Nutrition Examination Survey (NHANES III). J Clin Endocrinol Metab. 2002; 87: 489-99.
41. American Diabetes Association. Diagnosis and classiication of diabetes mellitus. Diabetes Care. 2014; 37(1): 81-90.
42. Cowie CC, Rust KF, Ford ES, et al. Full accounting of diabetes and pre-diabetes in the U.S. population in 1988-1994 and 2005-2006. Diabetes Care. 2009; 32(2):287-94.
43. Yang W, Lu J, Weng J, et al. Prevalence of diabetes among men and women in China. N Engl J Med. 2010; 362(12): 1090-101.
44. Cowie CC, Rust KF, Byrd-Holt DD, et al. Prevalence of diabetes and impaired fasting glucose in adults in the U.S. population: National Health And Nutrition Examination Survey 1999-2002. Diabetes Care. 2006; 29(6): 1263-8.
45. U.S. preventive services task force. Abnormal blood glucose and type 2 diabetes mellitus: screening. Ann Intern Med; 2015.
46. U.S. preventive services task force. Screening for dyslipidemia in younger adults: systematic review to update the 2008 U.S. preventive services task force recommendation. Agency for Healthcare Research and Quality; 2015: 138.
47. Grundy SM, Cleeman JI, Merz CN, et al. Implications of Recent Clinical Trials for the National Cholesterol Education Program Adult Treatment Panel III Guidelines. Circulation. 2004; 110(2): 227-39.
48. Carroll MD, Fryar CD, Kit BK. Total and high-density lipoprotein cholesterol in adults: United States, 2011-2014. NCHS Data Brief. 2015; 226. Available at: http://www.cdc.gov/nchs/products/databriefs/db226. htm. [Accessed in: Jan 2016].
49. Carroll MD, Kit BK, Lacher DA. Trends in elevated triglyceride in adults: United States, 2001-2012. NCHS Data Brief. 2015; 198.
CORRESPONDING AUTHOR
Raphaela Mazon Zapelini