Optimizing Harvest Dates in
Philippine Commercial Poultry Farming
Adonis R. Cagape, Jesusa M. Villanueva, Marionne Jessa Y. Mejares, Ma. Criselda S. Reyes
Abstract—This paper examined how the cleaning period in commercial and contract poultry raising can be improved such that the poultry collected at the end of the growing cycle can be sold at a higher market price. A dynamic programming model was formulated that is able to alter the dates of the harvest and position them to periods with high market price for poultry. The recommended plan improved total profit for the studied case in the Philippines by about 20.92%.
Index Terms— dynamic programming, poultry farming, workforce sizing
I. INTRODUCTION
Poultry farming is defined as raising poultry animals, such as chickens, turkeys, ducks, geese, commercially or domestically for the purpose of farming meat or eggs for consumption [1]. The term “poultry” refers to a category of domesticated birds typically bred for the purpose of collecting their eggs, meat or feathers. Several techniques in poultry farming are being practiced depending on breed, farm size, season, among many other factors.
Villanueva Poultry Farm located in San Ildefonso, Bulacan in the country of the Philippines uses
Manuscript received January 9, 2009.
A. R. Cagape is an instructor of the University of the Philippines Diliman. He holds a B.S. Industrial Engineering degree and M.S. Industrial Engineering degree with specialization in operations research from the University of the Philippines Diliman. His research areas include network modeling, statistical analysis, production planning and heuristics. (Address: MH 404 IE/OR Department, College of Engineering, University of the Philippines Diliman, Quezon City 1101 Philippines; Phone No: (63) 918-6967973; E-mail: [email protected]).
J. M. Villanueva is completing her B. S. Industrial Engineering degree at the University of the Philippines Diliman. Her fields of interest include operations research and ergonomics. She is currently working on a research on multiproduct newsvendor models. (Email: [email protected]).
M. J. Y. Mejares is a B. S. Industrial Engineering student of the University of the Philippines Diliman. Her research area is operations research and management. She is currently working on researches involving single-period inventory models. (Email: [email protected]).
M. C. S. Reyes holds a Bachelor’s Degree in Industrial Engineering from the University of the Philippines Diliman. She works as a Territory Manager of Manila Water Company, Inc. She is interested in research regarding efficiency improvement strategies and work scheduling. (Email: [email protected])
commercial growing and contract growing techniques in raising poultry, particularly, chickens. These techniques are somewhat similar in procedure and are common in farms aiming to collect volumes of poultry products. Chickens are housed in a special temperature-controlled building where they are raised, fed and given medications to avoid contracting diseases and promote gains in weight. The difference between these two techniques is in the acquisition of the chicks to be raised. In commercial growing, the farm takes care of the acquisition of the chicks to be raised, and usually all of the feeds, and the medicines to be given, and later on, of finding the buyers of its poultry; in contract growing, all of these are provided for by an integrator, commonly large poultry companies.
Growing cycle starts from the delivery of the chicks to the farm up to the harvesting day. The time required to raise the chicks until they are ready to be harvested is approximately constant at 42 days for every growing cycle, based on historical data. When ready to be harvested (usually, when the chickens reach a live weight base of 1.5 kilograms), the integrator collects the chickens and immediately moves them to their dressing and processing plants and labeled and sold later as their own products. The sole buyer in contract growing is the integrator. In this case, profit is only dependent on the average weight of the chicken and not on the state of the market. The grower’s fee to be received by the farm depends on the scheme agreed upon with the integrator. Contract growing has an advantage during lean seasons (when prices are also low) but a disadvantage during peak seasons (when prices are also high) due to the fixed grower’s fee per chicken. Costs shouldered by the raiser in contract growing include building rent, and other operational expenses such as electricity, water consumption, and labor.
The Villanueva Poultry Farm (later on referred to as the “Farm”) uses both commercial and contract growing procedures to take advantage of the price stability under contract growing and the price increases under commercial growing at the same time. The same feeding specifications and supplement schedules are followed for both commercial growing and for contract growing. Market prices of poultry can differ substantially per period within the year. While selling during a period with high market price is desired, the farm sells during the period when the harvest falls to immediately start the next growing period. In the case presented in this paper, both techniques are considered in the cost evaluation.
II. STATEMENT OF THE PROBLEM
The growing and cleaning cycles repeat successively several times in a year, with the harvest occurring at the immediately after the growing period has ended. Because of the fluctuations in the market selling price of chicken under commercial growing, a poultry raiser always runs the risk of achieving lower profit when harvest falls during the period with low market price. Since the growing period cannot be altered at this point, this paper examines how the cleaning cycle can be improved (shortened or lengthened) such that the harvest by the end of the growing cycle falls in a high price period.
III. OBJECTIVES OF THE STUDY
This paper aims to draw a schedule for the cleaning period which can move the growing cycles backward or forward within the year, thus altering the date of the harvest period at the end of each cycle. The constructed schedule shall give optimum profitability for the farm.
IV. ASSUMPTIONS
For this paper, the following assumptions were made: 1. The growing cycle is assumed to be constant at 42
days.
2. Workers share the same amount of work during the cleaning period. Furthermore, the share of work of each worker is proportional to the number of workers during the cycle.
3. Each worker must be individual equipped with machines.
V. MODEL FORMULATION
A. Determination of Relevant Parameters and Variables
The following cash flows were determined relevant in the farm throughout the growing-cleaning cycles for both
commercial and contract growing. Data gathered from the most recent cycle of the farm were used.
RT = Revenues from Contract Growing
RM = Revenues from Commercial Growing
CT = Costs incurred in Commercial Growing only
CM = Costs incurred in Contract Growing only
CTM = Costs incurred in both Commercial and Contract
Growing
Hence, total profit can be computed as
TM M T M T
r R R C C C
P = + − − − (1)
Each of these revenues and costs terms were evaluated for the case of Villanueva Poultry Farm and the figures presented are in Philippine Peso (PhP) currency. Obtaining the expressions for each parameter in (1) are illustrated in the succeeding sections.
B. Revenues from Contract Growing
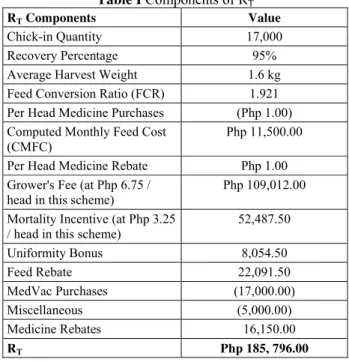
It is important to note that revenues from Contract Growing depend on the agreement or scheme established by the integrator and the farm. The components common in the revenues of Villanueva Poultry Farm from contract growing are given in Table I.
Table I Components of RT
RT Components Value
Chick-in Quantity 17,000
Recovery Percentage 95%
Average Harvest Weight 1.6 kg
Feed Conversion Ratio (FCR) 1.921 Per Head Medicine Purchases (Php 1.00) Computed Monthly Feed Cost
(CMFC)
Php 11,500.00
Per Head Medicine Rebate Php 1.00 Grower's Fee (at Php 6.75 /
head in this scheme)
Php 109,012.00
Mortality Incentive (at Php 3.25 / head in this scheme)
52,487.50
Uniformity Bonus 8,054.50
Feed Rebate 22,091.50
MedVac Purchases (17,000.00)
Miscellaneous (5,000.00) Medicine Rebates 16,150.00
RT Php 185, 796.00
C. Revenues from Commercial Growing
Table II Components of RM
RM Components Value
Chick-in Quantity 5,000
Recovery Percentage 95%
Average Harvest Weight 1.6 kg
Define Pi as the market price of chicken harvested from
growing cycle i. Total revenues from commercial growing can then be computed as follows:
(
) (
)
(
)
iT
P R
× ×
× =
ight harvest we Average
percentage Recovery
quantity in -Chick
(2)
i i
T P P
R =5000×0.95×1.6× =7600× (3) Using the average farm gate price data from 1978 to
2006 acquired from the Bureau of Animal Industry in the Philippines [7], the forecast poultry prices for 2008 in Philippine pesos are given in Table III.
Table III Forecast Prices in PhP for 2008
Month Calendar Day Pi
January 1 – 31 67.97
February 32 – 59 63.25
March 60 – 90 60.09
April 91 – 120 65.10
May 121 – 151 72.60
June 152 – 181 70.34
July 182 – 212 71.03
August 213 – 243 67.92
September 244 – 273 64.72
October 274 – 304 65.30
November 305 – 334 65.40
December 335 – 365 71.31
D. Costs from Contract Growing
While the integrator supplies the chicks and feeds under contract growing, no costs are incurred by the farm in contract growing.
E. Costs from Commercial Growing
The costs incurred in commercial growing only (per grow) are given in Table IV.
Table IV Components of CM
CM Components Value
Chick Purchases (5000 *PhP 25.00)
PhP 125,000.00
Feed Purchases (60 *5 * PhP 930.00)
279,000.00
CM Components Value
Chick Purchases (5000 *PhP 25.00)
PhP 125,000.00
Feed Purchases (60 *5 * PhP 930.00)
279,000.00
MedVac Purchases 5,000.00
CM PhP 409,000.00
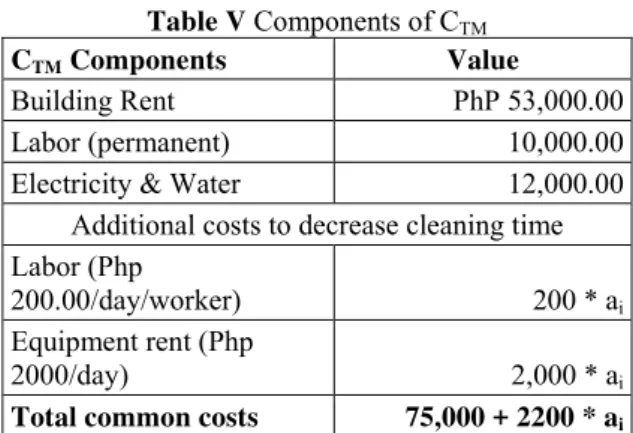
F. Common Costs
The costs common to both commercial and contract growing are building rent, permanent labor, electricity and water, and the costs to decrease cleaning time per grow.
Define ai is the the number of additional workers hired
(equal to the number of additional equipment rented)
Table V Components of CTM
CTM Components Value
Building Rent PhP 53,000.00 Labor (permanent) 10,000.00 Electricity & Water 12,000.00
Additional costs to decrease cleaning time Labor (Php
200.00/day/worker) 200 * ai
Equipment rent (Php
2000/day) 2,000 * ai
Total common costs 75,000 + 2200 * ai
At present, two workers (each with separate piece of equipment) are hired to clean and prepare the farm for the next batch of chicks to be raised in-house. The figures in Table VI were computed as the number of days required to clean the site for every additional worker hired (an additional piece of equipment has to be rented for every additional worker hired).
Table VI Computed Length of Cleaning Cycle
Number of additional machines/workers
Number of days required to clean the site
0 14 1 10 2 7 3 6 4 5 5 4
calendar day) to give time for the year-end business activities of the farm.
G. Profit from Growing Cycle
Table VII Summary of Cashflows
RT PhP 185,796.00
RM 7600 Pi
CT 0
CM (409,000.00)
CTM (75,000 + 2,200ai)
Given the cash flows in the preceding sections, summarized in Table VII, the total profit for a given growing cycle is expressed in (4) as a function of Pi and
ai using (1).
298204 2200
7600
Pri = Pi− ai− (4)
VI. THE DYNAMIC PROGRAMMING MODEL Determining the optimal schedule requires optimizing (4) obtained in section V. Since the duration of the cleaning cycle dictates the harvest date and therefore Pi,
while this duration is dependent on ai, optimizing Pri is
not an easy task. To optimize Pri, a dynamic
programming (DP) model was formulated
The components of the DP model were defined as follows:
1. Stage i represented the ith growing cycle within the year (i = 1, 2, …, 6)
2. The alternatives, xi were the number of workers
hired (or machines rented) at the end of the ith growing cycle
3. The states are the number of workers hired (or machines rented) at the end of the (i+1)th growing cycle
The recursive function for the dynamic programming model was formulated as follows:
7600 * Pi – 298204 -
( 2,200 *┌ 28 / (xi + 2) ┐* xi )
for i = 6 fi(xi) = 7600 * Pi – 298204 -
( 2,200 *┌ 28 / (xi + 2) ┐* xi ) +
fi+1(xi+1)
for i < 6
(5)
The term ai was defined as equal to ┌ 28 / (xi + 2) ┐*
xi in the recursive function. The ceiling function denoted
by ┌ 28 / (xi + 2) ┐is defined as the smallest integer not
less than or equal to ( 28 / (xi + 2) ). This expression
denotes the equivalent number of cleaning days if xi
additional workers are hired. Data from past cleaning
activities indicate that if 2 workers (no additional worker) are present, it would take 14 days to finish the process.
VII. RESULTS AND DISCUSSIONS
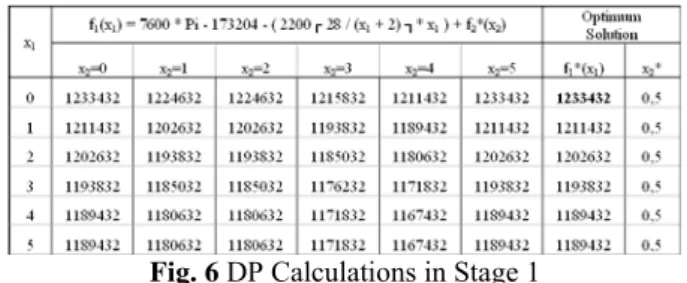
Fig. 1 to Fig. 6 presents the backward pass calculations for the DP model:
Fig. 1 DP Calculations in Stage 6
Fig. 2 DP Calculations in Stage 5
Fig. 3 DP Calculations in Stage 4
Fig. 4 DP Calculations in Stage 3
Fig. 6 DP Calculations in Stage 1
The DP model produced two optimal sets of decisions as summarized in Table VIII.
Table VIII Optimal Decision at Each Growing Cycle
Cycle Alternative 1 Alternative 2
1 Do not hire any additional worker.
Do not hire any additional worker.
2 Do not hire any additional worker.
Hire 5 additional workers.
3 Hire 5 additional workers.
Do not hire any additional worker.
4 Do not hire any additional worker.
Do not hire any additional worker.
5 Do not hire any additional worker.
Do not hire any additional worker. 6 Hire 2 additional
workers.
Hire 2 additional workers.
If the recommended number of workers is hired for each growing cycle, the expected harvest dates are summarized in Table IX.
Table IX Harvest Schedule
Alternative 1 Alternative 2
Stage 1 Harvest at day 65 (March 6)
Harvest at day 65 (March 6)
Stage 2 Harvest at day 121 (May 1)
Harvest at day 121 (May 1) Stage 3 Harvest at day 177
(June 26)
Harvest at day 167 (June 16) Stage 4 Harvest at day 223
(August 11)
Harvest at day 223 (August 11) Stage 5 Harvest at day 279
(October 6)
Harvest at day 279 (October 6) Stage 6 Harvest at day 335
(December 1)
Harvest at day 335 (December 1)
The optimal decisions at each stage are shown graphically in Fig. 7. The numbers in the arrows represent the number of days between harvest dates, while the figures inside the circles represent the additional number of workers to be hired. The illustration diverged at growing cycle 2 indicating alternative optimal decisions (in cycles 2 and 3). From growing cycle 4 onwards, the optimal decisions are the same for both alternatives.
Fig. 7 Scheduling of Hiring Workers at Each Growing Cycle
It is important to note that both alternatives resulted to a maximum profit of PhP 1,233,432.00, an improvement of about 20.92% in profit from the current system whose average profit is PhP 1,020,000.00 per year (or PhP 170,000.00 per grow).
The optimal decisions identified here involve shortening and lengthening the cleaning period of the farm. The following measures can be observed in altering the duration of the cleaning cycle.
To shorten the duration of the cleaning cycle, the following methods are suggested:
1. Since harvesting is done for a number of days, cleaning may be started gradually even before all chickens are harvested. However, this can't be done for the following reasons:
A. Hiring additional workers is required if workers are still attending on the harvesting of the chickens that are still present.
B. Cleaning involves dirt removal on floors using power sprayers. If the floors are wet, harvesting may be difficult or slower than when it is dry.
2. Much of the cleaning is done on the floors. The floors can be covered by old newspapers or rubber mats that can be disposed of and replaced after the growing cycle.
To lengthen the cleaning cycle on the other hand, the following alternatives can be followed:
1. Reward workers by giving them days off or paid or non-paid leaves.
2. Reallocate or reassign workers temporarily to other areas until they are needed again during the cleaning cycle.
as well as to the savings from efficient acquisition of labor and equipment.
VIII. ACKNOWLEDGMENT
The authors acknowledge the assistance of Ms. Sharry Mae Gonzales in the preparation of this paper.
REFERENCES
[1] “Poultry”. Britannica Online Encyclopedia. 2008. Encyclopaedia Britannica, Inc. 22 March 2008. <http://www.britannica.com/eb/article-9035053/fowl>. [2] Rosario, Keith. “Change=Profit”.Swift Agri Technical
Digest. 11.4. (2007): 16.
[3] Butterworth, Keith. “Practical Application of Linear/ Integer Programming in Agriculture”. JSTOR: The Journal of the Operational Research Society. 36.2 (1985): 99-107. 22 February 2008
<http://links.jstor.org/sici?sici=0160-5682(198502)36%3A2%3C99%3APAOLPI%3E2.0.CO %3B2-E>.
[4] Roush, W.B. “An Operations Research Approach to Leveraging New Technology Opportunities”. The Journal of Applied Poultry Research. 10 (2001):
293-302. 22 February 2008 <http://japr.fass.org/cgi/content/abstract/10/3/293>
[5] Sadia.com. Sadia. 22 February 2008 <http://www.sadia.com/en/home/index.asp>.
[6] Taube-Netto, Miguel. “Integrated planning for poultry production at Sadia”. Interfaces. 26 (1996): 38–53. 22
February 2008 <http://yunus.hacettepe.edu.tr/~aulucan/html/INTERFA
CES%20261%20Jan-Feb%201996%20Table%20of%20Contents%20and%20 Abstracts.htm>.
[7] “Average Farmgate Price of Chicken CY 1978-2006”. The Official Website of the Bureau of Animal Industry. 2006. Bureau of Animal Industry, Philippines. 20
February 2008 <http://www.bai.ph/mdd/price_farmgate_chicken_78_0