Análise econômico-financeira de aviários para a integração de frangos de corte sob condições de risco
Danilo Simões1, João Paulo Ribeiro2, Pedro Rodrigo Gouveia2, Josiane Corrêa dos Santos2
ABSTRACT
Financial investment projects are characterized by uncertainties. When quantified, these will determine the probability of their occurrence and the condition of risk. This information might be analyzed via simulation of Monte Carlo Method, which will establish the level of associated risk. To understand the financial risks of broiler production in integration system, cash flow models for aviaries were formulated with different technological levels. Using deterministic techniques, the value of the main economic viability indicators were calculated, which were incorporated to the risk through a probabilistic model of pseudo-random numbers, generated with Monte Carlo Method. The uncertainties associated to financial projects show that broiler production in different integration systems is economically viable. However, the best financial return and smallest risk are obtained with an aviary which contains low technological level and the least financial investment.
Index terms: Agribusiness; production cost; Monte Carlo method; simulation; net present value.
ReSUMO
Os projetos de investimentos financeiros são caracterizados por incertezas, que, quantificadas, determinarão a probabilidade de ocorrência e a condição de risco. Essas informações podem ser analisadas à partir da simulação do método de Monte Carlo, que estabelecerá qual é o grau de risco associado. Para a compreensão dos riscos financeiros da produção de frangos de corte em sistema de integração, foram formulados modelos de fluxo de caixa para aviários com diferentes níveis tecnológicos. Por meio de técnicas determinísticas, foi calculado o valor dos principais indicadores de viabilidade econômica, que foram incorporados ao risco por um modelo probabilístico de números pseudoaleatórios, gerados com o método de Monte Carlo. As incertezas associadas aos projetos financeiros indicaram que a produção de frango de corte em diferentes sistemas de integração é viável economicamente, mas o melhor retorno financeiro e menor risco são obtidos com o aviário que possui o baixo nível tecnológico e demanda menor investimento financeiro.
Termos para indexação: Agronegócio; custo de produção; método de Monte Carlo; simulação; valor presente líquido.
1Universidade Estadual Paulista “Júlio de Mesquita Filho”/UNESP – Rua Geraldo Alckmin – 519 – Vila Nossa Senhora de Fátima – 18409-010 – Itapeva – SP – Brasil – [email protected]
2Centro Estadual de Educação Tecnológica Paula Souza/ CEETEPS – Botucatu – SP – Brasil Received in january 7, 2015 and approved in march 20, 2015
INTRODUCTION
The Brazilian poultry industry was consolidated as a modern segment highly stimulated by public politics, especially since 1970, when the exportation began (Belusso; Hespanhol, 2010).
The advanced technologic, the increase in chicken meat consumption, and the consumer’s high demand for quality, directly influence the chicken production. This way, the agroindustry that establishes contract farming with the poultry industry imposes certain restrictions. The producers must have modern installation and equipment, ensuring the chicken welfare and costs reduction, what leads them to uncertain economic conditions.
Richetti and Santos (2000) stated that in broiler chicken production, the uncertainty economic condition may be found in several ways. Among them are the price
of broiler chicken paid to the farmer and some technics used in the remuneration system.
The main sources of uncertainty are multifaceted, involves risks related to market, suppliers, meteorology, technology, among other. Therefore, the risk analysis became an issue of increasing importance in economic study, because in most cases, the strategic decision is approached based on uncertainty economic scenarios (Chavas, 2004).
The Monte Carlo method allows a quantitative analysis of the risk with precision to address and solve several uncertainties related to entrepreneurship (Silva et al., 2014). The Monte Carlo approach in a study, uses random numbers to examine any problem (Machline, 1990; Woller, 1996).
technologic levels, we did an economic and financial analysis to measure both the economic efficiency and the risk conditions of financial projects on poultry.
MATeRIAL AND MeTHODS
Characterization of the poultry house
In this study, we used a matrix with the technical coefficients obtained from interviews with the owners of poultry farms located in the Center-West of Sao Paulo state, characterized as follows:
Conventional poultry: shed area of 1,680m² (12 m x 140 m), bare soil floor, automatic feeder, nipple drinker, firewood heating, feed silo capacity of 20 tons, fans in negative pressure, cooling mist, lining and internal and external curtain in yellow and blue color, respectively, capacity to accommodate 26,000 chickens per batch;
poultry with positive pressure acclimatized system: shed area of 2,100 m² area (14 m x 150 m), bare soil floor, automatic feeder, nipple drinker, firewood heating, feed silo capacity of 21 tons, exhaust fans in positive pressure, cooling mist, ceiling in blue color and internal and external curtain in blue, capacity to accommodate 32,000 chickens per batch;
poultry with negative pressure acclimatized system: shed area of 2,100 m² area (14 m x 150 m), concrete floor, automatic feeder, nipple drinker; firewood heating, two feed silos with a capacity of 17 tons, exhaust fans in negative pressure, pad cooling, lining in black color, power generator, light trap at the inlet and at the air outlet, dimmer to control the brightness, capacity to accommodate 32,000 chicken per batch.
Costs production estimation
The economic analysis was made from the estimate of the total cost of production (TCP) from the chicken with one day old until the day of the chicken pick up, which is the responsibility of the integrator companies. We used the Sao Paulo State Institute of Agricultural Economics (IEA) methodology, proposed by Matsunaga, Bemelmans and Toledo (1976), that has the following classifications. Effective operational cost (EOC), which weighed up costs as: environmental assessment; supplies; machinery maintenance and improvements; granting water; permanent workers; management fees; revalidation of the environmental license; Rural Letter Carriers’ Association; bank fees; telecommunications; facilities insurance.
Total operating cost (TOC), which includes, depreciation estimated by linear method; social insurance
contributions, (Brazilian Social Security Institute (INSS), holidays, Brazilian Fund for Guaranteed Time of Service (FGTS), and other), that holds a spending percentage of 43.1% on permanent workers; taxes; return on invested capital.
Total cost of production (TCP), result of the EOC and TOC summation.
Costs were expressed in American dollar, as it is used as a parameter of the international financial market. The dollar rate price was obtained from the Banco Central do Brasil (PTAX 800) official foreign exchange price, measured in fractions and units of the national currency, which was R$ 2.1760 on 10/22/2013 (Banco Central do Brasil, 2014).
Indicators of economic profitability
Gross Revenue (GR) was obtained by the amount paid to the farmer for the number of live chickens delivered, with the sales value predefined by the integrator company. Gross Margin (GM) was obtained from the relation between the value received for the chicken delivery and the farmer total cost of production. Operating Income (OI) can be defined as the difference between gross revenues and total operating cost.
Risk analysis of the investment project
The incorporation of risk to the financial investment project was performed with 100,000 Monte Carlo stochastic method simulations with stratified probability distribution. We used the random number generator Mersenne Twister (Matsumoto; Nishimura, 1998).
The simulations, data descriptive statistics, and Spearman’s correlation coefficient, applied to check the input variables inter-relationship, were performed using @Risk for Excel software (Palisade Corporation, 2014).
The Autoregressive Integrated Moving Average (ARIMA) model proposed by Box and Jenkins (1970) by the selection criterion Bayes Information Criterium (BIC) developed by Schwarz (1978) was adopted to project the discount rate, inflation rate, quantity of chickens per production batch and, the marketing value (USD chicken-1).
Thus, we used data from the economic and financial time series related to the Special Settlement and Custody System (Selic) provided by the Banco Central do Brasil (2014b) and observed between January, 2008 and January, 2014, to predict future discount rate that is used to calculate the return on capital invested.
between January, 2008 and January, 2014, with the purpose of updating the amount of depreciation and taxes paid during the series of cash flows. The projections of quantity of chickens per production batch and of the marketing value took place from the data from February, 2013 to March 2014, provided by the farmers. Values were converted to American marketing dollar based on the poultry farmers’ payment day.
For this stochastic simulation model, were considered eight input variables that when related to each other, directly influence the formation of the dependent variable Gross Revenue (GR), which were: the quantity of chickens per production batch; invested capital (USD); total cost of production (USD); marketing value (USD chicken-1); slaughter age of chickens (days); interval
between production batches (days); Selic rate; and IPCA. The triangular distribution was applied due to no knowledge of each input distributions, which highly influence the financial outcome of the project. A variant of -20.0% to +20.0% of the deterministic values was delimited to find the minimum, mode and maximum values for the inputs, except for: quantity of chickens per production batch; marketing value (USD chicken-1);
Selic rate; and IPCA, which were designed by the moving averages.
The economic viability indicators, considered as the simulation model output variables were: Net Present Value (NPV) and Internal Rate of Return (IRR), both as proposed by Murta et al. (2013); Discounted Payback according to Smith et al. (2011); Equivalent Uniform Annual Value (EUAV), which determines the equivalent uniform series of all costs and revenues, using a minimum rate of attractiveness and; Cost-benefit analysis (CBA), according to Maneschy, Santana and Veiga (2009), which are commonly used for financial investments analysis.
The cash flow, which establishes the sum of inputs and outflows, that for the condition of this
study was considered to be unconventional, to present alternations therefore production cycles, comprised for a 20-year period, due to the equipment and facilities useful life.
ReSULTS AND DISCUSSION
The estimation of the project cost using the Monte Carlo method is based on replacement of real data with random values generated on the basis of their probability distributions, performing a large number of iterations (Luban; Hîncu, 2010). Due to the uncertainties and risks that this investment is heavily exposed to, the viability and profitability can be evaluated from the projection of expenditures required for the project implementation, enabling risk measurement in advance.
The most probable values for the implementation of the investment project in broilers farms are: conventional poultry -USD 62,803.76; poultry with positive pressure acclimatized system USD 174,862.07; and poultry with negative pressure acclimatized system USD 193,099.65.
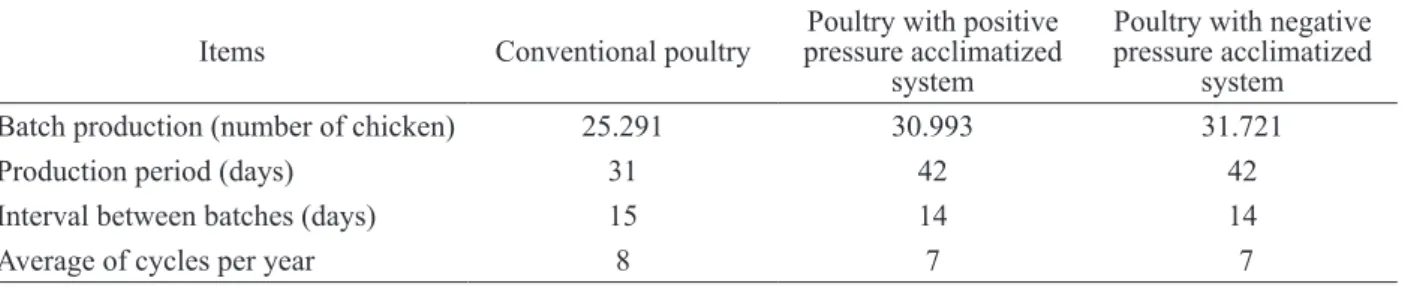
From the simulation model (Table 1), we can observe the most likely data output on broilers production in integrated systems. In the conventional system, the production period is shorter when compared to the others, due to the one adopted by the integrator company, that the farmer is bound to, which in turn implies a lower selling price.
The poultry farmers who use the poultry with negative and positive pressure acclimatized systems, have contract with the same integrator, which determines a longer period for the chicken production compared to the conventional system period.
Cost production
In broiler production, the marketing value is an external variable, to what the administrators have little or no influence, however, monitoring the production costs and productivity rates it is essential to enhance the benefits (Carvalho; Fiúza; Lopes, 2008).
Table 1: Mode values for the broilers production in integrated systems.
Items Conventional poultry pressure acclimatized Poultry with positive system
Poultry with negative pressure acclimatized
system
Batch production (number of chicken) 25.291 30.993 31.721
Production period (days) 31 42 42
Interval between batches (days) 15 14 14
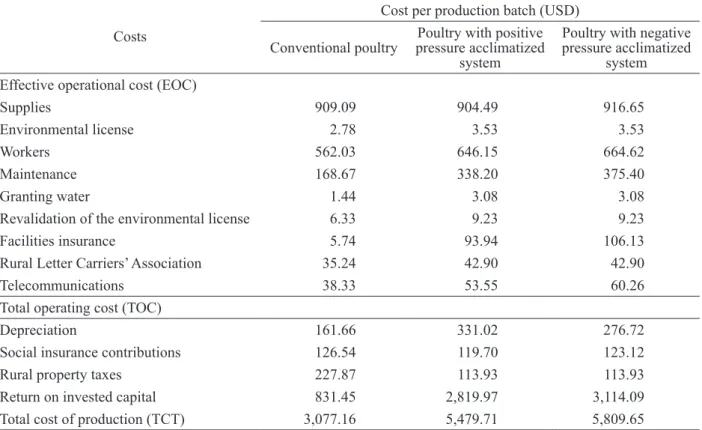
Therefore, a successful agribusiness is directly related to the level of criteria for the resources operationalization, geared towards minimizing and optimizing results. The Effective operational cost (EOC) presented in Table 2, represented on average approximately 44.1% of the total cost of production (TCP). Among the items comprising the TCP, we highlight the supplies and the return on invested capital, representing approximately 65%. The chicken production from conventional system has as the most likely cost USD 0.1217; from the poultry with positive pressure acclimatized system, USD 0.1768; and from
the poultry with negative pressure acclimatized system, USD 0.1831.
Economic profitability
The broilers integrated system production highest profit was obtained with the positive pressure acclimatized system (Table 3), which had a higher gross profit margin and consequently, an increase in operational gains, which enables measuring the short-term profitability, besides highlighting the positive economic and financial situation of the activity.
Table 2: Costs per batch of broilers production in integrated systems.
Costs
Cost per production batch (USD)
Conventional poultry pressure acclimatized Poultry with positive system
Poultry with negative pressure acclimatized
system Effective operational cost (EOC)
Supplies 909.09 904.49 916.65
Environmental license 2.78 3.53 3.53
Workers 562.03 646.15 664.62
Maintenance 168.67 338.20 375.40
Granting water 1.44 3.08 3.08
Revalidation of the environmental license 6.33 9.23 9.23
Facilities insurance 5.74 93.94 106.13
Rural Letter Carriers’ Association 35.24 42.90 42.90
Telecommunications 38.33 53.55 60.26
Total operating cost (TOC)
Depreciation 161.66 331.02 276.72
Social insurance contributions 126.54 119.70 123.12
Rural property taxes 227.87 113.93 113.93
Return on invested capital 831.45 2,819.97 3,114.09
Total cost of production (TCT) 3,077.16 5,479.71 5,809.65
Table 3: Economic profitability indicators of broilers production in integrated system.
Items Conventional poultry Poultry with positive pres-sure acclimatized system
Poultry with negative pressure acclimatized
system
Poultry litter (USD) 631.89 989.22 1,148.89
Gross revenue 5,012.29 9,537.09 9,897.54
Operational profit (USD) 1,935.13 4,057.38 4,087.89
According to Figueiredo et al. (2006), the value of the poultry litter is also subject to risk, although less intense, due to the fact that it can be used as organic fertilizer, when it is not sold for animal feed. Thus, the revenue obtained from the poultry litter sale was determined based on observation, being traded every eight production lots, on average.
Sensitivity analysis
Although the integrated system is identified as a mechanism that reduces risk to the producer, it must be emphasized that the chicken is a commodity. Thereby, it is subject to the market conditions and risks, which may hinder business performance, even in contractual mechanism as in integrated systems (Melo; Silva; Esperancini, 2008).
For the conventional poultry, the total cost of production, slaughter age of chickens, invested capital and, the interval between production batches, concomitantly, are the variables that have the greatest negative correlation with VPL. The Selic and the IPCA rate also have a negative correlation. However, it was not relevant, because both presented a Spearman’s linear correlation coefficient below -0.02. The marketing value and the quantity of chickens per production batch have a Spearman’s linear correlation coefficient positive (above 0.56), showing that they are crucial to the economic viability of this system.
For the poultry with positive and negative pressure acclimatized systems, the total cost of production, capital invested, the slaughter age of chickens and, the interval between production batches, are the variables that have higher negative correlation with the VPL, with Selic and IPCA taxes, and a low Spearman’s linear correlation coefficient (-0.03). The quantity of chicken produced and the marketing value, have the largest proportional correlation to VPL, with a Spearman’s linear coefficient superior than 0.52.
The sensitivity analysis showed that among the input variables analyzed by the triangular distribution, the total cost of production (TCP) has the largest negative effect on NPV, and it increases in 5.0% would decrease NPV value in 71.8%, on average. Thence, TCP is extremely sensitive in broiler chickens integrated systems, because small variations cause major changes in the representative value of its cash flow. This fact demonstrates that poultry is susceptibility to financial risk, even with some guarantees granted by the integrating companies.
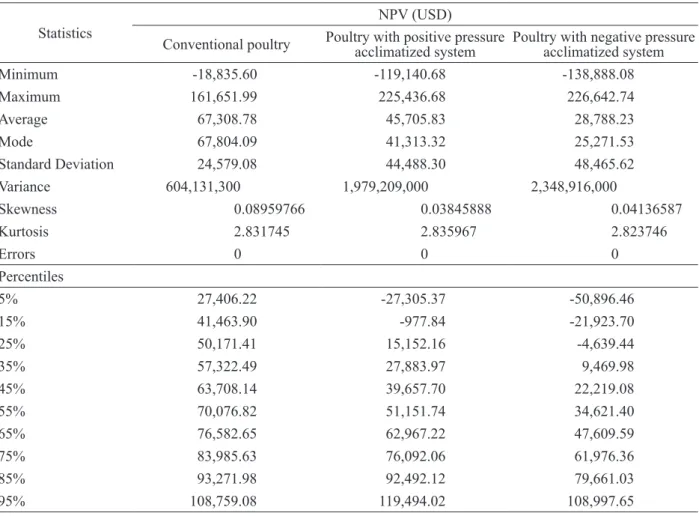
The results from the Net Present Value (NPV) simulation, presented in Table 4, allow us to consider that the skewness and kurtosis of the economic viability indicators have approximately normal distribution,
respectively close to 0 and 3. It is noteworthy that the proximity of the median (percentile 50.0%) with the mean and mode values obtained confirmed the normality of the data.
The statistical description data transforms the condition of uncertainty of the poultry with negative pressure acclimatized in risk condition, because, its variance and standard deviation are higher than in other poultry systems. Therefore, it holds a higher probability to have a negative NPV. In addition, it obtained the worst value for the worst case scenario, corroborating the high risk of the investment project. The poultry with positive pressure acclimatized has a medium risk, including the possibility of obtaining a higher NPV.
The conventional poultry has a low risk, considering the estimated value for the pessimistic scenario and due to the standard deviation and variance, but consequently, have the probability to obtain a lower NPV.
The triangular frequency distribution, obtained by Monte Carlo method simulation, is presented in Figure 1. The probability of the farmer to obtain a negative NPV is 0.1%, 15.5% and, 28.2% with the conventional poultry, poultry with positive and negative pressure acclimatized systems, respectively.
These percentiles confirm the high risk of financial investment for the integrated system using negative pressure acclimation, based on this study results. Andrade (2013) stated that all investments are subject to a great number of influences and factors that may result in final changes regarding the return expectation that the entrepreneur has or with respect to the value that naturally could expect.
Therefore, regarding a financial investment, the farmer decision depends on the degree of market and contractual uncertainties that incorporate and determine the boilers production integrated systems risk.
Economic viability indicators
Table 4: Descriptive statistics of the NPV of broilers production in integrated systems.
Statistics
NPV (USD)
Conventional poultry Poultry with positive pressure acclimatized system Poultry with negative pressure acclimatized system
Minimum -18,835.60 -119,140.68 -138,888.08
Maximum 161,651.99 225,436.68 226,642.74
Average 67,308.78 45,705.83 28,788.23
Mode 67,804.09 41,313.32 25,271.53
Standard Deviation 24,579.08 44,488.30 48,465.62
Variance 604,131,300 1,979,209,000 2,348,916,000
Skewness 0.08959766 0.03845888 0.04136587 Kurtosis 2.831745 2.835967 2.823746
Errors 0 0 0
Percentiles
5% 27,406.22 -27,305.37 -50,896.46
15% 41,463.90 -977.84 -21,923.70
25% 50,171.41 15,152.16 -4,639.44
35% 57,322.49 27,883.97 9,469.98
45% 63,708.14 39,657.70 22,219.08
55% 70,076.82 51,151.74 34,621.40
65% 76,582.65 62,967.22 47,609.59
75% 83,985.63 76,092.06 61,976.36
85% 93,271.98 92,492.12 79,661.03
95% 108,759.08 119,494.02 108,997.65
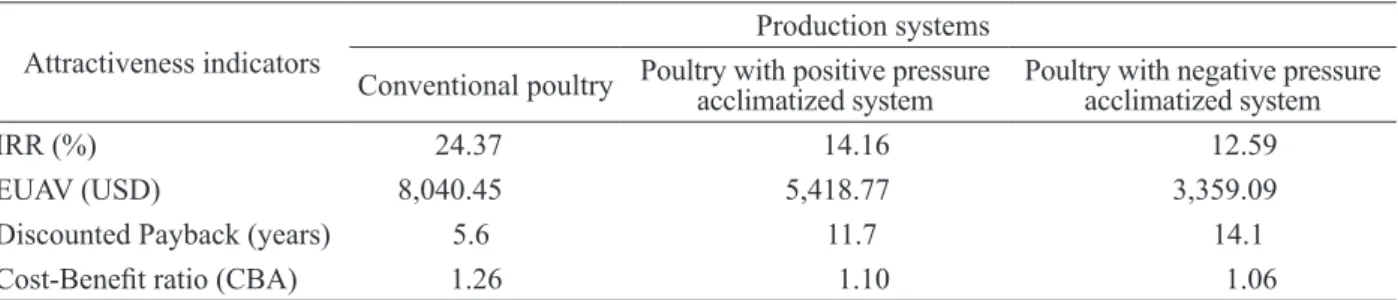
In the opinion of Silva et al. (2014) the Equivalent Uniform Annual Cost is similar to the NPV method, but consists in finding the uniform annual equivalent series costs and revenues of the investment using the TMA. Thus, all poultry showed positive values, however, the most recommended economically is the conventional system due to its result in greater EUAV. This indicator of economic viability represents the economic gain for each period of the series of cash flow that the entrepreneur will obtain during the lifetime of the investment.
The Discounted Payback (Table 5), defined by Weston and Brigham (2000) as the expected years to recoup the investment, resulted in a shorter period to the conventional system. Therefore, the period of return on investment of the conventional system is considerably lower than that estimated for the project and also showed to be lower than the other systems of broiler production.
The Cost-Benefit analysis results in a ratio of revenue from the investment project and the total cost of production, and the investment project should not be accepted if the ratio is less than 1. To Campos (2007), the CBA indicator widely used and has a relatively easy interpretation compared to other indicators. The greatest benefit was obtained with the conventional system, although the other systems present CBA ratio greater than 1.
CONCLUSIONS
The three systems used in the integrated boilers production are economically viable. Yet, the conventional production system enables better economic profitability and the lowest financial risk.
The total cost of production is decisive in the economic viability of investment projects in integrated broilers production.
The farmer that adopts the poultry with positive pressure acclimatized system, which demands greater investment, needs 70.5% of the project lifetime to recover the capital invested.
The average profitability of investment projects in integrated broilers production expressed in present value terms is 14.0%.
ReFeReNCeS
ANDRADE, E. L. A decisão de investir: métodos e modelos para avaliação econômica. Rio de Janeiro: LTC, 2013. 280p.
BANCO CENTRAL DO BRASIL. Conversão de moedas, 2004. Available in: <http://www4.bcb.gov.br/ pec/conversao/conversao.asp>. Access in: mar. 25, 2014a.
BANCO CENTRAL DO BRASIL. Estatísticas econômico-financeiras, 2004. Available in: <https:// www3.bcb.gov.br/sgspub/pefi300/telaCtjSelecao.paint>. Access in: mar. 25, 2014b.
BELUSSO, D.; HESPANHOL, A. N. A evolução da avicultura industrial brasileira e seus efeitos territoriais.
Revista Percurso. 2(1): 25-51, 2010.
BOX G.; JENKINS, G. Time series analysis: forecasting and control. 3.ed. San Francisco: Holden-Day, 1970. 575p.
CAMPOS, R. T. Avaliação benefício-custo de sistemas de dessalinização de água em comunidades rurais cearenses. Revista de Economia e Sociologia Rural. 45(4):963-984, 2007.
CARVALHO, F. M.; FIÚZA, M. A.; LOPES, M. A. Determinação de custos como ação de competitividade: estudo de um caso na avicultura de corte. Ciência e
Agrotecnologia. 32(3):908-913, 2008.
CHAVAS, J. P. Risk analysis in theory and practice. San Diego: Elservier Academic Press, 2004. 247p. Table 5: Economic attractiveness indicators for broilers production in integrated systems.
Attractiveness indicators
Production systems
Conventional poultry Poultry with positive pressure acclimatized system Poultry with negative pressure acclimatized system
IRR (%) 24.37 14.16 12.59
EUAV (USD) 8,040.45 5,418.77 3,359.09
Discounted Payback (years) 5.6 11.7 14.1
FIGUEIREDO, A. M. et al. Integração na criação de frangos de corte na microrregião de Viçosa – MG: viabilidade econômica e análise de risco. Revista de Economia e Sociologia Rural. 44(4):713-730, 2006.
GITMAN, L. J. Princípios de administração financeira. 12.ed. São Paulo: Pearson Prentice Hall, 2012. 775p.
LUBAN, F.; HÎNCU, D. Project cost analysis under risk. Economia Seria Management.13(2):495-503, 2010.
MACHLINE, C. Manual de administração da produção. 7.ed. Rio de Janeiro: Fundação Getúlio Vargas, 1990. 617p.
MANESCHY, R. Q.; SANTANA, A. C.; VEIGA, J. B. Viabilidade econômica de sistemas silvipastoris com
Schizolobium parahyba var. amazonicum e Tectona grandis no Pará. Pesquisa Florestal Brasileira,
60(1):49-56, 2009.
MATSUNAGA, M.; BEMELMANS, P. F.; TOLEDO, P. E. N. Metodologia de custo de produção utilizado pelo IEA. Agricultura em São Paulo. 23(1):123-139, 1976.
MATSUMOTO, M.; NISHIMURA, T. Mersenne Twister: a 623-dimensionally equidistributed uniform pseudorandom number generator. ACM Transactions on Modeling and Computer Simulation. 8(1):3-30, 1998.
MELO, C. O.; SILVA, G. H.; ESPERANCINI, M. S. T. Análise econômica da produção de frango de corte sob condições de risco no Estado do Paraná. Ciência e Agrotecnologia. 32(6):1919-1926, 2008.
MURTA, R. M. et al. Viabilidade econômica do uso de fontes lipídicas na dieta de vacas em lactação. Arquivo Brasileiro de Medicina Veterinária e Zootecnia. 65(5):1454-1462, 2013.
PALISADE CORPORATION. @Risk para Excel. Versão 6.3.0 Edição Industrial. Newfield: Palisade Corporation, 2014.
RICHETTI, A.; SANTOS, A. C. O sistema integrado de produção de frango de corte em minas gerais: uma análise sob a ótica da ECT. Organizações Rurais & Agroindustriais. 2(2):34-43, 2000.
SCHWARZ, G. Estimating the dimension of a model.
Annals of Statistics. 6(2):461-464, 1978.
SIQUEIRA, H. M.; SOUZA, P. M.; PONCIANO, N. J. Café convencional versus café orgânico: perspectivas de
sustentabilidade socioeconômica dos agricultores familiares do Espírito Santo. Revista Ceres. 58(2):155-160, 2011.
SILVA, C. S. J. et al. Viabilidade econômica e rotação florestal de plantios de candeia (Eremanthus erythropappus), em condições de risco. Revista Cerne. 20(1):113-122, 2014.
SILVA, D. A. L. et al. Análise de viabilidade econômica de três sistemas produtivos de carvão vegetal por diferentes métodos. Revista Árvore. 38(1):185-193, 2014.
WESTON J. F.; BRIGHAM, E. F. Fundamentos da administração financeira.10.ed. São Paulo: Pearson,
2000. 1030p.