Correlations between ASCC3 Gene
Polymorphisms and Chronic Hepatitis B in a
Chinese Han Population
Lifeng Liu
1‡*
, Jinliang Zhang
2‡, Yan Lu
1, Chunfang Fang
1, Senlin Li
1, Jusheng Lin
31Department of Gastroenterology, Liaocheng People’s Hospital, Liaocheng Clinical School of Taishan Medical University, Liaocheng, Shandong, China,2Department of Hepatobiliary Surgery, Liaocheng People’s Hospital, Liaocheng Clinical School of Taishan Medical University, Liaocheng, Shandong, China,
3Institute of Liver Disease, Tongji Hospital, Tongji Medical College, Huazhong University of Science and Technology, Wuhan, Hubei, China
‡These authors share first authorship on this work. *[email protected]
Abstract
We have previously identified 8 SNPs in Han Chinese HBV carriers that are associated with
disease progression. Although not well studied, genetic factors may also play a significant
role in developing chronic HBV disease after exposure. We extend the effect of these eight
SNPs on persistent HBV infection in this study. A total of 875 unrelated Han Chinese, 493
chronic hepatitis B subjects (CHB) and 382 HBV clearance individuals (Clear), were
recruited from Hubei Province from September 2007 to March 2010. SNPs were verified by
using TaqMan 7900HT Sequence Detection System. By using multiple logistic regression
analysis, each of the 8 SNP associations was tested using 3 different genetic models
(Dom-inant, Recessive and Additive model), in 4 types of analyses (full sample, men, women, age
stratified). A Bonferroni correction was used to account for multiple statistical tests for each
SNP association (P
<
0.05/8 = 0.0063). A significant correlation was observed at SNP
rs10485138 located in ASCC3 gene in female patients (OR, 0.445; 95% CI, 0.253
–
0.784;
P
= 0.005). Females bearing C allele infected by HBV had an increased susceptibility to
CHB compared with those T allele carriers. Our results indicated that SNP rs10485138
located in ASCC3 gene was associated with persistent HBV infection in Han Chinese.
Introduction
Hepatitis B virus (HBV) infection is a global health issue, with approximately2 billion people
exposed to HBV and 350 million of them suffering from persistent HBV infection [1]. The
prevalence of HBV infection vary greatly worldwide, with a relative low-incidence in western
countries[2,3] and endemic in Asian and most of Africa countries. The incidence rate of HBV
infection in China is 7.18% [4], causing high mortality and societal burden. The clinical
out-come of HBV infection varies from spontaneous recovery to persistent infection.
Approxi-mately 80
–
90% of infants who infected HBV from their mothers would develop chronic
OPEN ACCESSCitation:Liu L, Zhang J, Lu Y, Fang C, Li S, Lin J (2015) Correlations between ASCC3 Gene Polymorphisms and Chronic Hepatitis B in a Chinese Han Population. PLoS ONE 10(11): e0141861. doi:10.1371/journal.pone.0141861
Editor:Ferruccio Bonino, University of Pisa, ITALY
Received:June 14, 2015
Accepted:October 14, 2015
Published:November 4, 2015
Copyright:© 2015 Liu et al. This is an open access article distributed under the terms of theCreative Commons Attribution License, which permits unrestricted use, distribution, and reproduction in any medium, provided the original author and source are credited.
Data Availability Statement:All relevant data are within the paper and its Supporting Information files.
Funding:This study was supported by the Projects of medical and health technology development program in Shandong province (2013WS0094) and Shandong Provincial Natural Science
(ZR2014HL019). The funders had no role in study design, data collection and analysis, decision to publish, or preparation of the manuscript.
hepatitis B. While more than 95% of HBV infection acquired in adulthood is resolved within 6
months with or without clinical symptoms, and less than 5% develop persistent infection[5].
HBV is not directly cause hepatic injury. After HBV infection, hepatic injury is thought to be
due to immune responses of the host, which depends on an intricate interplay of host factors
(such as age, gender, immune status), viral and environmental factors. The mechanisms
under-lying the different clinical outcomes of HBV infection are not fully understood. Researches
about twins, family-clustering ofHBV infection and ethical studies of HBV infection indicate
that host genetic background play an important role in HBV infection [6
–
9]. Host genetic
fac-tors, especially single nucleotide polymorphisms (SNPs), is regarded to be one of the
determi-nants for this clinical heterogeneity. A number of polymorphisms in candidate genes, For
example CXCL10[10], CD24[11], IFNAR1[12] Furin[13] have been validated for associations
with HBV persistence. A Genome wide association studies (GWAS) using large samples
identi-fied that HLA-DPA1 and DPB1 were associated with persistent HBV infection in Japanese
population [14].
Eight SNPs were previously identified to be associated with HBV progression in a
Genome-Wide Association Study (GWAS) with DNA pooling carried out by ourself in 2011
(GSE26034). Four pools and twelve chips (each pool was replicated in triplicate) were
per-formed using Affymetrix Genome-Wide Human Mapping SNP6.0 Arrays. This study included
four groups: case A was acute liver failure group, case B was liver cirrhosis group, case C was
hepatocellular carcinoma group\, and control was asymptomatic carrier group. One group
cor-responds to one pool. Raw probe intensity data (CEL files) were used to calculate relative allele
signal (RAS) scores and to estimate allele frequencies. The silhouette method was used to
ana-lyze the results of DNA pooling. Eight SNPs (rs11866328, rs10845858, rs1041236, rs2013562,
rs786100, rs12206945, rs10485138, rs6909880) that were top predictors in the DNA pooling
screening stage (Silhouette method exceeding 0.8) were selected. Rs11866328 is an intronic
SNP in GRIN2A gene at chromosome 16. GRIN2A gene is associated with Parkinson disease
[15] and speech dysfunction[16]. Rs10845858 is an intronic SNP in GRIN2B gene at
chromo-some 12. GRIN2B gene is associated with schizophrenia[17]. Rs1041236 is an intronic SNP in
GPA33 gene at chromosome 1. GPA33 gene is expressed primarily in the normal intestine and
in
>
95% of colon tumors but not by other normal tissues [18
–
20], and is a therapeutic target
in colon cancer immunotherapy [21,22]. Rs2013562 is an intronic SNP in UGT2B4 gene at
chromosome 4, a gene is associated with breast cancer [23]. Rs786100 is an intronic SNP in
BNC2 gene at chromosome 9, BNC2 gene is associated with ovarian cancer[24]. Rs12206945,
rs10485138 and rs6909880 are intronic SNPs in ASCC3 gene at chromosome 6. ASCC3 gene is
associated with DNA repair and cell proliferation [25]. They were evaluated by using 854
asymptomatic HBV carriers (AsC) versus 1944 progressed HBV carriers (including liver
cir-rhosis, hepatocellular carcinoma and acute liver failure) in the Han Chinese population [26].
We performed a PubMed search and had not found a relevant report about these eight SNPs
and its corresponding six genes with HBV persistence. In this study, we sought to extend
corre-lations between these 8 SNPs and CHB in Han Chinese population.
Patients and Methods
Ethic statement
Patients
A total of 875 unrelated Han Chinese were recruited from Hubei Province (Wuhan Tongji
Hospital, Wuhan Union Hospital and Traditional Chinese Medicine Hospital of Hubei
Prov-ince) from September 2007 to March 2010. A uniform questionnaire was used at enrollment
including gender, age, self-report of HBV transmission, family history of HBV infection,
alco-hol consumption et al. The demographic information included birth-date, birthplace, past and
current residency. This case-control study was composed of two subgroups: 382 HBV patients
who cleared their infection spontaneously (Clear) and 493 chronic hepatitis B patients (CHB).
The recruitment criteria were listed in
S1 Table. Clear patients were at least 35 years old at
enrollment to avoid potential confounding by HBV vaccination that became available since
1981; infant vaccination was introduced in 1992[27].
DNA Isolation and SNP Genotyping
Genomic DNA was isolated from peripheral whole blood using TIANamp blood DNA kit
(Tiangen Biotech [Beijing] Co., Ltd., China). The concentration and purity of the DNA
were determined with a NanoDrop spectrophotometer and diluted to a final concentration of
8 ng/
μ
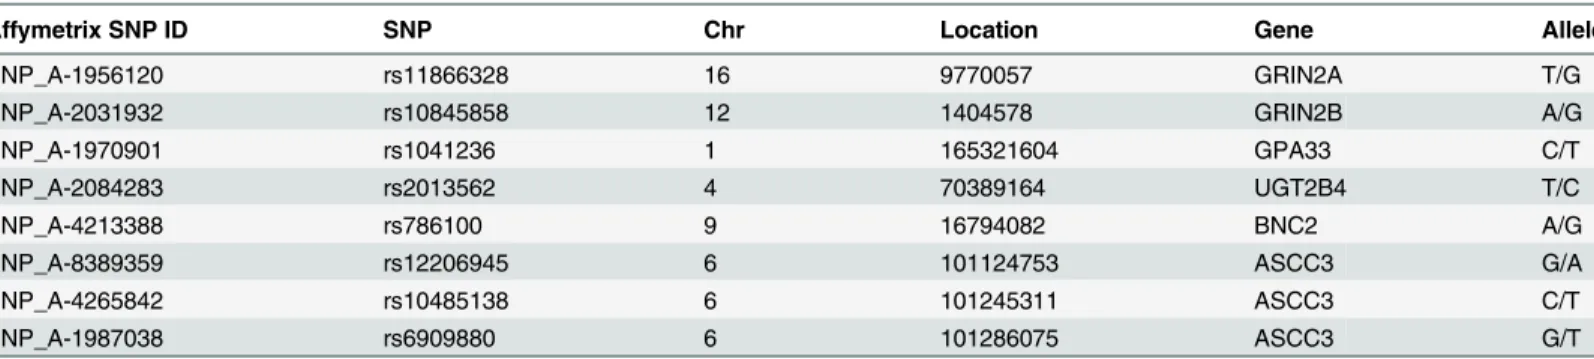
L. Characteristics of 8 SNPs were shown in
Table 1. The genotyping of genetic
polymor-phisms was performed via the TaqMan method according to the protocol of TaqMan SNP
Genotyping Assays (AppliedBiosystems, California, USA). The TaqMan 7900HT Sequence
Detection System (Applied Biosystems, Foster City, CA) was used for genotyping according to
the manufacturer
’
s instructions. Each assay was carried out in a 5-
μ
L reaction system
consist-ing of TaqMan universal polymerase chain reaction master mix (2.5
μ
L, Applied Biosystems),
SNP genotyping assay (20X 0.25
μ
L), genomic DNA (1.25
μ
L 8ng/
μ
L) and DNase-free,
sterile-filtered water (1.0
μ
L) in MicroAmp Optical 384-Well Reaction Plate with Barcode (4309849
Applied Biosystems, California, USA). The SNP genotyping assay included forward and reverse
primers, and 6-carboxyfluorescein (FAM)- and
4,7,2¢-trichloro-7¢-phenyl-6-carboxyfluores-cein (VIC)-labeled probes (ABI Assay on Demand,
S2 Table). The program was heating to
95°C for 10 minutes followed by 45 cycles of 92°C for 15 seconds and 60°C for 1 minute. Allelic
category was measured automatically using the Sequence Detection System 2.3 software
(Applied Biosystems) according to the intensity of VIC and FAM dye. To validate the TaqMan
assay, we analyzed 43 (5%) randomly selected samples by both direct sequencing (Invitrogen,
Shanghai, China) and Taq-Man assay. The concordance rate of these two methods was 100%,
indicating that the TaqMan assay was reliable.
Table 1. Characteristics of variants.
Affymetrix SNP ID SNP Chr Location Gene Allele
SNP_A-1956120 rs11866328 16 9770057 GRIN2A T/G
SNP_A-2031932 rs10845858 12 1404578 GRIN2B A/G
SNP_A-1970901 rs1041236 1 165321604 GPA33 C/T
SNP_A-2084283 rs2013562 4 70389164 UGT2B4 T/C
SNP_A-4213388 rs786100 9 16794082 BNC2 A/G
SNP_A-8389359 rs12206945 6 101124753 ASCC3 G/A
SNP_A-4265842 rs10485138 6 101245311 ASCC3 C/T
SNP_A-1987038 rs6909880 6 101286075 ASCC3 G/T
SNP: single nucleotide polymorphisms, Chr: chromosome, Location: Genomic position (NCBI Build 36), Allele: minor allele/major allele, Clear: spontaneously recovered individuals with history of HBV infection, CHB: chronic hepatitis B patients.
Statistical analysis
Statistical analysis was performed by using SPSS 17.0 and HaploView 4.2 software.
Hardy-Weinberg equilibrium of genotype frequencies was evaluated online using the website of
Tech-nical University Munich (http://ihg2.helmholtz-muenchen.de/cgi-bin/hw/hwa1.pl).
χ
2tests
and independent sample t-test were used to examine the differences in clinical characteristics
of participants. Tests were two-sided with a significance level of P
<
0.05. The adjusted Odds
ratio (OR) and 95% confidence interval (95% CI) were calculated by multiple logistic
regres-sion under genetic models with adjustment for gender and age. The linkage disequilibrium
(LD) was performed using the HaploView 4.2 softwareA Bonferroni correction was used to
account for multiple statistical tests for each SNP association. P
<
0.05/8 = 0.0063 was the
appropriate significance level
Results
Hardy-Weinberg equilibrium test
Significant difference was not found between observed and expected frequencies of each
geno-type in involved populations (P
0.05 Results were listed in
S3 Table). This indicated that
these participants had a relatively stable genetic background and were suitable for further
genetic statistical analysis.
Clinic and demographic characteristics
The clinical and demographic characteristics of this study were summarized in
Table 2,
includ-ing gender, age, drinkers, family history of HBV infection, serum markers of hepatitis B virus,
serum level of HBV-DNA load, alanine transaminase (ALT) and aspartate aminotransferase
(AST).
“
Drinker
”
was defined as alcohol consumption of
>
40 g/wk for men and
>
20 g/wk for
women [10]. Although an effort was made to obtain a good match on gender and age between
Clear and CHB, there were more men in CHB (P
<
0.001) and subjects in CHB were much
younger (P
<
0.001) in our hospital-based case-control study. There was no significant
Table 2. Clinical and demographic characteristics of participants.
Clear (n = 382) CHB (n = 493) P value
Gender (M/F) 174/208 408/85 P<0.001
Age (Y), (n, mean±SD)
35y 382 (49.45±8.70) 314 (44.05±7.94) P<0.001
<35 - 179 (27.35±4.68)
Drinkers, n (%) 98 (25.65) 136 (27.31) P = 0.261
HBsAg All - All +
Anti-HBs IgG All + All
-HBeAg, n (%) All - 95 (19.27)
Anti-HBc IgG All + All +
Family history no. (%) No. 70 (14.20)
ALT (IU/L) 32.16 (3.25) 189.02 (328.76) P<0.001
AST (IU/L) 25.78 (7.90) 163.52 (287.27) P<0.001
HBV-DNA (copy/ml) All - 4.23 (1.61)
M: male, F: female, Y: years, SD: standard deviation, no.: number, Clear: spontaneously recovered individuals with history of HBV infection, CHB: chronic hepatitis B patients. ALT: alanine transaminase, AST: aspartate aminotransferase, No means non-detected. The differences of clinical characteristics were calculated using chi-square test and independent sample t-test.
difference in alcohol consumption between Clear and CHB. All Clears were 35 years or older,
while the number was 314 in CHB, and 179 CHB under 35 years. Nity-fiveCHB patients were
HBeAg positive and the percentage was 19.27%. Seventy CHB patients had family history of
HBV infection and the percentage was 14.2%. There was a significant difference in serum ALT
and AST level (P
<
0.001) between Clear and CHB.
Logistic regression analysis of the polymorphisms
Multiple logistic regressions with adjustment for sex and age was used to determine SNPs
’
effects on CHB in comparison with Clear. Each of the 8 SNP associations was tested using 3
different genetic models (Dominant model, Recessive model and Additive model), in 4 types of
analyses (full sample, men only, women only, age stratified). Genotype-based additive model
and recessive model, and an allele-based model were shown. The best-fit effect of these eight
SNPs was observed in the allele model in women only.
Associations in full sample were listed in
Table 3, and no differences of variants in genotype
distributions or allele frequencies were detected. Analysis in men only was summarized in
Table 4
and associations in genotype or allele distributions were not found. Correlation in
women was displayed in
Table 5. A significant correlation was observed at rs10485138 located
in ASCC3 gene in allele frequencies. Females bearing C allele infected by HBV had an increased
Table 3. Association results for SNPs between Clear and CHB patients.
Polymorphisms Allele Clear (n = 382) CHB (n = 493) Clear vs.CHB
P OR (95%CI)
rs11866328 TT 22 (0.06) 17 (0.04)
TG 123 (0.32) 159 (0.32) 0.482 1.451 (0.515–4.088)a
GG 237 (0.62) 317 (0.64) 0.416 1.441 (0.598–3.476)b
GG+TG 360 (0.94) 476 (0.96) 0.376 1.483 (0.619–3.552)c
T 167 (0.22) 193 (0.20)
G 597 (0.78) 793 (0.80) 0.404 1.139 (0.839–1.548)d
rs10845858 AA 59 (0.15) 87 (0.18)
AG 205 (0.54) 254 (0.51) 0.399 0.800 (0.476–1.344)a
GG 118 (0.31) 152 (0.31) 0.537 0.837 (0.477–1.471)b
AG+GG 323 (0.85) 406 (0.82) 0.406 0.817 (0.507–1.316)c
A 323 (0.42) 428 (0.43)
G 441 (0.58) 558 (0.57) 0.736 0.958 (0.747–1.229)d
rs1041236 TT 208 (0.55) 253 (0.51)
TC 154 (0.40) 198 (0.40) 0.381 0.857 (0.608–1.210)a
CC 20 (0.05) 42 (0.09) 0.785 1.108 (0.528–2.325)b
TC+CC 174 (0.45) 250 (0.49) 0.326 0.837 (0.587–1.193)c
T 570 (0.75) 704 (0.71)
C 194 (0.25) 282 (0.29) 0.490 0.905 (0.683–1.200)d
rs2013562 CC 81 (0.21) 98 (0.20)
CT 187 (0.49) 246 (0.50) 0.150 1.421 (0.881–2.293)a
TT 114 (0.30) 149 (0.30) 0.286 1.393 (0.758–2.560)b
CT+TT 301 (0.79) 395 (0.80) 0.158 1.392 (0.880–2.202)c
C 349 (0.46) 442 (0.45)
T 415 (0.54) 544 (0.55) 0.654 1.059 (0.824–1.360)d
rs7861010 AA 30 (0.08) 32 (0.06)
susceptibility to CHB compared with those T allele carriers (OR, 0.445; 95% CI, 0.253
–
0.784;
P
= 0.005). A slight difference was observed at SNP rs1041236 located in GPA33 gene in
geno-type distribution at p
<
0.05. Females carrying TT homozygote had higher susceptible to CHB
compared with CC carriers under the additive model (OR, 0.099; 95% CI, 0.010
–
0.968;
P
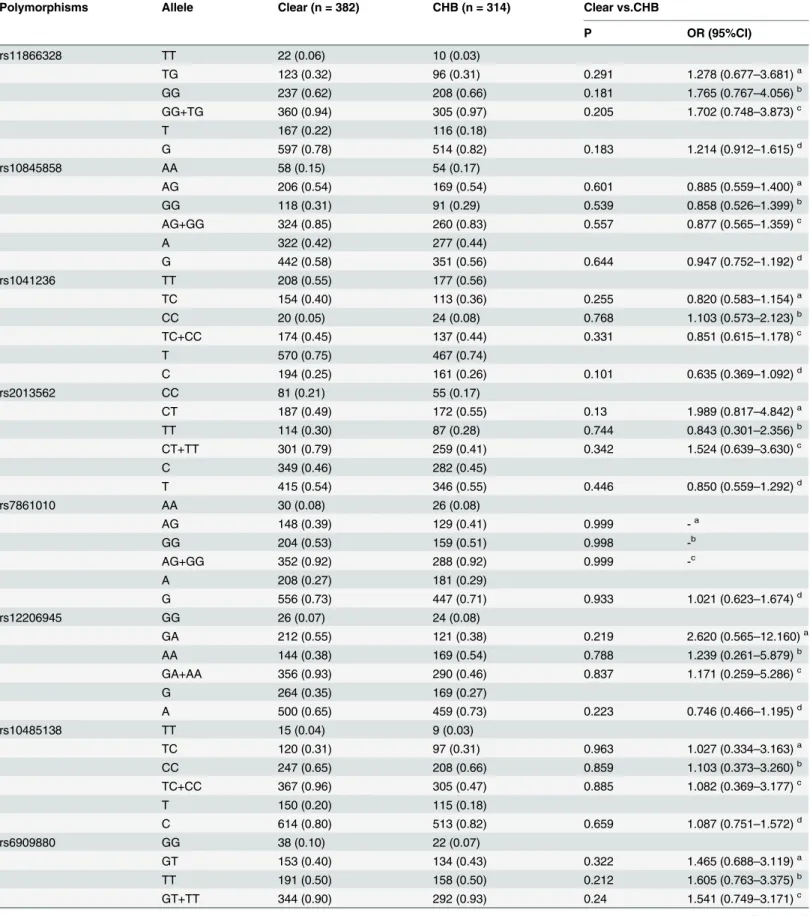
= 0.047). The significance do not survived after Bonferroni correction. To decrease age
dis-tinction, an analysis for patients equal or over 35 years was performed, and no significant
dif-ference was found (Table 6). Three SNPs (rs12206945, rs10485138 and rs10485138) were all
located in ASCC3 gene in Chr 6. Though these three SNPs had no significant associations with
CHB, we further constructed the linkage disequilibrium (LD) using HaploView 4.2 software
using frequencies obtained from the Clear group (n = 382). Strong LD was not detected
between these three SNPs (D
’
<
0.25, and r
2<
0.01
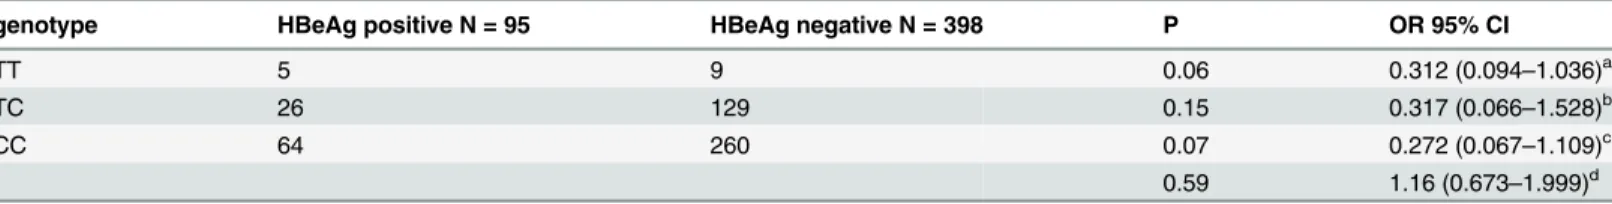
Fig 1). We further calculated association
between SNP rs10485138 and HBeAg status in CHB group. Logistic regression under 3
differ-ent genetic models (Dominant model, Recessive model and Additive model) was used.
Com-pared with HBeAg negative patients, no significance was found (results were listed in
Table 7).
Table 3. (Continued)
Polymorphisms Allele Clear (n = 382) CHB (n = 493) Clear vs.CHB
P OR (95%CI)
AG 148 (0.39) 203 (0.41) 0.906 1.046 (0.497–2.201)a
GG 204 (0.53) 258 (0.53) 0.579 0.813 (0.392–1.688)b
AG+GG 352 (0.92) 461 (0.94) 0.719 0.885 (0.457–1.716)c
A 208 (0.27) 267 (0.27)
G 556 (0.73) 719 (0.73) 0.188 0.826 (0.621–1.098)d
rs12206945 GG 26 (0.07) 38 (0.08)
GA 144 (0.38) 185 (0.38) 0.894 1.055 (0.482–2.308)a
AA 212 (0.55) 270 (0.54) 0.777 0.894 (0.410–1.947)b
GA+AA 356 (0.93) 455 (0.92) 0.925 0.966 (0.468–1.994)c
G 264 (0.35) 261 (0.26)
A 500 (0.65) 725 (0.74) 0.321 0.863 (0.644–1.155)d
rs10485138 TT 15 (0.04) 14 (0.03)
TC 120 (0.31) 155 (0.31) 0.669 1.285 (0.407–4.058)a
CC 247 (0.65) 324 (0.66) 0.896 1.077 (0.352–3.291)b
TC+CC 367 (0.96) 479 (0.97) 0.779 1.164 (0.404–3.351)c
T 150 (0.20) 183 (0.19)
C 614 (0.80) 803 (0.81) 0.255 0.826 (0.595–1.148)d
rs6909880 GG 38 (0.10) 32 (0.06)
GT 153 (0.40) 186 (0.38) 0.303 1.456 (0.712–2.975)a
TT 191 (0.50) 275 (0.56) 0.837 0.926 (0.446–1.924)b
GT+TT 344 (0.90) 461 (0.94) 0.791 1.092 (0.569–2.099)c
G 229 (0.30) 250 (0.25)
T 535 (0.70) 736 (0.75) 0.817 0.968 (0.738–1.271)d
SNP: single nucleotide polymorphisms, Clear: spontaneously recovered individuals with history of HBV infection, CHB: chronic hepatitis B patients. P values, ORs and 95% CIs were calculated by multiple logistic regression adjusting for gender and age; - means differences could not be detected.
ameans additive model: the
first genotype/the second genotype
bmeans additive model: the
first genotype/the third genotype
cmeans recessive model: the
first genotype/the second +the third genotype
dmeans allele model.
Table 4. Stratification analysis for sex between Clear and CHB in male patients.
Polymorphisms Allele Clear (n = 174) CHB (n = 408) Clear vs.CHB
P OR (95%CI)
rs11866328 TT 11 (0.06) 11 (0.03)
TG 56 (0.32) 132 (0.32) 0.236 2.020 (0.591–6.907)a
GG 107 (0.62) 265 (0.65) 0.278 1.838 (0.612–5.515)b
GG+TG 163 (0.94) 397 (0.97) 0.247 1.878 (0.646–5.640)c
T 78 (0.22) 154 (0.19)
G 270 (0.78) 662 (0.81) 0.268 1.231(0.852–1.781)d
rs10845858 AA 31 (0.18) 72 (0.18)
AG 91(0.52) 214 (0.52) 0.888 1.047 (0.553–1.983)a
GG 52 (0.30) 122 (0.30) 0.897 0.955 (0.474–1.924)b
AG+GG 143 (0.82) 336 (0.82) 0.988 1.005 (0.562–1.796)c
A 153 (0.44) 358 (0.44)
G 195 (0.56) 458 (0.56) 0.933 0.987 (0.731–1.334)d
rs1041236 TT 96 (0.55) 202 (0.49)
TC 64 (0.37) 170 (0.42) 0.918 1.024 (0.649–1.618)a
CC 14 (0.08) 36 (0.09) 0.879 0.937 (0.405–2.168)b
TC+CC 78 (0.45) 206 (0.51) 0.948 1.014 (0.661–1.557)c
T 256 (0.74) 574 (0.70)
C 92 (0.26) 242 (0.30) 0.952 0.990 (0.699–1.385)d
rs2013562 CC 43 (0.25) 81 (0.20)
CT 86 (0.49) 197 (0.48) 0.171 1.492 (0.842–2.647)a
TT 45 (0.26) 130 (0.32) 0.14 1.705 (0.839–3.465)b
CT+TT 131 (0.75) 327 (0.80) 0.145 1.487 (0.872–2.536)c
C 172 (0.49) 359 (0.44)
T 176 (0.51) 457 (0.56) 0.211 1.214 (0.896–1.645)d
rs7861010 AA 10 (0.06) 31 (0.08)
AG 66 (0.38) 148 (0.36) 0.083 0.421 (0.158–1.120)a
GG 98 (0.56) 229 (0.56) 0.111 0.486 (0.200–1.181)b
AG+GG 164 (0.94) 377 (0.92) 0.078 0.467 (0.200–1.089)c
A 86 (0.25) 210 (0.26)
G 262 (0.75) 606 (0.74) 0.996 -d
rs12206945 GG 10 (0.06) 34 (0.08)
GA 61 (0.35) 131 (0.32) 0.32 0.591 (0.210–1.665)a
AA 103 (0.59) 243 (0.60) 0.492 0.713 (0.272–1.870)b
GA+AA 164 (0.94) 374 (0.92) 0.383 0.663 (0.263–1.669)c
G 81 (0.23) 199 (0.24)
A 267 (0.77) 616 (0.76) 0.389 0.852 (0.593–1.226)d
rs10485138 TT 7 (0.04) 11 (0.03)
TC 46 (0.26) 108 (0.26) 0.943 1.054 (0.246–4.513)a
CC 121 (0.70) 289 (0.71) 0.814 1.165 (0.327–4.151)b
TC+CC 167 (0.96) 397 (0.49) 0.832 1.140 (0.339–3.837)c
T 60 (0.17) 130 (0.16)
C 288 (0.83) 686 (0.84) 0.717 1.078 (0.718–1.620)d
rs6909880 GG 17 (0.10) 26 (0.06)
GT 71 (0.41) 147 (0.36) 0.253 1.726 (0.677–4.405)a
TT 86 (0.49) 235 (0.58) 0.988 1.007 (0.405–2.504)b
GT+TT 157 (0.90) 382 (0.47) 0.627 1.229 (0.536–2.818)c
Discussion
In this study, we performed a hospital-based case-control study to find susceptible SNPs to
HBV persistence in Han Chinese population, including 382 Clears and 493 CHB. Eight SNPs,
which were top predictors of HBV progression in our previous GWAS, were genotyped by
using TaqMan method. SNP rs10485138 located in ASCC3 gene had significant associations
with CHB only in female patients. It is the first report about correlation between ASCC3 gene
and persistent HBV infection.
Xu et al[28] examined Han Chinese population substructures in a diverse set of over 1700
Han Chinese samples collected from 26 administrative regions of China. Results showed that
Han Chinese population is intricately substructured, with the main observed clusters
corre-sponding roughly to northern Han (northern of Yangtze River), central Han (Shanghai,
Jiangsu and Anhui province), and southern Han (southern of Yangtze River). All our
partici-pants were inquired birthplace, past and current residency at enrolment. They were all born
from Hubei province (southern of Yangtze River), and were permanent resident. So we
con-clude that participants had relatively stable genetic backgrounds.
It is well documented that men are more easily to be infected with HBV than women [29].
Prevalence of HBsAg is significantly higher for males (8.6%) than females (5.7%) in China
[27]. Reasons for gender discrepancy are complex. Some reports displayed that sex hormones
might interact with HBV infection process and lead to a sex disparity. Wang et al. evaluated
sex disparity of HBV infection by using HBV transgenic mice and cell culture system, and
found ligand-stimulated androgen receptor could increase transcription of HBV RNAs
through its transcription activation domain[30]. Wang et al. also found estrogen can repress
transcription of HBV genes by up-regulating estrogen receptor-
α
, which interacts with and
alters binding of hepatocyte nuclear factor-4
α
to the HBV enhancer I by using transgenic mice
and HepG2 cells.[31]. There were more men than women in our CHB group than Clear group.
To decrease bias of gender on effect estimates, we conducted the stratified analysis for sex. For
SNP rs10485138 located in ASCC3 gene, a notable association was found in allele analysis for
females. The proportions of the T and C allele were 31% and 69% respectively in CHB group,
which were significantly different from those in Clear group (22% and 78% respectively). For
SNP rs10485138, associations in genotype distributions for females and analysis for males and
full sample were not observed. Hence, we only concluded that genetic variant rs10845858 in
ASCC3 gene might slightly affect HBV persistence in Han Chinese females. The small sample
for female HBV patients in this study might be the major reason for this weak association in
female Chinese. More female samples and subjects from multiple areas are needed to verify the
Table 4. (Continued)
Polymorphisms Allele Clear (n = 174) CHB (n = 408) Clear vs.CHB
P OR (95%CI)
G 105 (0.30) 199 (0.24)
T 243 (0.70) 617 (0.76) 0.564 1.103 (0.791–1.537)d
SNP: single nucleotide polymorphisms, Clear: spontaneously recovered individuals with history of HBV infection, CHB: chronic hepatitis B patients. P values, ORs and 95% CIs were calculated by multiple logistic regression adjusting for age; - means differences could not be detected.
ameans additive model: the
first genotype/the second genotype
bmeans additive model: the
first genotype/the third genotype
cmeans recessive model: the
first genotype/the second +the third genotype
dmeans allele model.
Table 5. Stratification analysis for sex between Clear and CHB in female patients.
Polymorphisms Allele Clear (n = 208) CHB (n = 85) Clear vs.CHB
P OR (95%CI)
rs11866328 TT 11 (0.05) 6 (0.07)
TG 67 (0.32) 27 (0.32) 0.911 1.166 (0.080–17.071)a
GG 130 (0.63) 52 (0.61) 0.334 0.441 (0.084–2.321)b
TG+GG 197 (0.95) 79 (0.93) 0.410 0.502 (0.097–2.590)c
T 89 (0.21) 39 (0.23)
G 327 (0.79) 131 (0.77) 0.468 0.807 (0.453–1.439)d
rs10845858 AA 27 (0.13) 15 (0.18)
AG 115 (0.55) 40 (0.47) 0.108 0.430 (0.153–1.204)a
GG 66 (0.32) 30 (0.35) 0.486 0.648 (0.191–2.195)b
AG+GG 181 (0.44) 70 (0.41) 0.115 0.477 (0.190–1.198)c
A 169 (0.41) 70 (0.41)
G 247 (0.59) 100 (0.59) 0.777 0.932 (0.573–1.516)d
rs1041236 TT 112 (0.54) 51 (0.60)
TC 90 (0.43) 28 (0.33) 0.409 0.639 (0.221–1.849)a
CC 6 (0.03) 6 (0.07) 0.047 0.099 (0.0010–0.968)b
TC+CC 96 (0.46) 34 (0.40) 0.978 0.987 (0.380–2.562)c
T 314 (0.75) 130 (0.76)
C 102 (0.25) 40 (0.24) 0.492 1.304 (0.613–2.770)d
rs2013562 CC 38 (0.18) 17 (0.2)
CT 101 (0.49) 49 (0.58) 0.363 1.594 (0.583–4.357)a
TT 69 (0.33) 19 (0.22) 0.991 0.990 (0.173–5.673)b
CT+TT 170 (0.82) 68 (0.4) 0.597 1.308 (0.483–3.544)c
C 177 (0.43) 83 (0.49)
T 239 (0.57) 87 (0.51) 0.421 0.819 (0.502–1.334)d
rs7861010 AA 20 (0.10) 1 (0.01)
AG 82 (0.39) 55 (0.65) 0.994 -a
GG 106 (0.51) 29 (0.34) 0.992 -b
AG+GG 188 (0.90) 84 (0.99) 0.994 -c
A 122 (0.29) 57 (0.34)
G 294 (0.71) 11 (0.66) 0.836 1.078 (0.530–2.192)d
rs12206945 GG 16 (0.08) 4 (0.05)
GA 83 (0.40) 54 (0.63) 0.382 2.185 (0.379–12.584)a
AA 109 (0.52) 27 (0.32) 0.620 1.624 (0.239–11.051)b
GA+AA 192 (0.92) 81 (0.95) 0.502 1.773 (0.334–9.418)c
G 115 (0.28) 62 (0.36)
A 301 (0.72) 108 (0.64) 0.349 0.773 (0.451–1.324)d
rs10485138 TT 8 (0.04) 3 (0.04)
TC 74 (0.36) 47 (0.55) 0.385 0.232 (0.009–6.243)a
CC 126 (0.60) 35 (0.41) 0.187 0.096 (0.003–3.110)b
TC+CC 200 (0.96) 82 (0.96) 0.239 0.161 (0.008–3.369)c
T 90 (0.22) 53 (0.31)
C 326 (0.78) 117 (0.69) 0.005 0.445 (0.253–0.784)d
rs6909880 GG 21 (0.10) 6 (0.07)
GT 81 (0.39) 39 (0.46) 0.804 1.177 (0.326–4.246)a
TT 106 (0.51) 40 (0.47) 0.636 0.720 (0.185–2.808)b
GT+TT 187 (0.90) 79 (0.93) 0.838 0.888 (0.286–2.755)c
association in future. SNP rs10485138 was selected from a GWAS for HBV progression, which
was performed by using DNA pools. Each pool was constructed by tens of participants. Specific
information of each participant could not be obtained. So genotype frequencies of each SNP
for males and females separately in the original GWAS study were not distinct. Genetic
predis-position of SNP rs10485138 for other viruses or diseases was not found in PubMed database.
So reasons why there is a difference between male and female for HBV infection need to be
fur-ther studied.
Most HBV carriers are considered to be infected through maternal transmission in the
neo-natal period or infancy in high prevalent areas particularly in China [32
–
34]. The likelihood of
developing CHB depends on age at the time of infection: 80
–
90% of infants infected during the
first year of life and 30
–
50% of those aged under 5 years and less than 5% of healthy adults[5].
A relation about age and acute hepatitis B virus infection by McMnhon et al found that the risk
of becoming a HBV carrier was inversing related to age of the patient at the time of infection
[35]. In CHB group, minimum age was 16 and 79 patients were less than 35, while in Clear
group, all subjects were 35 years or older to ensure spontaneously recovered from HBV
infec-tion. To decrease bias of age on effect estimates, a stratified analysis for age was performed. As
a viral factor, hepatitis B e antigen (HBeAg) status was an important factor that associated with
chronic HBV infection. A report about HBeAg and vertical transmission found that
approxi-mately 90% of HBeAg-seropositive mothers (with high viral load) transmit hepatitis B virus to
their offspring compared with 10
–
20% of HBeAg-seronegative carrier mothers[36]. In this
analysis, ninety-five CHB patients were HBeAg positive status. SNP rs10485138 had modest
susceptibility with persistent HBV infection in females. We further calculated association
between SNP rs10485138 and HBeAg status in CHB group. Significant association was not
found. This phenomenon might be in accordance with viewpoint that genetic background and
viral factor were two independent factors affecting persistent HBV infection.
HBV is a hepadnavirus, which has a strong preference for infecting liver cells. The main
fea-ture of the hepadnavirus replication cycle is the replication of the DNA genome by reverse
transcription of an RNA intermediate. In the cycle, HBV genomes are repaired to form a
cova-lently closed circular DNA (cccDNA), which is the template for viral messenger RNA (mRNA)
transcription. HBV replication cycle is not directly cytotoxic to cells. After infection HBV, host
immune responses to viral antigens are the principal determinants of hepatocellular injury.
T-cell responses, especially the responses of cytotoxic T lymphocytes, play a central role in viral
clearance. Reports about ASCC3 gene display that ASCC3 gene encodes a 3
0-5
0DNA helicase
Table 5. (Continued)
Polymorphisms Allele Clear (n = 208) CHB (n = 85) Clear vs.CHB
P OR (95%CI)
G 123 (0.30) 51 (0.30)
T 293 (0.70) 119 (0.70) 0.220 0.728 (0.439–1.209)d
SNP: single nucleotide polymorphisms, Clear: spontaneously recovered individuals with history of HBV infection, CHB: chronic hepatitis B patients. P values, ORs and 95% CIs were calculated by multiple logistic regression adjusting for age; - means differences could not be detected.
ameans additive model: the
first genotype/the second genotype
bmeans additive model: the
first genotype/the third genotype
cmeans recessive model: the
first genotype/the second +the third genotype
dmeans allele model.
Table 6. Stratification analysis for age35 years between Clear and CHB.
Polymorphisms Allele Clear (n = 382) CHB (n = 314) Clear vs.CHB
P OR (95%CI)
rs11866328 TT 22 (0.06) 10 (0.03)
TG 123 (0.32) 96 (0.31) 0.291 1.278 (0.677–3.681)a
GG 237 (0.62) 208 (0.66) 0.181 1.765 (0.767–4.056)b
GG+TG 360 (0.94) 305 (0.97) 0.205 1.702 (0.748–3.873)c
T 167 (0.22) 116 (0.18)
G 597 (0.78) 514 (0.82) 0.183 1.214 (0.912–1.615)d
rs10845858 AA 58 (0.15) 54 (0.17)
AG 206 (0.54) 169 (0.54) 0.601 0.885 (0.559–1.400)a
GG 118 (0.31) 91 (0.29) 0.539 0.858 (0.526–1.399)b
AG+GG 324 (0.85) 260 (0.83) 0.557 0.877 (0.565–1.359)c
A 322 (0.42) 277 (0.44)
G 442 (0.58) 351 (0.56) 0.644 0.947 (0.752–1.192)d
rs1041236 TT 208 (0.55) 177 (0.56)
TC 154 (0.40) 113 (0.36) 0.255 0.820 (0.583–1.154)a
CC 20 (0.05) 24 (0.08) 0.768 1.103 (0.573–2.123)b
TC+CC 174 (0.45) 137 (0.44) 0.331 0.851 (0.615–1.178)c
T 570 (0.75) 467 (0.74)
C 194 (0.25) 161 (0.26) 0.101 0.635 (0.369–1.092)d
rs2013562 CC 81 (0.21) 55 (0.17)
CT 187 (0.49) 172 (0.55) 0.13 1.989 (0.817–4.842)a
TT 114 (0.30) 87 (0.28) 0.744 0.843 (0.301–2.356)b
CT+TT 301 (0.79) 259 (0.41) 0.342 1.524 (0.639–3.630)c
C 349 (0.46) 282 (0.45)
T 415 (0.54) 346 (0.55) 0.446 0.850 (0.559–1.292)d
rs7861010 AA 30 (0.08) 26 (0.08)
AG 148 (0.39) 129 (0.41) 0.999 -a
GG 204 (0.53) 159 (0.51) 0.998 -b
AG+GG 352 (0.92) 288 (0.92) 0.999 -c
A 208 (0.27) 181 (0.29)
G 556 (0.73) 447 (0.71) 0.933 1.021 (0.623–1.674)d
rs12206945 GG 26 (0.07) 24 (0.08)
GA 212 (0.55) 121 (0.38) 0.219 2.620 (0.565–12.160)a
AA 144 (0.38) 169 (0.54) 0.788 1.239 (0.261–5.879)b
GA+AA 356 (0.93) 290 (0.46) 0.837 1.171 (0.259–5.286)c
G 264 (0.35) 169 (0.27)
A 500 (0.65) 459 (0.73) 0.223 0.746 (0.466–1.195)d
rs10485138 TT 15 (0.04) 9 (0.03)
TC 120 (0.31) 97 (0.31) 0.963 1.027 (0.334–3.163)a
CC 247 (0.65) 208 (0.66) 0.859 1.103 (0.373–3.260)b
TC+CC 367 (0.96) 305 (0.47) 0.885 1.082 (0.369–3.177)c
T 150 (0.20) 115 (0.18)
C 614 (0.80) 513 (0.82) 0.659 1.087 (0.751–1.572)d
rs6909880 GG 38 (0.10) 22 (0.07)
GT 153 (0.40) 134 (0.43) 0.322 1.465 (0.688–3.119)a
TT 191 (0.50) 158 (0.50) 0.212 1.605 (0.763–3.375)b
GT+TT 344 (0.90) 292 (0.93) 0.24 1.541 (0.749–3.171)c
[25], involved in DNA repair, cell proliferation[25] and functioned as a negative regulator of
host defense response[37]. We suppose that ASCC3 gene might take part in HBV replication,
clear or host immune responses to viral antigens. Further functional studies are required to
establish the role of ASCC3 gene in pathogenesis of persistent HBV infection.
Table 6. (Continued)
Polymorphisms Allele Clear (n = 382) CHB (n = 314) Clear vs.CHB
P OR (95%CI)
G 229 (0.30) 178 (0.28)
T 535 (0.70) 450 (0.72) 0.245 1.196 (0.884–1.617)d
SNP: single nucleotide polymorphisms, Clear: spontaneously recovered individuals with history of HBV infection, CHB: chronic hepatitis B patients. P values, ORs and 95% CIs were calculated by multiple logistic regression adjusting for gender; - means differences could not be detected.
ameans additive model: the
first genotype/the second genotype
bmeans additive model: the
first genotype/the third genotype
cmeans recessive model: the
first genotype/the second +the third genotype
dmeans allele model.
doi:10.1371/journal.pone.0141861.t006
Fig 1. Linkage disequilibrium analysis of the SNPs rs12206945, rs10485138, and rs6909880 located in ASCC3 gene in HBV clearance population (n = 382) generated by HaploView 4.2 software.
Supporting Information
S1 Table. Recruitment criteria for chronic hepatitis B (CHB) group and HBV patients who
cleared their infection spontaneously (Clear) group.
(DOCX)
S2 Table. Taqman assay of eight SNPs (rs11866328, rs10845858, rs1041236, rs2013562,
rs786100, rs12206945, rs10485138, rs6909880).
(DOCX)
S3 Table. Results of Hardy-Weinberg equilibrium for eight SNPs (rs11866328, rs10845858,
rs1041236, rs2013562, rs786100, rs12206945, rs10485138, rs6909880).
(DOCX)
Author Contributions
Conceived and designed the experiments: LL JL. Performed the experiments: LL JZ YL.
Ana-lyzed the data: LL JZ. Contributed reagents/materials/analysis tools: CF SL. Wrote the paper:
LL JZ.
References
1. Trepo C, Chan HL, Lok A. Hepatitis B virus infection. Lancet. 2014; 384: 2053–2063. doi:10.1016/ S0140-6736(14)60220-8PMID:24954675
2. Liaw YF, Brunetto MR, Hadziyannis S. The natural history of chronic HBV infection and geographical differences. Antivir Ther. 2010; 15 Suppl 3: 25–33. doi:10.3851/IMP1621PMID:21041901
3. Wang L, Wu XP, Zhang W, Zhu DH, Wang Y, Li YP, et al. Evaluation of genetic susceptibility loci for chronic hepatitis B in Chinese: two independent case-control studies. PLoS One. 2011; 6: e17608. doi:
10.1371/journal.pone.0017608PMID:21408128
4. Zhuang H. Strengthen basic and clinical studies on severe acute exacerbation of chronic hepatitis B. Zhonghua Gan Zang Bing Za Zhi. 2010; 18: 241–242. doi:10.3760/cma.j.issn.1007-3418.2010.04.001
PMID:20460038
5. Tran TT, Gordon SC, Fung S, Dinh P, Yee L, Martins EB, et al. Hepatitis B e antigen status and hepatitis B DNA levels in women of childbearing age with chronic hepatitis B infection screening for clinical trials. PLoS One. 2015; 10: e0121632. doi:10.1371/journal.pone.0121632PMID:25789483
6. He YL, Zhao YR, Zhang SL, Lin SM. Host susceptibility to persistent hepatitis B virus infection. World J Gastroenterol. 2006; 12: 4788–4793. PMID:16937459
7. Bosch J, Brugera M, Rodes J. Familial spread of type-B hepatitis. Lancet. 1973; 2: 457.
8. Obayashi A, Okochi K, Mayumi M. Familial clustering of asymptomatic carriers of Australia antigen and patients with chronic liver disease or primary liver cancer. Gastroenterology. 1972; 62: 618–625. PMID:
5020874
Table 7. Association of SNP rs10485138 with HBeAg status inCHB group.
genotype HBeAg positive N = 95 HBeAg negative N = 398 P OR 95% CI
TT 5 9 0.06 0.312 (0.094–1.036)a
TC 26 129 0.15 0.317 (0.066–1.528)b
CC 64 260 0.07 0.272 (0.067–1.109)c
0.59 1.16 (0.673–1.999)d aadditive model TT/TC
badditive model TT/CC c
recessive model TT/TT+TC
ddominant model TT+TC/CC. Multiple logistic regression under three genetic models with adjustment for gender and age was used to test P value, OR
and 95%CI.
9. Carrilho FJ, Ono-Nita SK, Cardoso RA, Cancado EL, Pinho JR, Alves VA, et al. A prospective study of hepatitis B virus markers in patients with chronic HBV infection from Brazilian families of Western and Asian origin. Braz J Med Biol Res. 2005; 38: 1399–1408. /S0100-879X2005000900015 PMID:
16138224
10. Deng G, Zhou G, Zhang R, Zhai Y, Zhao W, Yan Z, et al. Regulatory polymorphisms in the promoter of CXCL10 gene and disease progression in male hepatitis B virus carriers. Gastroenterology. 2008; 134: 716–726. doi:10.1053/j.gastro.2007.12.044PMID:18325387
11. Li D, Zheng L, Jin L, Zhou Y, Li H, Fu J, et al. CD24 polymorphisms affect risk and progression of chronic hepatitis B virus infection. Hepatology. 2009; 50: 735–742. doi:10.1002/hep.23047PMID:
19610054
12. He XX, Chang Y, Jiang HJ, Tang F, Meng FY, Xie QH, et al. Persistent effect of IFNAR-1 genetic poly-morphism on the long-term pathogenesis of chronic HBV infection. Viral Immunol. 2010; 23: 251–257. doi:10.1089/vim.2009.0102PMID:20565290
13. Lei RX, Shi H, Peng XM, Zhu YH, Cheng J, Chen GH. Influence of a single nucleotide polymorphism in the P1 promoter of the furin gene on transcription activity and hepatitis B virus infection. Hepatology. 2009; 50: 763–771. doi:10.1002/hep.23062PMID:19492430
14. Kamatani Y, Wattanapokayakit S, Ochi H, Kawaguchi T, Takahashi A, Hosono N, et al. A genome-wide association study identifies variants in the HLA-DP locus associated with chronic hepatitis B in Asians. Nat Genet. 2009; 41: 591–595. doi:10.1038/ng.348PMID:19349983
15. Yamada-Fowler N, Fredrikson M, Soderkvist P. Caffeine interaction with glutamate receptor gene GRIN2A: Parkinson's disease in Swedish population. PLoS One. 2014; 9: e99294. doi:10.1371/ journal.pone.0099294PMID:24915238
16. Turner SJ, Mayes AK, Verhoeven A, Mandelstam SA, Morgan AT, Scheffer IE. GRIN2A: an aptly named gene for speech dysfunction. Neurology. 2015; 84: 586–593. doi:10.1212/WNL. 0000000000001228PMID:25596506
17. Bharadwaj R, Peter CJ, Jiang Y, Roussos P, Vogel-Ciernia A, Shen EY, et al. Conserved higher-order chromatin regulates NMDA receptor gene expression and cognition. Neuron. 2014; 84: 997–1008. doi:
10.1016/j.neuron.2014.10.032PMID:25467983
18. Johnstone CN, White SJ, Tebbutt NC, Clay FJ, Ernst M, Biggs WH, et al. Analysis of the regulation of the A33 antigen gene reveals intestine-specific mechanisms of gene expression. J Biol Chem. 2002; 277: 34531–34539. doi:10.1074/jbc.M204865200PMID:12114523
19. Sakamoto J, Kojima H, Kato J, Hamashima H, Suzuki H. Organ-specific expression of the intestinal epi-thelium-related antigen A33, a cell surface target for antibody-based imaging and treatment in gastroin-testinal cancer. Cancer Chemother Pharmacol. 2000; 46 Suppl: S27–32. PMID:10950144
20. Garinchesa P, Sakamoto J, Welt S, Real F, Rettig W, Old L. Organ-specific expression of the colon can-cer antigen A33, a cell surface target for antibody-based therapy. Int J Oncol. 1996; 9: 465–471. PMID:
21541536
21. O'Donoghue JA, Smith-Jones PM, Humm JL, Ruan S, Pryma DA, Jungbluth AA, et al. 124I-huA33 anti-body uptake is driven by A33 antigen concentration in tissues from colorectal cancer patients imaged by immuno-PET. J Nucl Med. 2011; 52: 1878–1885. doi:10.2967/jnumed.111.095596PMID:
22068895
22. Carrasquillo JA, Pandit-Taskar N, O'Donoghue JA, Humm JL, Zanzonico P, Smith-Jones PM, et al. (124)I-huA33 antibody PET of colorectal cancer. J Nucl Med. 2011; 52: 1173–1180. doi:10.2967/ jnumed.110.086165PMID:21764796
23. Sun C, Huo D, Southard C, Nemesure B, Hennis A, Cristina Leske M, et al. A signature of balancing selection in the region upstream to the human UGT2B4 gene and implications for breast cancer risk. Hum Genet. 2011; 130: 767–775. doi:10.1007/s00439-011-1025-6PMID:21660508
24. Winham SJ, Armasu SM, Cicek MS, Larson MC, Cunningham JM, Kalli KR, et al. Genome-wide investi-gation of regional blood-based DNA methylation adjusted for complete blood counts implicates BNC2 in ovarian cancer. Genet Epidemiol. 2014; 38: 457–466. doi:10.1002/gepi.21815PMID:24853948
25. Dango S, Mosammaparast N, Sowa ME, Xiong LJ, Wu F, Park K, et al. DNA unwinding by ASCC3 heli-case is coupled to ALKBH3-dependent DNA alkylation repair and cancer cell proliferation. Mol Cell. 2011; 44: 373–384. doi:10.1016/j.molcel.2011.08.039PMID:22055184
26. Liu L, Li J, Yao J, Yu J, Zhang J, Ning Q, et al. A genome-wide association study with DNA pooling iden-tifies the variant rs11866328 in the GRIN2A gene that affects disease progression of chronic HBV infec-tion. Viral Immunol. 2011; 24: 397–402. doi:10.1089/vim.2011.0027PMID:22004137
27. Liang X, Bi S, Yang W, Wang L, Cui G, Cui F, et al. Epidemiological serosurvey of hepatitis B in China
28. Xu S, Yin X, Li S, Jin W, Lou H, Yang L, et al. Genomic dissection of population substructure of Han Chi-nese and its implication in association studies. Am J Hum Genet. 2009; 85: 762–774. doi:10.1016/j. ajhg.2009.10.015PMID:19944404
29. Almog Y, Klein A, Adler R, Laub O, Tur-Kaspa R. Estrogen suppresses hepatitis B virus expression in male athymic mice transplanted with HBV transfected Hep G-2 cells. Antiviral Res. 1992; 19: 285–293. PMID:1463321
30. Wang SH, Yeh SH, Lin WH, Wang HY, Chen DS, Chen PJ. Identification of androgen response ele-ments in the enhancer I of hepatitis B virus: a mechanism for sex disparity in chronic hepatitis B. Hepa-tology. 2009; 50: 1392–1402. doi:10.1002/hep.23163PMID:19670412
31. Wang SH, Yeh SH, Lin WH, Yeh KH, Yuan Q, Xia NS, et al. Estrogen receptor alpha represses tran-scription of HBV genes via interaction with hepatocyte nuclear factor 4alpha. Gastroenterology. 2012; 142: 989–998 e984. doi:10.1053/j.gastro.2011.12.045PMID:22240483
32. Hall AJ, Peckham CS. Infections in childhood and pregnancy as a cause of adult disease—methods and examples. Br Med Bull. 1997; 53: 10–23. PMID:9158281
33. Stevens CE, Beasley RP, Tsui J, Lee WC. Vertical transmission of hepatitis B antigen in Taiwan. N Engl J Med. 1975; 292: 771–774. doi:10.1056/NEJM197504102921503PMID:1113797
34. Wang J, Zhu Q, Zhang X. Effect of delivery mode on maternal-infant transmission of hepatitis B virus by immunoprophylaxis. Chin Med J (Engl). 2002; 115: 1510–1512.
35. McMahon BJ, Alward WL, Hall DB, Heyward WL, Bender TR, Francis DP, et al. Acute hepatitis B virus infection: relation of age to the clinical expression of disease and subsequent development of the car-rier state. J Infect Dis. 1985; 151: 599–603. PMID:3973412
36. Okada K, Kamiyama I, Inomata M, Imai M, Miyakawa Y. e antigen and anti-e in the serum of asymptom-atic carrier mothers as indicators of positive and negative transmission of hepatitis B virus to their infants. N Engl J Med. 1976; 294: 746–749. doi:10.1056/NEJM197604012941402PMID:943694