A NEW APPROACH RELATED TO THE CORONA DISCHARGE SURVEILLANCE
Nicolae JULA1
Alexandru SOFRONIA1 Teodor Lucian GRIGORIE1
1
INSOFT Development & Consulting, Bucharest, Romania
Abstract: The paper presents a new solution used to detect the Corona discharge, based on the data fusion from two CCD (charge coupled device) image sensors used in UV and visible spectrum. The potential of the method comes from the fact that the Corona discharge is caused by a very intense electrical field, which ionizes the surrounding air and generates a discharge light, detectable by both CCD sensors, in UV and visible spectrum. The image of the Corona discharge pass from the same lens, and using a beam splitter is directed to the two CCD sensors. Further, the UV and visible images are processed, the fusion of the
obtained results leading to the exact positioning of the Corona discharge in the scanned area of interest. The optical detection system is integrated in an Unmanned Aerial Vehicle (UAV), and, together with the telemetry data (global coordinates, speed, attitude angles, …), transmits to the Ground Control Station (GCS) the data acquired by the sensors installed on board; the most important are the video streams in various spectra, which depend by the specifics of each developed mission. The data are real-time transferred to a Ground Mission Analysis System (GMAS) which realize the processing.
In the paper are successively exposed: the operational concept of the Corona discharge detection by using CCD image sensors, the architecture of the developed optical detection system, and the mechanism used in the image data processing for location and evaluation of Corona discharge.
Keywords: Corona discharge, aerial surveillance, image sensors, data fusion.
Introduction
Corona discharge is known to be one of the most important factors causing power losses in energetic systems ([1]). Also, it may produce electromagnetic interferences with radio communication systems, acoustic interferences and may generate toxic compounds such as nitrogen oxide and ozone ([2]-[4]). Around the world were proposed and developed various mechanisms to detect this phenomenon with the aim to remove the factors that generated it. The problem is relatively difficult both at the level of energetic stations for distribution or transmission, but also at the level of high and medium voltage electrical lines ([2], [3], [5]). Between the methods used to identify this kind of discharge can be specified the measurement of the radio interferences and the hearing of the audible noise ([6], [7]). Unfortunately these methods are strongly influenced by the background noise, and their accuracy is not very good. On the other way, the identification of the sources and accurate positioning of the Corona discharge during the day is extremely difficult because the effect is impossible to be detected in the presence of the sunlight. As an alternative, the overnight survey of the area of interest was identified. The procedure, performed on the ground or in the air, has proven to be often difficult, very expensive and low efficiency. Currently, there is a lot of companies in many countries who made the aerial surveillance of the
Corona discharge by using helicopters with special video cameras ([8]-[12]).
The aerospace industry trend to develop high-performance multirole aerial unmanned platforms, corroborated with the high risks involved by the using of manned aerial vehicle to monitor the aerial power lines, has been initiated a series of research activities related to the integration in such multirole systems of new equipment able to perform the Corona discharge detection and localization. Depending by the complexity of the boarded equipment, and of the used detection algorithms, the systems are more or less expensive, more or less accurate, and with a higher or lower level of automatization.
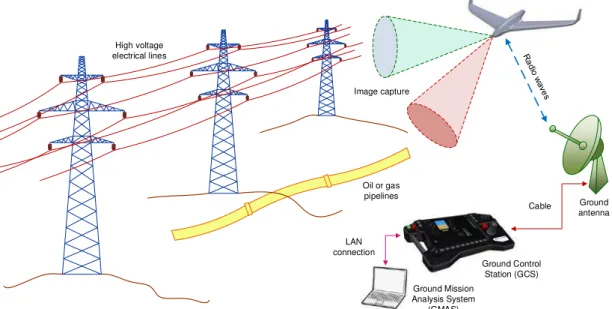
The current paper describes a new solution for the detection of Corona discharge, based on the use of an optical system boarded on an Unmanned Aerial Vehicle (UAV). The solution was developed during a research project financed by Ministry of National Education in Romania, which aimed to create a complex IT&C program for aerial monitoring of the networks that transport energy, oil or gas, in order to automatically detect any potential flaws and evaluate their consequences (Fig. 1). The integrated system includes an optical system boarded on a UAV, able to capture images during its mission, images synchronized in time with the data monitoring the position, speed and attitude of the vehicle, offering in this way the possibility to
225 DOI: 10.21279/1454-864X-16-I2-034
localize very precise the surveyed points with flaws. The data acquired from the instrumentation equipment are sent to the ground together with the telemetry data related to the flight monitoring. The communication with the ground equipment is a bidirectional one, allowing the transmission of data from the aerial platform, but also the control of the vehicle from the ground. The ground equipment realizing all this protocol is a Ground Control Station (GCS). At the ground, the GCS also communicates in real-time with a data processing unit, called Ground Mission Analysis System (GMAS), providing to it the data received from the boarded equipment.
Because the Corona discharge is caused by a very strong electrical field ionizing the surrounding air and generating a luminous discharge, its detection
can be performed by using various CCD (charge coupled device) image sensors integrated into a digital image acquisition and processing system based on the operational concept sown in Fig. 2. The information request is done by the customer and includes the reference area to be flown and details on power lines in this area. In the first phase is performed the mission planning - route planning, is chosen the data acquisition method, and is established the data delivery format. In the next two phases are performed the acquisition, and data processing and analysis, while the last phase is reserved for the reporting. In this last phase are provided to the customer information related to the discharge localization and intensity, so that the customer can plan its intervention in order of priority.
Ground antenna Image capture
Ground Mission Analysis System
(GMAS)
Ground Control Station (GCS)
Cable
LAN connection High voltage
electrical lines
Oil or gas pipelines
Fig. 1 Advanced monitoring system for reducing the losses in the transport of strategic interest utilities
Information request
Information delivery Mission
statement Data acquisition
Data analysis Reporting Customer
Input
Customer Output Operational Concept
Ground monitoring Aerial monitoring
Additional data
Phase 1 Phase 2 Phase 3 Phase 4
Fig. 2 Operational concept
Architecture of the optical detection system
An imagistic system collects radiation emitted from objects to make them visible. The radiation consists of a stream of particles, electromagnetic or acoustic waves. In the classical approach by the computer vision type, the scenes and the lighting are taken and processed, but the visualization systems used in scientific and industrial applications require a
different approach. With the aim to render as clear
is possible the target objectfeatures, a quantitative
relationship between the monitored object and the emitted radiation is necessary to be established. Also, it is very important to make the right choose for the lighting source, proper to the environment in which the system acquires the images.
The CCD sensors play an important role in all imagistic systems, as part of a complex system which allows the image acquisition in special environments, with the needed quality and
accuracy. The part of the electromagnetic
spectrum, which influences the sensitivity of the camera, is dictated by the semiconductor material used in the fabrication of the CCD sensor. CCD sensors have a wide range, starting from sensitivity to ultraviolet radiation until in the infrared spectrum.
226 DOI: 10.21279/1454-864X-16-I2-034
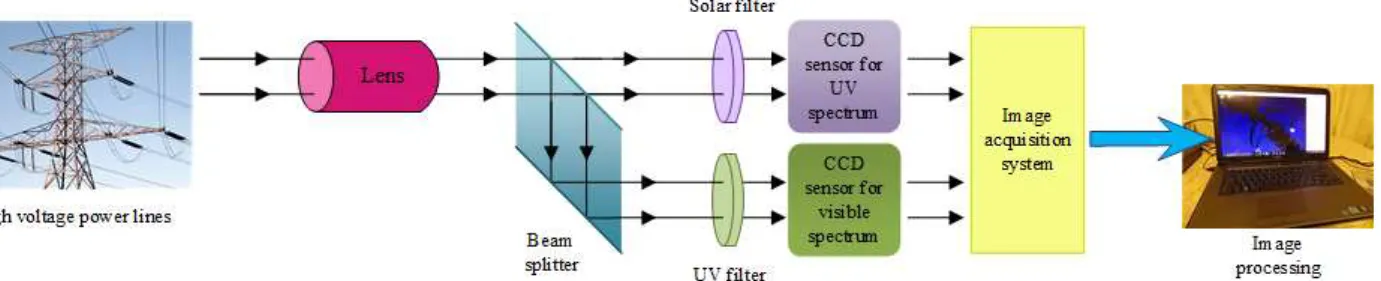
The optical detection system developed for the Corona discharge detection includes two CCD (charge coupled device) image sensors used in UV and visible spectrum (Fig. 3). The image of the discharge pass the same lens, and using a beam splitter is directed to the two CCD sensors. Further, the UV and visible images are processed, the fusion of the obtained results leading to the exact positioning of the Corona discharge in the scanned area of interest.
In fact, the system uses two sensors and only one capture for scene rendering. The light passes through the lens, by using the reflector turns into
two beams in the visible spectrum. One of them,
passed through the UV filter, produces the background of the image, while the other one, filtered through an opaque solar filter, renders the
image of the Corona discharges. The two beams
went through the same lens system, being avoided in this way the parallax effect.
Fig. 3 Architecture of the optical detection system
The image data processing for location and evaluation of Corona discharge
Data pre-processing
At this step, the UV image (Fig. 4) is converted from the RGB space to the gray levels, and is binarized through thresholding (Fig. 5) ([13]).
Fig. 4 UV and optical image
Fig. 5 UV image on the gray levels, and binarized image
Noise reduction
Because the Corona discharges are decentralized and what matters is the central discharge, where the concentration is maximum, the small amplitude points need to be filtered. In this way, on the binarized image are applied some morphological operations to highlight a compact region in the area of interest ([12]).
The most used morphological operations are
dilation and erosion. Dilation adds pixels to the
boundaries of objects in an image, while erosion removes pixels on object boundaries. Usually, the dilation and erosion are used in various combinations, the number of pixels added or removed from the objects in an image depending on the size and shape of the structuring element used to process the image ([14]). Fig. 6 shows the results of the morphological operations in the delimitation and isolation of discharge.
RGB to HSI color conversion
In the HSI (Hue, Saturation, Intensity) space colors, in terms related to the human perception regarding the image interpretation there are three parameters ([13]): 1) Hue is an attribute that describes the pure color; 2) Saturation is a measure of the degree in which a pure color is diluted by the white light; 3) Intensity is a subjective descriptor representing a key factor in the description of the color sensation.
Fig. 6 Results of the morphological operations in the delimitation and isolation of discharge
Given a color image in RGB color, the component
H (hue) of each RGB pixel is obtained with the next
equation
> θ −
≤ θ =
, 360
, G B if G B if
H (1)
227 DOI: 10.21279/1454-864X-16-I2-034
. )] )( ( ) [( 2 / )] ( ) [(
cos 1 2 1/2
− − + − − + − = θ − B G B R G R B R G R (2)
The S component is given by
), , , min( ) ( 3
1 RGB
B G R S + + − = (3)
while the I component results as follows
). ( 3 1 B G R
I= + + (4)
The conversion from RGB in HIS conducted at the next images (Fig. 7), where the second image was obtained through the overlapping of UV band in HSI space by substituting the Intensity.
Fig. 7 RGB to HIS conversion and the overlapping of UV band in HSI space by
substituting the Intensity
Conversion of the colors from HSI to RGB
Given the values of the colors in the HIS space in [0, 1], the obtaining of proper values in RGB space
is dependent by the values of H.
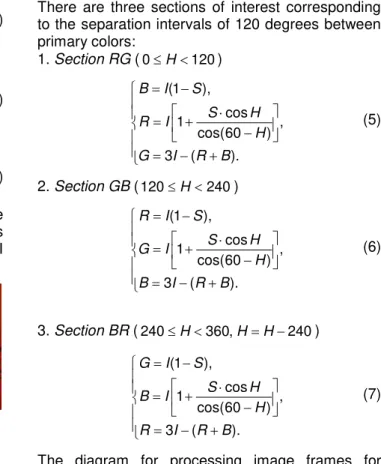
There are three sections of interest corresponding to the separation intervals of 120 degrees between primary colors:
1. Section RG (0≤H<120)
+ − = − ⋅ + = − = ). ( 3 , ) 60 cos( cos 1 ), 1 ( B R I G H H S I R S I B (5)
2. Section GB (120≤H<240)
+ − = − ⋅ + = − = ). ( 3 , ) 60 cos( cos 1 ), 1 ( B R I B H H S I G S I R (6)
3. Section BR (240≤H<360,H=H−240)
+ − = − ⋅ + = − = ). ( 3 , ) 60 cos( cos 1 ), 1 ( B R I R H H S I B S I G (7)
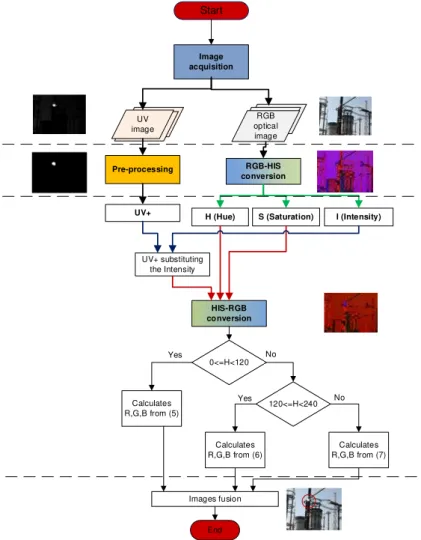
The diagram for processing image frames for locating and evaluating Corona discharges in a dual acquisition system results as in Fig. 8.
228 DOI: 10.21279/1454-864X-16-I2-034
Start
Image acquisition
Pre-processing RGB-HIS conversion
H (Hue) S (Saturation) I (Intensity) UV+
UV+ substituting the Intensity
HIS-RGB conversion UV
image
RGB optical image
0<=H<120
120<=H<240 Calculates
R,G,B from (5)
Yes No
Calculates R,G,B from (7) Calculates
R,G,B from (6)
Yes No
Images fusion
End
Fig. 8 The diagram for processing image frames for locating and evaluating Corona discharges
CONCLUSIONS
The paper presented an approach to detect the Corona discharge, based on the data fusion from two CCD (charge coupled device) image sensors used in UV and visible spectrum. The sensors use the same captured image passed through a beam splitter and parallel filtered by a UV filter and an opaque solar filter. The resulted images are acquired by using an image acquisition system and further processed. The entire system is boarded on an Unmanned Aerial Vehicle (UAV), which, together with the telemetry data (global coordinates, speed, attitude angles, …), transmits to the Ground Control Station (GCS) the data acquired by
the sensors installed on board. At the ground, the GCS also communicates in real time with a data
processing unit, called Ground Mission Analysis System (GMAS), providing to it the data received from the boarded equipment.
BIBLIOGRAPHY
[1] Yahaya, E.A., Jacob, T., Nwohu, M., Abubakar, A., Power loss due to Corona on High Voltage
Transmission Lines, IOSR Journal of Electrical and Electronics Engineering (IOSR-JEEE), Vol. 8, Iss. 3, pp. 14-19, Nov. - Dec. 2013
[2] Braver, S., Corona Inspection of Substations and Lines, High Voltage Design & Installations Forum
IDC Technologies, Perth, Australia, 17-18 October 2012
[3] Holtzhausen, J.P., Vosloo, W.L., High Voltage Engineering - Practice and Theory, ISBN: 978-0-620
3767-7, February 2014
[4] Popovici, D., Lolea, M., High Voltage Technique, University of Oradea, 2011
[5] Hu, B., Ma, L.X., Yuan, S.J., Yang, B. New corona ultraviolet detection system and fault location method,
China International Conference on Electricity Distribution (CICED 2012) Shanghai, 10-14 Sep. 2012
229 DOI: 10.21279/1454-864X-16-I2-034
[6] Mo, J., Xu, Z., Wang, L., Yun, Y., Acoustic Model and Detection Method of Corona Discharge Noise, Chapter in Low-carbon City and New-type Urbanization, Part of the series Environmental Science and Engineering, pp. 101-107, January 2015
[7] Tang, J., Yang, Y.J., Li, Y.S. Prediction of corona effects generated from UHV AC transmission lines: I
Audible noise. High Volt Eng., 36(11), pp. 2679-2686, 2010
[8] PDG Helicopters from UK, http://www.pdghelicopters.com/corona-discharge-patrols.html [9] Chesapeake Bay Helicopters, Inc. from USA, http://www.cbhelos.com/
[10] Aerial vision Africa from South Africa, http://www.aerialvisionafrica.com/
[11] Skywork Helicopters Ltd. From New Zealand, http://www.skyworkhelicopters.com/company/index.cfm [12] Pergam Technical Services from USA, http://pergamusa.com/aerial-power-line-inspection-service/
[13] Gonzalez, R.C., Woods, R., Eddins, S., Digital Image Processing, Prentice Hall, 2008
[14] MathWorks, Morphological Dilation and Erosion, Image Processing Toolbox,
http://www.mathworks.com/help/images/morphological-dilation-and-erosion.html
230 DOI: 10.21279/1454-864X-16-I2-034