Perspective
Response to ‘‘The Reality of Pervasive Transcription’’
Harm van Bakel1, Corey Nislow1,2, Benjamin J. Blencowe1,2, Timothy R. Hughes1,2*
1Banting and Best Department of Medical Research and Terrence Donnelly Centre for Cellular and Biomolecular Research, University of Toronto, Toronto, Ontario,
Canada,2Department of Molecular Genetics, University of Toronto, Toronto, Ontario, Canada
Clark et al. criticize several aspects of our study [1], and specifically challenge our assertion that the degree of pervasive transcription has previously been overstat-ed. We disagree with much of their reasoning and their interpretation of our work. For example, many of our conclu-sions are based on overall sequence read distributions, while Clark et al. focus on transcript units and seqfrags (sets of overlapping reads). A key point is that one can derive a robust estimate of the relative amounts of different transcript types without having a complete recon-struction of every single transcript.
In this brief response, we first revisit what is meant by pervasive transcription, and its potential significance. We then discuss the major points raised by Clark et al. in the order presented in their critique. Finally, we demonstrate that conclusions very similar to those of our original study are reached with a dataset with far greater read depth, obtained by strand-specific sequencing of rRNA-de-pleted total RNA from a single cell type.
The Meaning of ‘‘Pervasive’’, and the Importance of Transcript Abundance
Clark et al. define pervasive transcrip-tion of a genome to mean ‘‘that the majority of its bases are associated with at least one primary transcript’’, which is the same definition used in the ENCODE 1% paper [2]. We believe that this specific claim is not contested, nor is it particularly interesting. First, it has long been assumed that roughly half of the human genome comprises introns [3]. Second, the mech-anisms that control the positions of initiation and termination of Pol II transcription, as well as RNA processing, are imperfect, such that low-level back-ground transcripts from both physiologi-cally relevant and non-canonical sites arise [4–6]. Blockage of surveillance mecha-nisms that normally degrade such
‘‘cryp-tic’’ transcripts greatly increases their abundance [7,8].
We acknowledge that the phrase quoted by Clark et al. in our Author Summary should have read ‘‘stably transcribed’’, or some equivalent, rather than simply ‘‘tran-scribed’’. But this does not change the fact that we strongly disagree with the funda-mental argument put forward by Clark et al., which is that the genomic area corresponding to transcripts is more im-portant than their relative abundance. This viewpoint makes little sense to us. Given the various sources of extraneous sequence reads, both biological and laboratory-derived (see below), it is expected that with sufficient sequencing depth the entire genome would eventually be encompassed by reads. Our statement that ‘‘the genome is not as not as pervasively transcribed as previously reported’’ stems from the fact that our observations relate to the relative quantity of material detected.
Of course, some rare transcripts (and/ or rare transcription) are functional, and low-level transcription may also provide a pool of material for evolutionary tinkering. But given that known mechanisms—in particular, imperfections in termination (see below)—can explain the presence of low-level random (and many non-random) transcripts, we believe the burden of proof is to show that such transcripts are indeed functional, rather than to disprove their putative functionality.
Contradiction of Previous Reports
The fact that our analyses contradict previous reports is precisely why we
emphasized the lack of abundant pervasive transcription in our study. Clark et al. cite papers that have previously documented pervasive transcription, and point out that several different approaches have been used as confirmation. We believe that Clark et al. misinterpret what can be claimed from much of the literature in this area, and fail to acknowledge known weaknesses in some of these studies. We previously reviewed these issues [9]. For example, the number of transfrags detected in permuted tiling array data can be as high as it is in the real data [10]. In addition, a common form of ‘‘validation’’ in these papers is RT-PCR or RACE, but these approaches are generally semi-quantitative at best and are prone to artefacts such as template switching, which readily produces chimeric transcripts in vitro ([11] and references therein). Indeed, we note that in the ENCODE 1% study [2] repeatedly cited by Clark et al., 75 of the 100 negative controls (randomly selected non-transfrag regions) were actually detected by RACE, making the ‘‘validation’’ rate for negative controls only slightly lower than that for the intronic and intergenic transfrags (86%– 88%). Thus, either the tiling arrays or RACE assays are highly error prone. The contention of Clark et al. that ‘‘any estimate of the pervasiveness of transcription re-quires inclusion of all data sources’’ is flawed, because if one introduces erroneous data from even a single source, the estimate becomes worse.
Accuracy of Tiling Arrays
We agree that results obtained from tiling arrays should improve with increased
The Perspective section provides experts with a forum to comment on topical or controversial issues of broad interest.
Citation:van Bakel H, Nislow C, Blencowe BJ, Hughes TR (2011) Response to ‘‘The Reality of Pervasive Transcription’’. PLoS Biol 9(7): e1001102. doi:10.1371/journal.pbio.1001102
Academic Editor:Michael B. Eisen, University of California Berkeley, United States of America PublishedJuly 12, 2011
Copyright: ß2011 van Bakel et al. This is an open-access article distributed under the terms of the Creative Commons Attribution License, which permits unrestricted use, distribution, and reproduction in any medium, provided the original author and source are credited.
Funding:This work was supported by Canadian Institutes of Health Research (CIHR; http://www.cihr-irsc.gc. ca/) Operating Grant to TRH (grant no. 49451). HvB was supported by a CIHR postdoctoral fellowship (grant no. 193588). The funders had no role in study design, data collection and analysis, decision to publish, or preparation of the manuscript.
Competing Interests:The authors have declared that no competing interests exist. * E-mail: t.hughes@utoronto.ca
A
B
C
D
E
F
11.8% 69.6% 4.2% 14.4%
15.7% 74.2% 2.8% 7.3%
Transcribed area
Proportion of read area
Genes 0%
50% 100%
Genes, ESTs, mRNAs
Exon Intron Antisense Intergenic
Read count
Proportion of read mass
Genes 0%
50% 100%
Genes + ESTs, mRNAs
39.5% 43.4%
51.3% 49.6%
2.2% 8.7%
1.4%
3.8% Exon
Intron Antisense Intergenic
TSS
Distance from transcript boundary (kb) -20
-40 -60
-80 TTS 20 40 60 80
Fold-enrichment over baseline
10 20 30 40
0
RNA-Seq Random
0 10 20 30 40 50
Reads / Kb
All reads
>
√ Segment count
0 200 400 600 800
1000 RNA-Seq
Random
Singletons
0 5 10
Reads / Kb
15 20 >
√ Segment count
0 200 400 600 800 1000
log
2
(RPKM) Introns
log2(RPKM) Exons -5
-10
-5 -10 0
0 5
5 10
10 15
15
Sense Antisense gDNA control
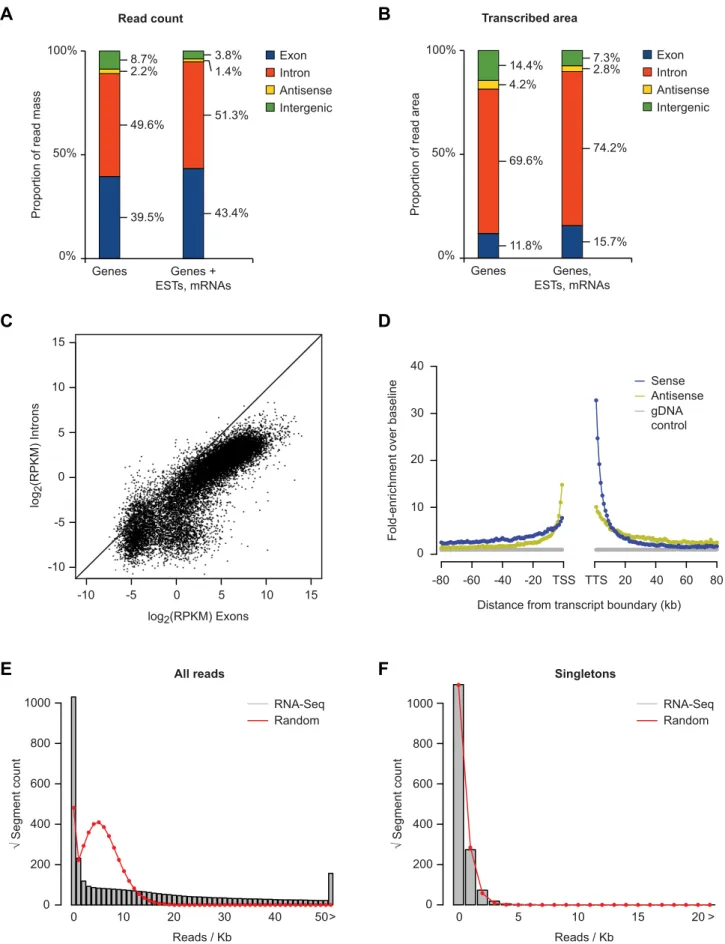
Figure 1. rRNA-depleted RNA-Seq analysis of HEK-293T cells.(A) Proportion of reads with a unique match to known genes (left), or known genes supplemented with mRNAs and spliced ESTs (right). Reads were sequentially matched against a non-redundant set of known genes, mRNA and spliced EST data. Any remaining reads were classified as ‘‘other’’. The known gene set was derived from the UCSC, NCBI, and ENSEMBL genome
tiling probe coverage. Nonetheless, the study by Agarwal et al. [12], which is highlighted by Clarke et al., shows that RNA-Seq is more accurate than tiling arrays, even when using arrays with the 5-nt resolution that Clarke et al. emphasize is important. Agarwal et al. also found that ‘‘about 4 million reads are required to match the sensitivity of two tiling array replicates’’, which is counter to the argu-ments Clarke et al. raise regarding sam-pling artefacts in RNA-Seq (also see below). Even the precision recall curves shown for the new data generated by Clark et al. display a higher AUC for RNA-Seq than for tiling arrays. We believe that previous conclusions based on tiling array data that are not confirmed by RNA-Seq should be revisited.
Depth of Sequencing, Analysis of Poly-A RNA, Dismissal of Introns, and Lack of Strand Specificity
Our previous paper acknowledged these caveats [1], and we included an analysis of previously published rRNA-depleted sam-ples [13], which seems to have been ignored by Clark et al. It is important to note that assessment of the relative abundance of different transcript types would not be greatly affected by the depth of sequencing; it is the detection of very rare transcripts that is compromised.
Most of these concerns can be further addressed with additional data, and we present such an example here. We used strand-specific SOLiD sequencing to an-alyze rRNA-depleted RNA from a homo-geneous cell line (293T cells), obtaining ,131 million uniquely mapping 50-base reads. A conventional estimate is that 1 RPKM (reads per kb per million reads) of mRNA represents approximately one transcript copy per cell in human cells [14]. If we liberally estimate that there could be twice as much ‘‘dark matter’’ as there is mRNA, then 0.5 RPKM would be approximately equivalent to one copy per cell (rRNA, tRNA, snRNA, and snoRNA were removed from this analy-sis). Thus, for a 1-kb transcript present at one copy per cell, we expect,65.5 reads; for one copy per 10 cells, we expect ,6.55 reads, etc.
We repeated our previous analysis pipeline on this dataset, adapting to strand specificity. We find that ,40% of all uniquely mapping reads are from coding exons, and ,50% are from introns (Figure 1A). Measured by area detected by at least one read, the majority of the transcribed area corresponds to introns (Figure 1B). The density of intronic reads is 9.7% that of the exons from the same gene, on average, with a strong correlation between the read count from introns and exons from the same gene over several orders of magnitude (Figure 1C). Given that a typical mRNA is present at one or a few copies per cell, this shows that we are detecting unstable processing intermedi-ates of even rare transcripts. Only,2% of all reads are antisense to genes (Figure 1A), while ,4% are intergenic (taking into consideration areas corresponding to all known genes, ESTs, and mRNAs). As we observed previously, the majority of these intergenic reads (53.6%) are found within 10 kb of a gene end. Figure 1D shows the distribution of intergenic reads relative to gene ends.
The data presented in Figure 1D sug-gest that incomplete termination is likely responsible for transcripts extending far beyond 10 kb, as the enrichment over baseline in the sense orientation after the TTS extends to roughly 30 kb. In addi-tion, at distances from 10 kb to at least 80 kb from gene ends, there is a tendency for intergenic transcripts to be oriented toward the gene being assessed. This is easily explained as a result of incomplete termination from neighboring genes: if the neighboring gene is oriented towards the gene being assessed, it is more likely to produce intergenic transcripts, which will also be oriented towards the gene being assessed. Many antisense transcripts also appear to be explained by incomplete termination of neighboring genes: 54.3% of antisense reads are within 20 kb of the 39end of a neighboring gene.
As we reported previously, the reads per Kb for singleton (i.e., isolated) distal intergenic transcripts (.10 kb from genes) is nearly identical to a Poisson (i.e., random) distribution, while a relatively small number of loci contain dozens to hundreds of reads per Kb (Figure 1E, 1F). As Clark et al. note, assembling full
transcripts from short-read data remains a challenging computational problem. Our initial assessment, however, suggests that many of these transcripts are likely to represent unannotated exons of coding genes, lincRNAs, and enhancer-derived RNAs (unpublished data).
In summary, we disagree with the fundamental assertion that it is the total area of transcribed sequence that is most important. Our published claim that most ‘‘dark matter’’ transcripts can be ex-plained as by-products of the process of transcribing known genes holds: whether they are functional remains to be seen, but the notion that because they exist they are likely to be functional violates Oc-cam’s Razor. We do not dispute that many new independent intergenic tran-scripts may be functional, nor that new functional RNAs can reside within in-trons. Indeed, the discovery of new RNAs is changing our view of how the genome functions and evolves, and the original motivation of our previous study [1] was to identify and characterize novel tran-scripts. Nonetheless, in contrast to the conclusions of previous studies, we ob-serve that the abundance of ‘‘dark matter’’ transcripts is low, in aggregate, and the number of well-supported inde-pendent RNAs is still relatively small. It is also worth noting that a recently quoted estimate for the total number of GEN-CODE lincRNAs is ,12,000 [15]. This number is substantially smaller than the number of known genes and ncRNAs, and given that lincRNA genes are typi-cally shorter than protein coding genes [16], the number of lincRNA exons is an order of magnitude less than the number of known exons of protein-coding genes— which only represent ,2% of the ge-nome. In our view, a compelling wealth of evidence now supports our statement that ‘‘the genome is not as pervasively tran-scribed as previously reported’’. We believe that the results from our study will facilitate more focused efforts directed at the characterization of biologically important transcripts.
Acknowledgments
We thank Eduard Nedea for the preparation of the RNA-Seq samples.
databases and did not include any lincRNA annotations or processed transcripts. (B) Same as in (A), but considering the total amount of transcribed genomic area. (C) Correlation between RPKB (reads per Kb) for introns and exons of known genes. (D) Relative enrichment of RNA-Seq read frequency in intergenic regions as a function of the distance to 59and 39ends of annotated genes in the human genome. The median of read frequencies in either orientation between 80 and 100 kb was used as baseline. (E) Rootograms showing the distribution of the total number of RNA-Seq reads per kb of intergenic sequence outside 10-kb gene-flanking regions, compared to the expected random distribution for the same number of reads (red line). (F) Same as (E), but considering only intergenic transcribed regions with single-read coverage (singletons).
doi:10.1371/journal.pbio.1001102.g001
References
1. van Bakel H, Nislow C, Blencowe BJ, Hughes TR (2010) Most ‘‘dark matter’’ transcripts are associ-ated with known genes. PLoS Biol 8: e1000371. doi:10.1371/journal.pbio.1000371.
2. Consortium EP, Birney E, Stamatoyannopoulos JA, Dutta A, Guigo R, et al. (2007) Identification and analysis of functional elements in 1% of the human genome by the ENCODE pilot project. Nature 447: 799–816.
3. Wong GK, Passey DA, Yu J (2001) Most of the human genome is transcribed. Genome Res 11: 1975–1977.
4. Struhl K (2007) Transcriptional noise and the fidelity of initiation by RNA polymerase II. Nat Struct Mol Biol 14: 103–105.
5. Banerjee A, Sammarco MC, Ditch S, Wang J, Grabczyk E (2009) A novel tandem reporter quantifies RNA polymerase II termination in mammalian cells. PLoS ONE 4: e6193. doi: 10.1371/journal.pone.0006193.
6. Zhang Z, Xin D, Wang P, Zhou L, Hu L, et al. (2009) Noisy splicing, more than expression regu-lation, explains why some exons are subject to nonsense-mediated mRNA decay. BMC Biol 7: 23. 7. Wyers F, Rougemaille M, Badis G, Rousselle JC, Dufour ME, et al. (2005) Cryptic pol II transcripts are degraded by a nuclear quality control pathway involving a new poly(A) polymerase. Cell 121: 725–737.
8. Belostotsky D (2009) Exosome complex and pervasive transcription in eukaryotic genomes. Curr Opin Cell Biol 21: 352–358.
9. van Bakel H, Hughes TR (2009) Establishing legitimacy and function in the new transcriptome. Brief Funct Genomic Proteomic 8: 424–436. 10. Royce TE, Rozowsky JS, Bertone P, Samanta M,
Stolc V, et al. (2005) Issues in the analysis of oligonucleotide tiling microarrays for transcript mapping. Trends Genet 21: 466–475. 11. Houseley J, Tollervey D (2010) Apparent
non-canonical trans-splicing is generated by reverse
transcriptase in vitro. PLoS ONE 5: e12271. doi:10.1371/journal.pone.0012271.
12. Agarwal A, Koppstein D, Rozowsky J, Sboner A, Habegger L, et al. (2010) Comparison and calibration of transcriptome data from RNA-Seq and tiling arrays. BMC Genomics 11: 383. 13. Armour CD, Castle JC, Chen R, Babak T,
Loerch P, et al. (2009) Digital transcriptome profiling using selective hexamer priming for cDNA synthesis. Nat Methods 6: 647–649. 14. Mortazavi A, Williams BA, McCue K,
Schaeffer L, Wold B (2008) Mapping and quantifying mammalian transcriptomes by RNA-Seq. Nat Methods 5: 621–628. 15. Rusk N (2010) Noncoding transcripts as
expres-sion boosters. Nat Methods 7: 947.
16. Guttman M, Garber M, Levin JZ, Donaghey J, Robinson J, et al. (2010) Ab initio reconstruction of cell type-specific transcriptomes in mouse reveals the conserved multi-exonic structure of lincRNAs. Nat Biotechnol 28: 503–510.