www.ccarevista.ufc.br ISSN 1806-6690
Agronomic performance of ‘BRS’ Itaim cowpea beans at different planting
densities under no-tillage and conventional systems
1Performance do feijão-caupi BRS Itaim em relação à densidade de plantio e sistemas
de semeadura convencional e direta
Milton José Cardoso
2*, Edson Alves Bastos
3, Cândido Athayde Sobrinho
4and Francisco de Brito Melo
5ABSTRACT - Cowpea beans play an important role in Brazilian farming, mainly in northern and northeastern regions, where it is widely grown among smallholder farmers. In recent years, commercial farmers have expanded its cultivation, mostly to the Midwest. This study aimed at evaluating the planting density of ‘BRS Itaim’ black-eyed cowpea beans under conventional (CT) and no-tillage (NT), with 75% mulch in the first year. Two experiments (CT and NT) were conducted at Embrapa Meio-Norte in Teresina - PI (Brazil), during the 2014/2015 harvest. Both experiments were carried out in a randomized block design with four replicates, considering the planting densities (PD) 12, 16, 20, 24, and 28 plants m-2. In both systems, grain yields (GY) and the number of pods per unit area (NPA) responded quadratically to an increase in PD, while a linear decreasing response was observed for the number of pods per unit area. The maximum grain yields (GY) were 1,492 kg ha-1 (23.8 plants m-2) and 1,136 kg ha-1 (23.2 plants m-2) under CT and NT, respectively. The NPA was most correlated with GY, presenting a value of 0.74 (P<0.01). The survival rate of cowpea seedlings was 94% under CT and 88% under NT. This larger reduction under NT
might be attributed to a higher incidence of fungi in the soil under this system (e.g.Furasium solani, Fusarium oxysporum, Macrophomina phaseolina, Pythium spp, Sclerotium rolfsiiand Rhizoctonia solani).
Key words:Yield components. Yield grain.Vigna unguiculata(L.) Walp.
RESUMO - O feijão-caupi desempenha importante papel na produção agrícola brasileira, especialmente no Norte e Nordeste, onde é amplamente cultivado por agricultores familiares. Nos últimos anos, a cultura, vem se expandindo principalmente no Centro-Oeste por agricultores empresariais. O objetivo do trabalho foi avaliar a densidade de plantio de feijão-caupi BRS Itaim, tipo fradinho, sob sistemas de plantio convencional (SPC) e direto (SPD) com cobertura do solo de primeiro ano em torno de 75%. Foram conduzidos dois ensaios (um em SC e outro em SD) na Embrapa Meio-Norte, em Teresina, PI, safra 2014/2015. Nos dois ensaios utilizou-se o delineamento experimental de blocos casualizados com quatro repetições, considerando-se as densidades de plantio (DP) de 12; 16; 20; 24 e 28 plantas m-2. Em ambos os sistemas, as produtividades de grãos (PG) e os componentes de rendimento número de vagens por área (NVA) responderam quadraticamente ao aumento da DP, enquanto a resposta linear decrescente foi observada para o número de vagens por planta. As PG máximas foram de 1.492 kg ha-1 (23,8 plantas m-2) e 1.136 kg ha-1 (23,2 plantas m-2) nos sistemas de SC e SD, respectivamente. O NVA foi o mais correlacionado com a PG com valor 0,74 (P<0,01). A sobrevivência de plantas de feijão-caupi foi de 94% no sistema de SC e de 88% no sistema de SD, sendo a maior redução observada no sistema de semeadura direta atribuída à maior incidência dos fungos de solo (Furasium solani, Fusarium oxysporum, Macrophomina phaseolina, Pythium spp, Sclerotium rolfsii e Rhizoctonia solani).
Palavras-chave:Componentes de produção. Produtividade de grãos.Vigna unguiculata(L.) Walp.
DOI: 10.5935/1806-6690.20170101 *Autor para correspondência
Recebido para publicação em 23/08/2016; aprovado em 02/02/2017
1Embrapa Macroprograma02: 02.14.01.006.00.10.001
2Embrapa Meio-Norte, Grupo Produção Vegetal, Fitotecnia, Piauí-PI, Brasil, milton.cardoso@embrapa.br 3Embrapa Meio-Norte, Grupo Recursos Naturais, Irrigação e Drenagem, Piauí-PI, Brasil, edson.bastos@embrapa.br 4Embrapa Meio-Norte, Grupo Produção Vegetal, Fitopatologia, Piauí-PI, Brasil, candido.athayde@embrapa.br
INTRODUCTION
One of the major problems in cowpea cultivation
regions, mainly in Northeastern and Northern Brazil, is related
to rainfall unevenness together with other factors such as
sandy soils, high temperatures, and inadequate management
measures just as planting density, which contributes to a
low yielding of grains, about 0.22 t ha
-1(CONAB, 2016).
This values are much lower than those beans grown under a
high-tech production system (BRACHTVOGEL
et al
., 2009;
CARDOSO; RIBEIRO, 2006; MAKOI; CHIMPHANGO;
DAKORA, 2009; MATOS FILHO
et al.,
2009; MENDES
et al.,
2007; NJOKU; MUONEKE, 2008; OLIVEIRA
FILHO
et al
., 2016; OROKA; OMEREGIE, 2007).
Cowpea beans have been intensely researched in
recent years, which have been leading to improvements
in both crop yield and its profitability. This scrutiny has
aroused the interest of medium and large farmers (FREIRE
FILHO
et al.
, 2011; OLIVEIRA FILHO
et al
., 2016).
Among the agricultural practices being studied, planting
density (PD) and cropping system (CS), both conventional
(CT) and no-tillage (NT), have stood out. The first refers
to plant spatial arrangements and is the most important to
optimize crop yield since influences the leaf area index,
foliar insertion angle, and the interception of incident light
by plants, particularly in lower canopy layers. Therefore,
PD directly affects solar radiation interception, being one
of the most defining factors of GY. While studying BRS
Guariba, Bezerra
et al
. (2012) observed a 63.8% reduction
in the number of pods per plant (NPP), and 67.6% decrease
in grain yield per plant (GYP), by raising PD in 100 and
500 thousand plants ha
-1, respectively. For BRS Novaera,
Bezerra
et al
. (2014) reported declines of 66.5% and
59.53% in NPP and GY, respectively. Naim, Jabereldar,
and Mohamed (2011), while investigating the PDs of 6,
12, 18, and 24 kg ha
-1, observed an increase in the number
of grains per area, as well as reductions in NPP, 100-grain
weight, GYP, and harvest index.
NT might be considered promising to the detriment
of CT when growing cowpeas by the soil mulching effect
that maintain moisture and contribute to weed control. This
system may also be taken as an alternative to reduce water
deficit risks in crops and improve water use efficiency.
Since soil temperatures are very high in Northeastern
Brazil, a further advantage of an NT relies on the reduction
of soil temperature by mulching, as a protection against
the sunrays, what also would minimize the drastic climatic
effects unfavorable to a crop development (SIMIDU
et al
.,
2010).
Fontes, Oliveira and Rocha (2013) have already
tested the feasibility of growing cowpeas under NT; they
proved that this system showed compatibility with the
regional-recommended CT in terms of both PD and GY.
Furthermore, in a study of irrigated NT, Locatelli
et al
. (2014) pointed the lack of influence on BRS Pajeú yield
components; the same authors reported that BRS Guariba and
BRS Novaera obtained maximum GYs of 1.28 and 1.51 t ha
-1using water depths of 74.3 and 94.0% ET
0, respectively.
The objective of this study was to evaluate the
planting density for ‘BRS Itaim’ cowpea beans under
conventional tillage and no-till with 75% soil mulching
in the first year.
MATERIAL AND METHODS
The study was conducted in a Yellow Argisol
(JACOMINE
et al
., 2013; MELO, ANDRADE JÚNIOR;
PESSOA, 2014) in a rainfed area during the 2014/2015
harvest (March to May of 2015). This area is located
at a property belonging to the Embrapa Meio-Norte, in
Teresina microregion (PI), Brazil. The local geographical
coordinates are 05º02’09.9” S, 42º47’544” W, and 69.0-m
altitude. Soil chemical analysis of samples collected
at 20 cm depth was carried out at the Laboratory of Soil
Fertility (Embrapa Meio-Norte). The analysis showed
the following results: pH (H
2O 1: 2.5) = 5.4; phosphorus
(mg dm
-3) = 4.0; potassium (cmol
c
dm
-3) = 0.14; calcium
(cmol
cdm
-3) = 3.1; magnesium (cmol
c
dm
-3) = 1.4; aluminum
(cmol
cdm
-3) = 0.1, and organic matter (g kg
-1) = 30.1.
Two experiments with cowpea beans (BRS Itaim
cultivar, erect black-eyed
) w
ere installed side by side
in a
randomized block design with four replicates.
One
experiment was carried out under CT
and the other under
NT with 75% soil mulching in the first year
(Figure 1).
Treatments consisted of five planting densities (12, 16, 20,
24, and 28 plants m
-2).
The plots were 5-m long and consisted of four
0.5-m rows. The useful area was composed of the two
central rows. During sowing, on March 25, 2015, surplus
amounts of seeds were sown in the rows and, by occasion
of thinning out, the right amount of plants was maintained
according to the density to be tested. Basal dressing
consisted of 60 kg P
20
5ha
-1(simple superphosphate) and
50 kg K
20 ha
-1(potassium chloride), and N topdressing
of 20 kg ha
-1(simple superphosphate), being applied on
the fifteenth day of sowing. Figure 2 shows the monthly
rainfall (mm) and means of air temperature recorded
during the evaluated crop cycle.
The agronomic traits assessed were pod length
(PL), number of pods per plant (NPP),
number of pods per
unit area (NPA
),
100-grain weight (100-GW; in grams),
seedling survival
(ratio between the initial and final plant
Figure 1 - BRS Itaim cowpea beans under conventional tillage (left) and under no-tillage (right). Teresina, PI. 2014/2015 harvest season. (Photo by Milton José Cardoso)
Figure 2 -Monthly rainfall (mm) and means of air temperature
during the evaluated crop cycle (March-May 2015) of ‘BRS Itaim’ cowpea beans. Teresina, Piauí. Data source: an agrometeorological station located 300 m away from the experimental area
was estimated by the following equation: CGW =
[(100-Mi) x GY)/ (100-Mf)]); wherein, CGW is the corrected
grain weight, Mi is the grain moisture by a moisture
meter (Gehaka, G600i), Mf is the grain moisture to be
corrected (13%). The first four trains were analyzed for
ten pods chosen at random from the useful area of each
treatment. Grain yield (GYHA; kg ha
-1) was determined
by the equation:
GYHA
= (10,000 m
2x
CGW
kg) /
(
useful
m
2). The incidence of diseases, characterized as
root and stem rot, was inspected by counting the number
of symptomatic plants in each plot, thus confirming
etiology at the Laboratory of Plant Pathology, Embrapa
Meio-Norte, Piauí State (Brazil).
First- and second-degree regressions on variance
analysis data were performed for plant densities following
the method described by Pimentel-Gomes (2009) and
Zimmermann (2014). Considering the t-test, the best
model was selected by the significance of each parameter,
accepting a significance level up to 15% probability
(CONAGIN, JORGE, 1982).
The method developed by Alvarez V. and Alvarez
(2003) was also followed, in which an equation is
significant regardless the significance of coefficients.
Nonetheless, the model significance must be explicit in
the equation (for regression coefficient), besides showing
an R
2significance. All statistical analyses were performed
using SAS software (SAS INSTITUTE, 2015).
RESULTS AND DISCUSSION
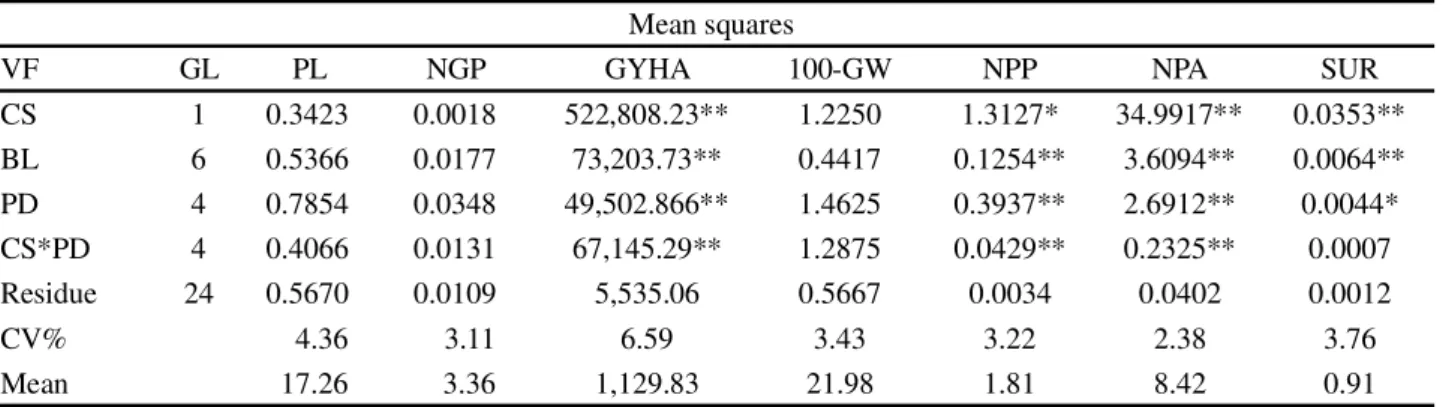
The variance analysis showed significant effects
from planting densities on the number of pods per plant,
number of pods per area, and grain yield (Table 1). The
same trend was registered for the cropping system for the
same traits (Table 2).
By analyzing the interaction between CS x PD, we
noticed an effect (P<0.01) on the yield components NPP,
NPA, and GY. While NPP showed a
linear decreasing
response
, NPA presented a quadratic response when
increasing PD (Figure 3). We observed that by increasing
NPA in one, there was a decrease of 0.181 and 0.073 pods
per plant in CT and NT, respectively. It was a quadratic
response to PD increase, which reached a maximum of
94.72 pods/ m
-2(CT with 22.27 plants/ m
-2) and 64.68
pods/ m
-2(NT with 25.4 plants/ m
-2). (Figure 3).
Bezerra
et al
. (2009), Cardoso; Ribeiro and
Mean squares
VF
GL
PL
NGP
GYHA
100-GW
NPP
NPA
SUR
CS
1
0.3423
0.0018
522,808.23**
1.2250
1.3127*
34.9917**
0.0353**
BL
6
0.5366
0.0177
73,203.73**
0.4417
0.1254**
3.6094**
0.0064**
PD
4
0.7854
0.0348
49,502.866**
1.4625
0.3937**
2.6912**
0.0044*
CS*PD
4
0.4066
0.0131
67,145.29**
1.2875
0.0429**
0.2325**
0.0007
Residue
24
0.5670
0.0109
5,535.06
0.5667
0.0034
0.0402
0.0012
CV%
4.36
3.11
6.59
3.43
3.22
2.38
3.76
Mean
17.26
3.36
1,129.83
21.98
1.81
8.42
0.91
Table 1 - Variance analysis for pod length (PL); number of grains per pod (NGP), grain yield per hectare (GYHA), 100-grain weight (100-GW), number of pods per plant (NPP), number of pods per area (NPA), and seedling survival (SUR) in ‘BRS Itaim’ cowpea beans. Teresina, PI, 2014/2015 harvest season
** (p<0.01) and * (P<0.05), respectively, significant at 1% and 5% level, F- test. CS: cropping system; BL blocks; PD: planting density; CV: coefficient variation
** (P<0.01) and ns: significant at 1% and 5% level by the F- test and non-significant, respectively
Table 2 - Means of pod length (PL), number of grains per pod (NGP), 100-grain weight (100-GW), number of pods per plant (NPP),
number of pods per square meter per area (NPA), seedling survival (SUR), and grain yield (GYHA) in ‘BRS Itaim’ cowpea beans under conventional tillage (CT) and no-tillage (NT). Teresina, PI, 2014/2015 harvest season
System
PL
NGP
GYHA
100-GW
NPP
NPA
SUR
CT
17.35
11.2
1,244
22.15
3.98
87.36
0.94
NT
17.17
11.3
1,015
21.80
2.64
56.07
0.87
F -Test
ns
ns
**
ns
**
**
ns
and pod filling stages. Similar results were observed
by Likewise, Bezerra
et al
. (2008), Cardoso, Ribeiro
and Bastos (2015), Lemma, Worku and Woldemichael
(2009), Naim and Jabereldar (2010), and Távora,
Nogueira and Pinho (2001).
Figure 3 - Number of pods.m-2 and number of pods.plant-1 of ‘BRS Itaim’ cowpea beans under conventional tillage (CT) and no-tillage (NT). Teresina, PI, 2014/2015 harvest season
**and *: significant at 1% and 5% level by the F-test, respectively
Quadratic response of GY by increasing PD
(Figure 4) was observed, with maximum GY values of
1,492 kg ha
-1(23.8 plants m
-2) and 1,136 kg ha
-1(23.2
plants m
-2) under CT and NT, respectively.
In addition, the
same trend was observed by Cardoso and Ribeiro (2006),
Naim and Jabereldar (2010), Bezerra
et al
. (2014), and
Cardoso, Ribeiro and Bastos (2015). Distinctly, Jallow
and Ferguson (1985) observed linear effects by varying
PD from 4 to 25 plants
m
-2in eight cultivars of cowpea
beans.
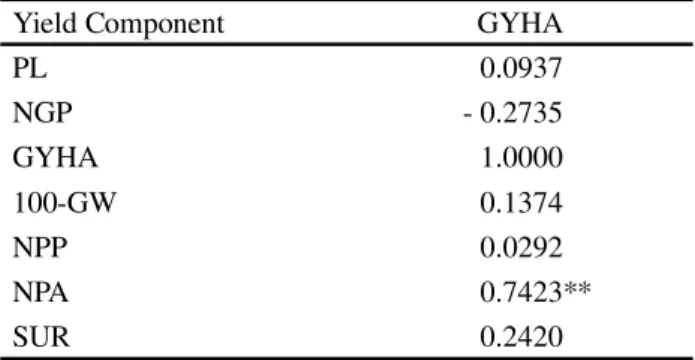
Table 3 highlights that NPA was the yield
component mostly correlated (P<0.01) with grain yield,
presenting an average of 0.74.
Additionally, a higher incidence of soil fungi
was observed in plants under NT when compared to CT
(
Fusarium solani, Fusarium oxysporum, Macrophomina
phaseolina, Pythium spp, Sclerotium rolfsii and
Rhizoctonia solani
), affecting the plant survival, which
was 94% under CT and 88% under NT.
CONCLUSIONS
1. Under a no-tillage system with first year mulching,
increasing plant densities cause a reduction in grain
yield of ‘BRS Itaim’ cowpea beans as well as it favors
soil fungi attack compared to a conventional tillage
system;
2. Grain yield response to planting density is quadratic,
reaching maximum values of 1,492 kg ha
-1(23.8
plants m
-2) and 1,136 kg ha
-1(23.2 plants m
-2) under
conventional and no-tillage systems, respectively. The
yield component mostly correlated with grain yield was
the number of pods per area, with a significant value of
0.74;
3. With the increase of planting density, the yield
components number of pod per plant and number of
pods per area are majorly affected in a no-tillage if
compared to a conventional tillage system;
4. Under both conventional and no-tillage systems, the
number of pods per area is the component mostly
correlated with grain yield.
REFERENCES
ALVAREZ V., V. H. ; ALVAREZ, G. A. M. Apresentação de equações de regressão e suas interpretações. Boletim Informativo da Sociedade Brasileira de Ciência do Solo,
v. 28, n. 3, p. 28-32, 2003.
BEZERRA, A. A. de C.et al. Características de dossel e de
rendimento em feijão-caupi ereto em diferentes densidades populacionais.Pesquisa Agropecuária Brasileira, v. 44, n. 10, p. 1239- 1245, 2009.
BEZERRA, A. A. de C.et al. Comportamento morfoagronômico
de feijão caupi, cv. BRS Guariba, sob diferentes densidades de plantas.Revista de Ciências Agrárias, v. 55, n. 3, p. 184-189,
2012.
BEZERRA, A. A. de C.et al.Morfologia e produção de
feijão-caupi, culvivar BRS Novaera, em função da densidade de plantas.
Revista Caatinga, v. 27, n. 4, p. 135-141, 2014.
BEZERRA, A. A. de C.et al. Morfologia e produção de grãos
em linhagens modernas de feijão-caupi submetidas a diferentes densidades populacionais.Revista de Biologia e Ciências da Terra, v. 8, n. 1, p. 85-93, 2008.
Figure 4 - Grain yield of ‘BRS Itaim’ cowpea beans under conventional tillage (CT) and no-tillage (NT). Teresina, PI, 2014/2015 harvest season
**and *: significant at 1% and 5% level by the F-test, respectively
Yield Component
GYHA
PL
0.0937
NGP
- 0.2735
GYHA
1.0000
100-GW
0.1374
NPP
0.0292
NPA
0.7423**
SUR
0.2420
Table 3 - Pearson’s Correlation for grain yield per hectare
(GYHA), pod length (PL), number of grains per pod (NGP), 100-grain weight (100-GW), number of pods per plant (NPP), number of pods per area (NPA), and seedling survival (SUR) of ‘BRS Itaim’ cowpea beans under conventional tillage (CT) and no-tillage (NT).Teresina, PI, 2014/2015 harvest season
BRACHTVOGEL, E. L. et al. Densidades populacionais de milho em arranjos espaciais convencional e equidistante entre plantas.Ciência Rural, v. 39, n. 8, p. 2334-2339, 2009. CARDOSO, M. J.; RIBEIRO, V. Q. Desempenho agronômico do feijão caupi, cv. Rouxinol, em função de espaçamentos entre linhas e densidades de plantas sob regime de sequeiro.Revista Ciência Agronômica, v. 37, n. 1, p. 102-105, 2006.
CARDOSO, M. J.; RIBEIRO, V. Q.; BASTOS, E. A. Densidades de plantas de feijão-caupi de porte semi-prostrado sob irrigação. Teresina: Embrapa Meio-Norte, 2015. 21 p. (Boletim de Pesquisa e Desenvolvimento. Embrapa Meio-Norte, 110) COMPANHIA NACIONAL DE ABASTECIMENTO.
Acompanhamento da safra brasileira: grãos: safra
2015/2016: oitavo levantamento. Brasília, v. 8, p. 1-178, maio 2016. Available at: <http://www.conab.gov.br/ OlalaCMS/uploads/arquivos/16_07_29_15_12_51_boletim_ graos_julho_2016.pdf > Accessed on: Aug. 08, 2016. CONAGIN, A.; JORGE, J. P. N. de. Delineamento (1/5)(5x5x5) em blocos. Bragantia, v. 41, n. 16, p. 155-168. 1982.
FONTES, J. R. A.; OLIVEIRA, I. J. de; ROCHA, R. N. C. da. Produção de feijão-caupi em diferentes sistemas de manejo do solo no amazonas. In: CONGRESSO NACIONAL DE
FEIJÃO CAUPI, 3., 2013, Recife. Resumos expandidos...
Recife: IPA: Embrapa, 2013.
FREIRE FILHO, F. R. et al. Feijão-caupi no Brasil:
produção, melhoramento genético, avanços e desafios. Teresina: Embrapa Meio-Norte, 2011, 84 p.
JACOMINE, P. K. T.et al.Sistema brasileiro de classificação de solos. 3. ed. rev. ampl. Brasília, DF: Embrapa, 2013. 353 p. JALLOW, A. T.; FERGUSON, T. U. Effects on planting density and cultivar of seed yield of cowpeas (Vigna unguiculata(L.) Walp.) in
Trinidad.Tropical Agriculture, v. 62, n. 2, p. 121-124, 1985. LEMMA, G.; WORKU, W.; WOLDEMICHAEL, A. Moisture and planting density interactions affect productivity in cowpea (Vigna unguiculata).Journal of Agronomy, v. 8, n. 4, p. 117-123, 2009. LOCATELLI, V. da E. R. et al. Componentes de produção,
produtividade e deficiência da irrigação do feijão-caupi no cerrado de Roraima. Revista Brasileira de Engenharia Ambiental, v. 18, n. 6, p. 574-580, 2014.
MAKOI, J. H. J. R.; CHIMPHANGO, S. B. M.; DAKORA, F. D. Effect of legume plant density and mixed culture on symbiotic N 2 fixation in five cowpea [Vigna unguiculata (L.) Walp] genotypes in South Africa.Symbiosis, v. 48, p. 57-67, 2009. MATOS FILHO, C. H. A.et al. Potencial produtivo de progênies
de feijão-caupi com arquitetura ereta de planta.Ciência Rural,
v. 39, n. 2, p. 348 -354, 2009.
MELO, F. de B.; ANDRADE JÚNIOR, A. S.; PESSOA, B. L. de O. Levantamento, zoneamento e mapeamento pedológico detalhado da área experimental da Embrapa Meio-Norte em Teresina, PI. Teresina : Embrapa Meio-Norte, 2014. 47 p. (Embrapa Meio Norte. Documentos, 231).
MENDES, R. M. S. et al. Alterações na relação fonte-dreno em feijão-de-corda submetido a diferentes densidades de plantas.
Revista Ciência Agronômica, v. 36, n. 1, p. 82-90, 2005. NAIM, A. M.; JABERELDAR, A. A. Effect of plant density and cultivar on growth and yield of cowpea (Vigna unguiculata (L.)Walp.). Australian Journal of Basic and Applied Sciences, v. 4, n. 8, p. 3148-3153, 2010.
NAIM, A. M.; JABERELDAR, A. A.; MOHAMED, E. A. Effect of seed rate and cultivar on yield and yields components of cowpea (Vigna unguicula (L.) Walp) in Kordofan of Sudan. International Journal of Currente Research, v. 2, n. 1, p. 142-147, 2011.
NJOKU, D. N.; MUONEKE, C. O. Effect of cowpea planting density on growth, yield and productivity of component crops in cowpea/cassava intercropping system. Journal of Tropical Agriculture, Food Environment and Extension, v. 7, n. 2, p. 106-113, 2008.
OLIVEIRA FILHO, A. F. et al. Eficiência agronômica e
biológica nos consórcios da mamoneira com feijão-caupi ou milho.Revista Ciência Agrônomica, v. 47, n. 4, p. 729-736, 2016.
OROKA, F. O.; OMEREGIE, A. U. Competition in a rice: cowpea intercrop as affected by nitrogen fertilizer and plant population.Scientia Agricola, v. 64, n. 6, p. 621-629, 2007. PIMENTEL-GOMES, F.Curso de estatística experimental.
15. ed. Piracicaba: ESALQ, 2009. 451 p. (Biblioteca de Ciências Agrárias “Luiz de Queiroz”, 15)
SAS INSTITUTE. SAS/STAT® 14.1 User’s Guide. Cary,
2015. Available at: <http://support.sas.com/documentation/cdl/ en/statug/68162/PDF/default/statug.pdf>. Accessed on: Jan. 26, 2016.
SIMIDU, H. M. et al. Efeito do adubo verde e época de
semeadura sobre a produtividade do feijão, em plantio direto em região de cerrado. Acta Scientiarum Agronomy, v. 32, n. 2, p. 309-315, 2010.
TÁVORA, F. J. A. F.; NOGUEIRA, S. L.; PINHO, J. L. N. de. Arranjo e população de plantas em cultivares de feijão-de-corda com diferentes características de copa.Revista Ciência Agronômica, v. 32, p. 69-77, 2001.
ZIMMERMANN, F. J. P. Estatística aplicada à pesquisa agrícola. 2. ed. revisada e ampliada. Brasília, DF: Embrapa;