Perspective
The Reality of Pervasive Transcription
Michael B. Clark1, Paulo P. Amaral1., Felix J. Schlesinger2., Marcel E. Dinger1
, Ryan J. Taft1, John L. Rinn3, Chris P. Ponting4, Peter F. Stadler5, Kevin V. Morris6, Antonin Morillon7, Joel S. Rozowsky8, Mark B. Gerstein8, Claes Wahlestedt9, Yoshihide Hayashizaki10, Piero Carninci10, Thomas R. Gingeras2*, John S. Mattick1*
1Institute for Molecular Bioscience, University of Queensland, Brisbane, Queensland, Australia,2Watson School of Biological Sciences, Cold Spring Harbor Laboratory, Cold Spring Harbor, New York, United States of America,3Broad Institute, Cambridge, Massachusetts, United States of America,4MRC Functional Genomics Unit, Department of Physiology, Anatomy and Genetics, University of Oxford, Oxford, United Kingdom,5Department of Computer Science, University of Leipzig, Leipzig, Germany,6Department of Molecular and Experimental Medicine, Scripps Research Institute, La Jolla, California, United States of America,7Institut Curie, UMR3244-Pavillon Trouillet Rossignol, Paris, France,8Computational Biology and Bioinformatics, Yale University, New Haven, Connecticut, United States of America,9University of Miami, Miami, Florida, United States of America,10Omics Science Center, RIKEN Yokohama Institute, Tsurumi-ku, Yokohama, Kanagawa, Japan
Current estimates indicate that only about 1.2% of the mammalian genome codes for amino acids in proteins. How-ever, mounting evidence over the past decade has suggested that the vast major-ity of the genome is transcribed, well beyond the boundaries of known genes, a phenomenon known as pervasive tran-scription [1]. Challenging this view, an article published in PLoS Biology by van Bakel et al. concluded that ‘‘the genome is not as pervasively transcribed as previous-ly reported’’ [2] and that the majority of the detected low-level transcription is due to technical artefacts and/or background biological noise. These conclusions attract-ed considerable publicity [3–6]. Here, we present an evaluation of the analysis and conclusions of van Bakel et al. compared to those of others and show that (1) the existence of pervasive transcription is supported by multiple independent tech-niques; (2) re-analysis of the van Bakel et al. tiling arrays shows that their results are atypical compared to those of ENCODE and lack independent validation; and (3) the RNA sequencing dataset used by van Bakel et al. suffered from insufficient sequencing depth and poor transcript assembly, compromising their ability to detect the less abundant transcripts outside of protein-coding genes. We conclude that the totality of the evidence strongly supports pervasive transcription of mam-malian genomes, although the biological significance of many novel coding and noncoding transcripts remains to be ex-plored.
Previous Evidence for Pervasive Transcription
The conclusion that the mammalian genome is pervasively transcribed (i.e., ‘‘that the majority of its bases are associ-ated with at least one primary transcript’’ [1]) was based on multiple lines of evidence. Both large-scale cDNA sequenc-ing and hybridization to genome-wide tiling arrays were the major empirical sources of data. Analysis of full-length cDNAs from many tissues and develop-mental stages in mouse showed that at least 63% of the genome is transcribed and identified thousands of novel protein-coding transcripts and over 30,000 long noncoding intronic, intergenic, and anti-sense transcripts [7–9]. In parallel, whole chromosome tiling array interrogation of the RNA content of a variety of human tissues and cell lines revealed that, collec-tively, at least 93% of genomic bases are transcribed in one cell type or another [1,10–13].
Since it is well established that highly expressed mRNAs dominate the
non-ribosomal portion of the polyA+ transcrip-tome [7,8,10,14–19], normalization ap-proaches were used to reduce the quantity of highly expressed transcripts in these cDNA analyses [7,8], and are implicit in tiling array approaches. This was neces-sary to allow the detection of rarer (often cell type–restricted [1,13,16,19,20]) tran-scripts.
The evidence for pervasive transcription also includes observations from a wide variety of other independent techniques (see reviews [21] and [22] for references). Indeed, a simple query of currently available human spliced EST data in GenBank shows that documented tran-scripts cover 57.09% of the genome. Because ESTs are largely generated from polyadenylated RNAs and do not exhaus-tively sample the transcriptome, this cov-erage represents the lower bound of genomic transcription.
Based on an analysis of genome-wide tiling arrays and short read RNA sequenc-ing data, van Bakel et al. report that ‘‘most ‘dark matter’ transcripts (i.e., novel tran-scripts of unknown function) are associated
The Perspective section provides experts with a forum to comment on topical or controversial issues of broad interest.
Citation:Clark MB, Amaral PP, Schlesinger FJ, Dinger ME, Taft RJ, et al. (2011) The Reality of Pervasive Transcription. PLoS Biol 9(7): e1000625. doi:10.1371/journal.pbio.1000625
Academic Editor:Michael B. Eisen, University of California Berkeley, United States of America
PublishedJuly 12, 2011
Copyright: ß2011 Clark et al. This is an open-access article distributed under the terms of the Creative Commons Attribution License, which permits unrestricted use, distribution, and reproduction in any medium, provided the original author and source are credited.
Funding:This work was supported by the Australian Research Council and National Health and Medical Research Council (JSM), NHGRI (TRG, PC), NIH (KVM, MG), Japanese MEXT Research Grant for the RIKEN Omics Science Center (YH, PC), EU FP-7 (PFS), Damon Runyon, Smith, Merkin and Searle scholarships (JLR), and UK BBSRC, ERC and MRC (CPP). The funders had no role in study design, data collection and analysis, decision to publish, or preparation of the manuscript. We thank Tim Hughes and Harm van Bakel for unreservedly providing their data to us for analysis.
Competing Interests:The authors have declared that no competing interests exist.
Abbreviation:PR, precision recall
* E-mail: j.mattick@uq.edu.au (JSM); gingeras@cshl.edu (TRG)
with known genes’’ [2], a well-established and uncontroversial conclusion that has been reported previously [1,8,10,13,14, 19,23–25] (see Text S1). Controversially, however, they also concluded that ‘‘the genome is not as pervasively transcribed as previously reported’’ [2]. The authors suggested that the discrepancy is explained by tiling arrays producing more false positive signals than previously appreciat-ed, although they do not reconcile their conclusions with the extensive transcrip-tome cataloged by cDNA analyses [7,8] and other approaches [21,22]. The multi-centre ENCODE pilot project, for exam-ple, found that 74% of the bases in the genome areas analyzed were covered by primary transcripts identified by two independent technologies [1].
Congruency of Tiling Array and Short Read RNA Sequencing Data
A major feature of van Bakel et al.’s argument was based on their comparison of precision recall (PR) curves generated from tiling arrays and RNA sequencing (RNA-seq), from which they concluded that tiling array results suffer from high false positive rates. These PR curves in principle measure the order in which transcribed regions are detected when the expression detection threshold is lowered in a stepwise manner. This analysis performed by van Bakel et al. indicated a large difference between tran-scribed regions detected by tiling arrays (referred to as transfrags or TARs since they are most often parts of longer transcripts) compared to those detected by RNA-seq (seqfrags). They showed that RNA-seq discovers known protein-coding exons at higher thresholds compared to unannotated transfrags, while tiling arrays found a larger fraction of non-exonic regions, even at high thresholds, from which they conclude a lower accuracy of tiling arrays.
There are two major limitations to this analysis (see also Text S1). First, the implication of lower accuracy of tiling arrays is made in the absence of an independent validation of the false positive rate (which, by contrast, was routinely conducted in previous tiling array studies using techniques such as RT-PCR, see e.g., [10,13]). As explained later, correlating individual tiling array probes and RNA sequencing depth is not an appropriate comparison and cannot substitute as a validation method. Thus, the false-positive claim by van Bakel et al. is impossible to test precisely with the presented data.
Second, while RNA-seq offers linear quantification over a wide range, tiling arrays saturate at the upper end of signal strength. As a consequence, arrays are less reliable in distinguishing highly expressed known exons from less highly expressed novel transfrags, resulting in a lower precision value for any given recall in the PR curves. This fact explains much of the difference in shape between the curves, but does not imply that the regions detected by either technology are false positives, only that quantification by arrays is less linear than by RNA-seq, which is well understood.
We performed a similar PR curve analysis using ENCODE tiling array data for K562 cellular RNA, and found results that are substantially different from those reported by van Bakel et al., but consistent with a recent analysis of a sample-matched nematode RNA-seq and tiling array data-set by Agarwal et al. (2010) [26]. Briefly, we identified transfrags on the tiling arrays with a range of different thresholds. Similar to the analysis by van Bakel et al., every transfrag that overlapped any annotated exon was scored as positive, while all others were scored negative. The resulting PR curve was dramatically dif-ferent from the curve presented in Figure 1A of van Bakel et al. Moreover, the shape of the PR curve and the precision for any given recall level for our tiling arrays is much closer to the van Bakel et al. sequencing data and to our own sequencing data from a matched K562 sample (Figures 1 and S1). These results suggest that, while decreased dy-namic range of tiling arrays leads to an increased number of non-exonic regions being detected at high thresholds (lower initial precision values; see Figure 1), the difference between sequencing and tiling arrays is not large and the discrepancies identified by van Bakel et al. appear to be specific to their analysis.
A second argument for lower accuracy of tiling arrays by van Bakel et al. was based on the observation that there is a relatively low correlation between individ-ual probe-level signals from arrays and sequencing read depth. Unfortunately, such a statement reveals a fundamental lack of understanding of tiling array technology. Tiling arrays are neither intended nor designed to give reliable signals from each individual probe. The more appropriate analysis for correlation is at the level of transcribed regions such as exons or transfrags, as has been done previously [26] and which generally shows a good correlation. This also points to another problem in the van Bakel et al.
study, which used tiling arrays with 36-bp spaced probes, offering only very few probes for each exon. The 5-bp spaced (7X resolution) arrays used for ENCODE (and in many published human transcrip-tome studies) offer more power to filter individual probe-level noise (Figures S2, S3, and S4). Overall it appears that, while RNA-seq offers better linearity of quanti-fication and much higher resolution for boundaries of transcribed regions, the overall detection accuracy of tiling arrays is not significantly lower. This is also in agreement with the recent analysis by Agarwal et al. [26], which consistently observed intergenic and intronic transcrip-tion.
Finally, it is difficult to reconcile the purported high false positive nature of the tiling array results with numerous previous studies that validated up to 94% identified transcripts using independent techniques such as RT-PCR, RACE, and Northern blot analyses [10–13,27].
Detection and Interpretation of Low-Level Transcription
We suggest that the overarching con-clusions drawn by van Bakel et al.—that there is only spasmodic (not pervasive) low-level transcription of much of the genome, and that much of this transcrip-tion has ‘‘random character’’ [2]—are the result of a number of debatable aspects of their logic and analysis. These may be summarized as (1) insufficient sequencing depth and breadth and poor transcript assembly, together with the sampling problems that arise as a consequence of the domination of sequence data by highly expressed transcripts; compounded by (2) the dismissal of transcripts derived from introns; (3) a lack of consideration of non-polyadenylated transcripts; (4) an inability to discriminate antisense transcripts; and (5) the questionable assertion that rarer RNAs are not genuine and/or functional transcripts.
1. Sequencing depth, breadth, and assembly.
the majority of reads, making rare tran-scripts difficult to find in the absence of normalization approaches. This problem is clearly evidenced in the van Bakel et al. dataset, where ,88% of unique polyA+
sequences mapped to exons of known genes, which comprise just over 2% of the genome. Therefore, the transcription in the remainder of the genome was sampled by only,12% of the reads.
This insufficient depth of sequencing is illustrated by comparing the rates of discovery for exonic, intronic, and inter-genic sequences as sequencing depth increases. Despite continuing to constitute most reads, the area covered by exons quickly moves towards saturation, while the area covered by intronic and interge-nic transcripts was found to ‘‘keep increas-ing at roughly constant rates’’ [2]. Thus, the sequence coverage of the vast majority of the genome is not saturated, and potentially includes many novel protein-coding and nonprotein-coding transcripts insuffi-ciently sampled at the given read depth.
Underscoring the importance of ade-quate transcriptome sampling, concurrent-ly published deep sequencing studies, with
two to three times greater depth of data from polyA+ RNAs from cultured cells, were still not saturating [16,28]. Nonethe-less, and unsurprisingly, the increased sequencing depth led to increased novel transcript discovery, as only 70% of the identified splice junctions were derived from ‘‘known genes’’ in a mouse myoblast cell line [28], compared to 94% reported by van Bakel et al. Re-analysis of transcript assembly at different sequencing depths also suggested, crucially, poor assembly and poor recovery of lowly expressed transcripts at the deepest level of sequencing used by van Bakel et al. [28].
The lack of sequencing depth in the van Bakel et al. study was exacerbated by the pooling of 10 tissues/cell lines and the use of such a highly complex tissue as brain. Increasing the complexity of the sample dilutes the relative proportion of tissue-and cell type–specific transcripts. Using the brain (170 billion cells) [29], we calculate that a cell type–specific transcript present at,10 copies per cell (a common level of abundance) in 0.1% of cells would have only a ,50% chance of being detected by any reads at the depth of
sequencing utilized by van Bakel et al., let alone of being assembled into a complete transcript (see Text S1).
Importantly, because the genomic strand from which individual sequence reads were derived was unknown in their study, the method that van Bakel et al. employed to assemble these reads into transcriptional units required that contigs in the vicinity of known genes be bounded by splice sites or cross a splice site, automatically excluding (i) nearly all 59 and 39 UTRs; (ii) deep sequencing reads, other than the splice site, in genes with a single intron (Figure 2); (iii) transcripts from single exon genes, such as the highly expressed metastasis associated lung ade-nocarcinoma transcript 1 (MALAT1) (Fig-ure S5), and transcripts (not containing a splice site) originating from introns [30]; and (iv) perhaps most importantly, any known transcript for which there was no identifiable splice junction in the dataset. This methodology therefore discriminates against lowly expressed transcripts, heavily biasing in favor of common mRNAs.
2. Intronic transcripts. Despite the data showing that 51.4% of the genomic area Figure 1. Precision recall curves for the overlap of transcribed regions (transfrags) detected in different experiments and
annotated exons (from GENCODE version 4 and the UCSC known genes track from the UCSC Genome Browser).The Clark et al.
covered by their human reads aligns with intronic regions, van Bakel et al. presump-tively dismissed these sequences as mainly derived from unprocessed pre-mRNAs, due to their ‘‘low coverage and ubiquitous character’’. Intronic regions, which corre-spond to more than a third of the genome, are by definition transcribed, and hence must be included in estimates of the amount of transcription across the ge-nome. It is also important to note that many introns are not fixed entities and whether a genomic region is intronic, intergenic, or exonic depends on the cell type and physiological state of the cell. In addition, the number of functional RNAs that may be derived from introns is unknown, although there is considerable evidence that they can produce a diversity of discrete stable RNA products from both the sense and antisense strands [12,15,31, 32–34], including novel RNAs with vali-dated functions (e.g., [35]).
3. Non-polyadenylated RNAs. The data used by van Bakel et al. to support the conclusion that ‘‘dark matter transcripts make up a small fraction of the total sequenced transcript mass’’ focused on polyadenylated RNA. However, previous transcriptomic analyses showed that over 40% of ribosomal transcripts are non-polyadenylated [13], and more recent deep
sequencing of total RNA has revealed that over 45% of uniquely mapping sequence reads originate from intronic and intergenic regions [36,37], compared to only 10% in the polyA+RNA from equivalent samples examined by van Bakel et al.
4. Antisense and overlapping transcription.
Tiling array, cDNA, EST, and RNA se-quencing evidence all indicate that consider-able interleaved transcription occurs on both strands [1,9,23,36], with at least 66% of all protein-coding genes in mouse showing evidence of overlapping or antisense tran-scription [9]. However, van Bakel et al. concluded that their data ‘‘argue against widespread interleaved transcription of pro-tein-coding genes’’. This discrepancy can be explained in large part by the lack of strand information in the RNA sequencing data used by them to assemble transcriptional units (TUs). Indeed, the assembled TUs covered less than 26% of the genome (compared to over 40% spanned by RefSeq genes) and, tellingly, less than 2% of RefSeq annotated 39UTR sequences. This lack of coverage and strand information resulted in a large underestimate of the extent of antisense and overlapping transcription (Figures S6 and S7), for which functional evidence is also emerging (see e.g., [38]).
5. Discriminating low signal strength from background noise.The assertion of van Bakel
et al. that low sequence coverage (by seqfrags) equates with transcriptional ‘‘by-products’’ and/or ‘‘random initiation events’’ is highly debatable. Such seqfrags might equally, if not more, plausibly reflect stochastic sampling of transcripts that are less expressed, less stable, and more cell specific [39]. This is not proof or even evidence of irrelevance. Moreover, van Bakel et al. infer non-functionality of rare transcripts without any biological data, but one cannot expect vast numbers of novel coding and noncoding RNAs to be func-tionally annotated coincident with their discovery, especially if, as is likely, they have many different functions [40]. The yeast
GAL10-ncRNA provides a good example: despite a steady-state expression level of around one transcript per 14 cells, it is functional [41]. Similarly, the mammalian HOTTIP RNA plays an important role in epigenetic regulation despite an average expression level of around 0.3 transcripts per cell in expressing tissues [42]. There-fore, while expression levels are important, it cannot be assumed a priori that low expression equates to non-functionality.
Summary
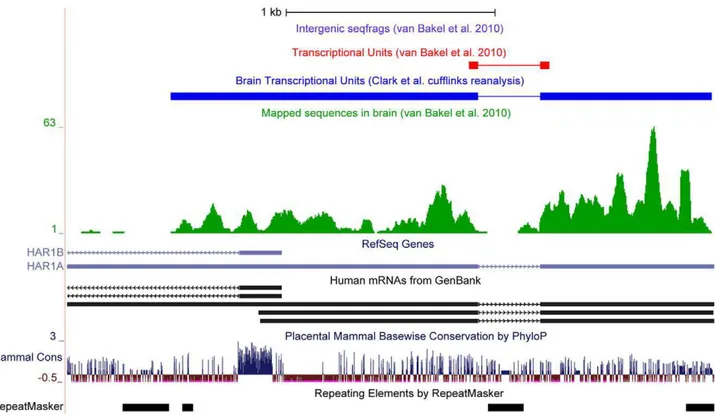
A close examination of the issues and conclusions raised by van Bakel et al. Figure 2. Poor coverage of single intron transcriptional units (TUs) by van Bakel et al.[2].The figure shows the abundance of sequence reads mapped to theHAR1Alocus [43] (green) and the TU created from these tags by van Bakel et al. using TopHat (red) [44]. In contrast, the Clark et al. TU created by reanalysis of sequence reads using Cufflinks [28] includes the extended 59and 39exonic sequences (dark blue).
reveals the need for several corrections. First, their results are atypical and gener-ate PR curves that are not observed with other reported tiling array data sets. Second, characterization of the transcrip-tomes of specific cell/tissue types using limited sampling approaches results in a limited and skewed view of the complexity of the transcriptome. Third, any estimate of the pervasiveness of transcription re-quires inclusion of all data sources, and less than exhaustive analyses can only provide lower bounds for transcriptional complexity. Although van Bakel et al. did not venture an estimate of the proportion of the genome expressed as primary transcripts, we agree with them that ‘‘given sufficient sequencing depth the whole genome may appear as transcripts’’ [2].
There is already a wide and rapidly expanding body of literature demonstrat-ing intricate and dynamic transcript ex-pression patterns, evolutionary conserva-tion of promoters, transcript sequences and splice sites, and functional roles of
‘‘dark matter’’ transcripts [39]. In any case, the fact that their expression can be detected by independent techniques dem-onstrates their existence and the reality of the pervasive transcription of the genome.
Supporting Information
Text S1 Supplementary text.
Found at: doi:10.1371/journal.pbio. 1000625.s001 (0.22 MB DOC)
Figure S1 Comparison of the PR curve transfrags from Clark et al. (ENCODE) and van Bakel et al. data.
Found at: doi:10.1371/journal.pbio. 1000625.s002 (0.27 MB PDF)
Figure S2 Histogram of transfrag length for van Bakel et al. [1] and Clark et al. (ENCODE) transfrags.
Found at: doi:10.1371/journal.pbio. 1000625.s003 (0.26 MB PDF)
Figure S3 PR curve for transcripts. Found at: doi:10.1371/journal.pbio. 1000625.s004 (0.23 MB PDF)
Figure S4 Genome browser screenshots showing annotation and transfrags from the van Bakel et al. and the ENCODE tiling arrays using a threshold that gives similar recall values for both.
Found at: doi:10.1371/journal.pbio. 1000625.s005 (0.14 MB PDF)
Figure S5 Known single exon tran-scripts are missing from van Bakel et al. TUs. Sequence reads (green) provide good coverage ofMalat1gene but are not found in the van Bakel et al. TUs (red). Found at: doi:10.1371/journal.pbio. 1000625.s006 (0.19 MB PDF)
Figure S6 Lack of UTR coverage in TUs prevents the detection of overlapping transcripts.
Found at: doi:10.1371/journal.pbio. 1000625.s007 (0.22 MB PDF)
Figure S7 Lack of UTR coverage in TUs prevents the detection of chains of overlapping transcripts.
Found at: doi:10.1371/journal.pbio. 1000625.s008 (0.27 MB PDF)
References
1. Birney E, Stamatoyannopoulos JA, Dutta A, Guigo R, Gingeras TR, et al. (2007) Identification and analysis of functional elements in 1% of the human genome by the ENCODE pilot project. Nature 447: 799–816.
2. van Bakel H, Nislow C, Blencowe BJ, Hughes TR (2010) Most "dark matter" transcripts are associ-ated with known genes. PLoS Biol 8: e1000371. doi:10.1371/journal.pbio.1000371.
3. Robinson R (2010) Dark matter transcripts: sound and fury, signifying nothing? PLoS Biol 8: e1000370. doi:10.1371/journal.pbio.1000370. 4. Phillips ML (2010) Existence of RNA ‘dark matter’ in doubt. Nature . doi:10.1038/ news.2010.248.
5. Phillips ML (2010) Genomics: Not-so-dark ge-nome. Nature 465: 401.
6. Robertson M (2010) The evolution of gene regulation, the RNA universe, and the vexed questions of artefact and noise. BMC Biol 8: 97. 7. Okazaki Y, Furuno M, Kasukawa T, Adachi J, Bono H, et al. (2002) Analysis of the mouse transcriptome based on functional annotation of 60,770 full-length cDNAs. Nature 420: 563–573. 8. Carninci P, Kasukawa T, Katayama S, Gough J, Frith MC, et al. (2005) The transcriptional landscape of the mammalian genome. Science 309: 1559–1563.
9. Katayama S, Tomaru Y, Kasukawa T, Waki K, Nakanishi M, et al. (2005) Antisense transcription in the mammalian transcriptome. Science 309: 1564–1566.
10. Kapranov P, Cawley SE, Drenkow J, Bekiranov S, Strausberg RL, et al. (2002) Large-scale tran-scriptional activity in chromosomes 21 and 22. Science 296: 916–919.
11. Rinn JL, Euskirchen G, Bertone P, Martone R, Luscombe NM, et al. (2003) The transcriptional activity of human chromosome 22. Genes Dev 17: 529–540.
12. Bertone P, Stolc V, Royce TE, Rozowsky JS, Urban AE, et al. (2004) Global identification of human transcribed sequences with genome tiling arrays. Science 306: 2242–2246.
13. Cheng J, Kapranov P, Drenkow J, Dike S, Brubaker S, et al. (2005) Transcriptional maps
of 10 human chromosomes at 5-nucleotide resolution. Science 308: 1149–1154.
14. Khaitovich P, Kelso J, Franz H, Visagie J, Giger T, et al. (2006) Functionality of intergenic transcription: an evolutionary comparison. PLoS Genet 2: e171. doi:10.1371/journal.pgen.0020171. 15. Nakaya HI, Amaral PP, Louro R, Lopes A,
Fachel AA, et al. (2007) Genome mapping and expression analyses of human intronic noncoding RNAs reveal tissue-specific patterns and enrich-ment in genes related to regulation of transcrip-tion. Genome Biol 8: R43.
16. Guttman M, Garber M, Levin JZ, Donaghey J, Robinson J, et al. (2010) Ab initio reconstruc-tion of cell type-specific transcriptomes in mouse reveals the conserved multi-exonic structure of lincRNAs. Nat Biotechnol 28: 503–510.
17. Carninci P, Sandelin A, Lenhard B, Katayama S, Shimokawa K, et al. (2006) Genome-wide analysis of mammalian promoter architecture and evolution. Nat Genet 38: 626–635. 18. Ravasi T, Suzuki H, Pang KC, Katayama S,
Furuno M, et al. (2006) Experimental validation of the regulated expression of large numbers of non-coding RNAs from the mouse genome. Genome Res 16: 11–19.
19. Kampa D, Cheng J, Kapranov P, Yamanaka M, Brubaker S, et al. (2004) Novel RNAs identified from an in-depth analysis of the transcriptome of human chromosomes 21 and 22. Genome Res 14: 331–342.
20. Carninci P, Waki K, Shiraki T, Konno H, Shibata K, et al. (2003) Targeting a complex transcriptome: the construction of the mouse full-length cDNA encyclopedia. Genome Res 13: 1273–1289.
21. Amaral PP, Mattick JS (2008) Noncoding RNA in development. Mamm Genome 19: 454–492. 22. Berretta J, Morillon A (2009) Pervasive
transcrip-tion constitutes a new level of eukaryotic genome regulation. EMBO Rep 10: 973–982. 23. Engstrom PG, Suzuki H, Ninomiya N, Akalin A,
Sessa L, et al. (2006) Complex loci in human and m o u s e g e n o m e s . P L o S G e n e t 2 : e 4 7 . doi:10.1371/journal.pgen.0020047.
24. Kapranov P, Cheng J, Dike S, Nix DA, Duttagupta R, et al. (2007) RNA maps reveal new RNA classes and a possible function for pervasive transcription. Science 316: 1484–1488. 25. Fejes-Toth K, Sotirova V, Sachidanandam R, Assaf G, Hannon GJ, et al. (2009) Post-transcrip-tional processing generates a diversity of 59-modified long and short RNAs. Nature 457: 1028–1032. 26. Agarwal A, Koppstein D, Rozowsky J, Sboner A,
Habegger L, et al. (2010) Comparison and calibration of transcriptome data from RNA-Seq and tiling arrays. BMC Genomics 11: 383. 27. Kapranov P, Drenkow J, Cheng J, Long J, Helt G,
et al. (2005) Examples of the complex architecture of the human transcriptome revealed by RACE and high-density tiling arrays. Genome Res 15: 987–997.
28. Trapnell C, Williams BA, Pertea G, Mortazavi A, Kwan G, et al. (2010) Transcript assembly and quantification by RNA-Seq reveals unannotated transcripts and isoform switching during cell differentiation. Nat Biotechnol 28: 511–515. 29. Azevedo FA, Carvalho LR, Grinberg LT,
Farfel JM, Ferretti RE, et al. (2009) Equal numbers of neuronal and nonneuronal cells make the human brain an isometrically scaled-up primate brain. J Comp Neurol 513: 532–541. 30. Guru SC, Agarwal SK, Manickam P, Olufemi SE,
Crabtree JS, et al. (1997) A transcript map for the 2.8-Mb region containing the multiple endocrine neoplasia type 1 locus. Genome Res 7: 725–735. 31. Dinger ME, Amaral PP, Mercer TR, Pang KC, Bruce SJ, et al. (2008) Long noncoding RNAs in mouse embryonic stem cell pluripotency and differentiation. Genome Res 18: 1433–1445. 32. Mercer TR, Dinger ME, Sunkin SM, Mehler MF,
Mattick JS (2008) Specific expression of long noncoding RNAs in the mouse brain. Proc Natl Acad Sci U S A 105: 716–721.
33. Reis EM, Nakaya HI, Louro R, Canavez FC, Flatschart AV, et al. (2004) Antisense intronic non-coding RNA levels correlate to the degree of tumor differentiation in prostate cancer. Onco-gene 23: 6684–6692.
transcripts in Drosophila melanogaster. Genome Res 19: 1289–1300.
35. Heo JB, Sung S (2011) Vernalization-mediated epigenetic silencing by a long intronic noncoding RNA. Science 331: 76–79.
36. Armour CD, Castle JC, Chen R, Babak T, Loerch P, et al. (2009) Digital transcriptome profiling using selective hexamer priming for cDNA synthesis. Nat Methods 6: 647–649. 37. Xu AG, He L, Li Z, Xu Y, Li M, et al. (2010)
Intergenic and repeat transcription in human, chimpanzee and macaque brains measured by RNA-Seq. PLoS Comput Biol 6: e1000843. doi:10.1371/journal.pcbi.1000843.
38. Yu W, Gius D, Onyango P, Muldoon-Jacobs K, Karp J, et al. (2008) Epigenetic silencing of tumour suppressor gene p15 by its antisense RNA. Nature 451: 202–206.
39. Dinger ME, Amaral PP, Mercer TR, Mattick JS (2009) Pervasive transcription of the eukaryotic genome: functional indices and conceptual impli-cations. Brief Funct Genomic Proteomic 8: 407–423.
40. Mercer TR, Dinger ME, Mattick JS (2009) Long non-coding RNAs: insights into functions. Nat Rev Genet 10: 155–159.
41. Houseley J, Rubbi L, Grunstein M, Tollervey D, Vogelauer M (2008) A ncRNA modulates histone
modification and mRNA induction in the yeast GAL gene cluster. Mol Cell 32: 685–695. 42. Wang KC, Yang YW, Liu B, Sanyal A,
Corces-Zimmerman R, et al. (2011) A long noncoding RNA maintains active chroamtin to coordinate gene expression. Nature 427: 120–124. 43. Pollard KS, Salama SR, Lambert N, Lambot MA,
Coppens S, et al. (2006) An RNA gene expressed during cortical development evolved rapidly in humans. Nature 443: 167–172.