DOI: 10.5935/2359-4802.20170023
Introduction
Systemic arterial hypertension (SAH) is one of the biggest public health problems worldwide.1 In 2012, it was responsible for 5.92% of all hospital admissions through the Unified Health System (SUS).2 It is one of the main risk factors for diseases of the circulatory system,1 which in 2011 were responsible for 335,213 deaths in Brazil3 and represent 30% of all deaths worldwide, and 50% of deaths from chronic non-communicable diseases.1
There is evidence that adult SAH has its onset in childhood,4 but as its symptoms are more unspecific in children, they might not show signs they already have elevated blood pressure (BP) levels.5 Studies have shown that hemodynamic changes are observed in these individuals as early as in the second decade of life, or even earlier,6,7 hence the importance of routine evaluation of BP in childhood,8 according to the recommended protocol.9
ORIGINAL ARTICLE
Mailing Address: Camila Brandão de Souza
Rua Herculano de Freitas, 73. Apt. D. Postal Code: 01308020, Bela Vista, São Paulo, SP – Brazil E-mail: [email protected]; [email protected]
Prevalence of Hypertension in Children from Public Schools
Camila Brandão de Souza1, Cláudia de Souza Dourado2, José Geraldo Mill2, Luciane Bresciane Salaroli2,
Maria del Carmen Bisi Molina2
Universidade Federal de São Paulo (UNIFESP)1, São Paulo, SP; Universidade Federal do Espírito Santo (UFES)2, Vitória, ES – Brazil
Manuscript received September 26, 2016; revised manuscript October 24, 2016; accepted January 24, 2017.
Abstract
Background: There is a discrepancy between protocols used for the diagnosis of childhood hypertension, and the most recommended one is the measurement of blood pressure in at least three different moments.
Objective: To identify the prevalence of hypertension in children, and to associate it with the nutritional status variable.
Methods: This is a longitudinal study, which included all children aged 7 to 10 years enrolled in public schools and had the authorization of their parents/guardians, totaling 722 children. In the first evaluation, the child's family answered a questionnaire, and the child was submitted to anthropometric and hemodynamic evaluation. Blood pressure was measured three times at three different times. Children who had high blood pressure at the first moment were reassessed at a second time; those who persisted with high blood pressure were re-evaluated at a third moment.
Results: The prevalence of high blood pressure at the first moment was 8.1%, being 3.2% in the second and 2.1% in the third. The nutritional status was significantly associated with the increase in systolic and diastolic blood pressures, being higher in overweight and obese children. The highest prevalence of high blood pressure was found in children classified as obese, at all moments.
Conclusion: By performing blood pressure measurements of children at different moments, it was possible to reduce false-positive cases for arterial hypertension. The nutritional status was directly associated with the increase in blood pressure values. Performing the measurements in routine consultations becomes essential for diagnosis and early intervention. (Int J Cardiovasc Sci. 2017;30(1):42-51)
There is evidence that protocols are implemented in the pediatric care routines, but there is a discrepancy between the used protocols and the prevalence of hypertension or elevated BP found in the population studies.7,10-12 Additionally, the diagnosis of SAH can only be attained after BP is measured three times at different moments.13
Considering the difficulties of carrying out an extensive protocol in population studies, it is possible that the evaluation in a sample can provide important information for decision-making and recommendations for the monitoring of cardiovascular risk factors in children. Moreover, data and analyses carried out after a single BP measurement may lead to misinterpretations of the context of the pediatric population.
Based on the need to confirm the diagnosis of SAH in risk situations found during studies on this subject, the present study aimed to identify the prevalence of SAH in children based on BP measurements at three different moments, as well as to evaluate the association with the nutritional status variable. It is expected that the results contribute to a better understanding and new insights on the diagnosis of hypertension in the pediatric population.
Methods
This is a longitudinal study on the health and nutritional status of children aged 7 to 10 years, enrolled in 13 public elementary schools in two health regions (Maruípe and Continental) in the city of Vitória, state of Espírito Santo, Brazil, selected by drawing lots. The “health region” is understood as the “continuous geographical area consisting of groups from bordering municipalities, delimited by cultural, economic and social identities and shared communication networks and transport infrastructure, aimed at integrating the organization, planning and the performance of health actions and services.”14
All children aged 7 to 10 years were invited to participate, and the exclusion criterion was presence of some comorbidity that could result in secondary SAH. Data collection started in 2010 and ended in 2012. The study was divided into three moments, with a 1-year interval between the first and second moments and a 6-month interval between the second and third moments.
At the first moment, sociodemographic, anthropometric, and hemodynamic data were collected from 722 children in the recommended age group. Data were analyzed and the prevalence of high BP in the sample was obtained. After 1 year, the children with pressure alterations were contacted through a letter sent to the household, inviting them to remain in the study. The children’s parents or guardians had to reauthorize the participation of their children in the protocol by signing a new FICF, so that the BP levels could be verified at two other moments to confirm the diagnosis of SAH.
At the second moment, the participants had hemodynamic and anthropometric data evaluated under the same protocol. There was a loss of ten children who were going to be assessed at the second moment, because they were transferred to another school and /or did not return with the new FICF signed by the parents/ guardians. Data were analyzed and, after 6 months, the children who remained with high BP were recruited for the third moment. they were re-evaluated under the same protocol and those who remained with high BP were diagnosed as having SAH.
Three different measurements were performed at each of the moments, totaling nine measurements at the end of the study. All procedures were carried out at the schools, in ventilated, illuminated and silent rooms, by adequately trained examiners and experienced in population studies with childhood BP assessment.
(85th percentile and < 97th percentile) and obesity (97th percentile). The height deficit was determined when stature for age was < 3rd percentile. The ethnicity/ race variable was defined as white, black, brown, and Asian/indigenous and age was defined as 7, 8, 9 and 10 years.17
Statistical Analysis
Data were entered in duplicate and consistency analysis was performed in 10% of the questionnaires. Statistical Package for Social Science (SPSS), version 17.0 was used for the analysis. Pearson’s chi-square and Fisher’s exact tests were used for the comparison of proportions.
The Kolmogorov-Smirnov test was used to evaluate the normal probability distribution of data. To evaluate the differences between means, Student’s t-test for independent samples and Analysis of Variance (ANOVA) were used with Tukey’s multiple comparisons test. A significance level of 5% and a confidence interval of 95% were considered for the analysis.
This study was approved by the Research Ethics Committee. There were no conflicts of interest.
Results
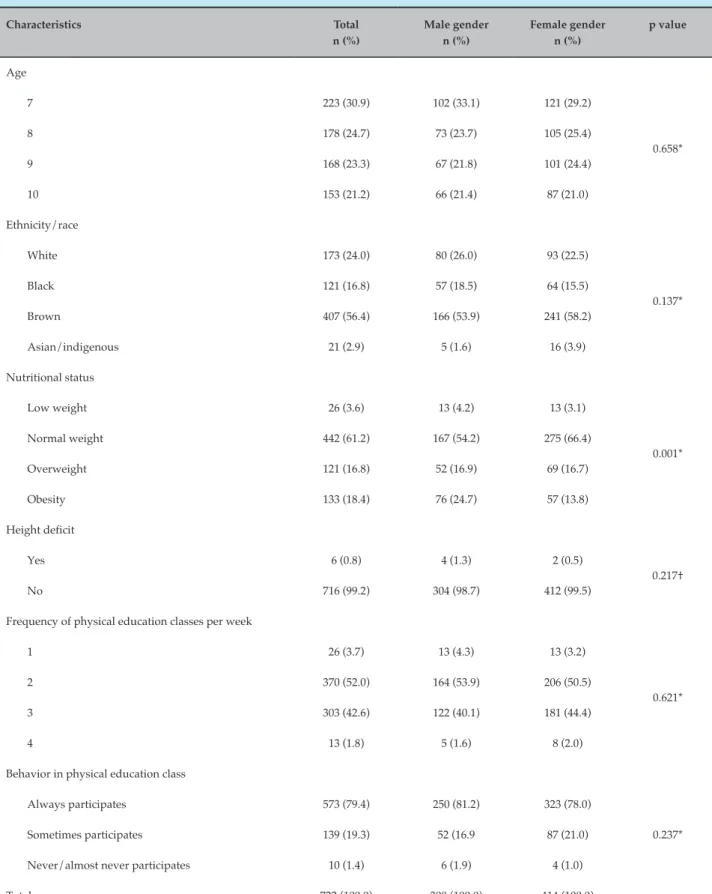
Only the comparison of nutritional status between the genders showed statistical significance (p < 0.05). We observed a higher proportion of girls with normal weight (66.4%) and a higher proportion of boys with obesity (24.7%) (Table 1).
Mean waist circumference in boys (62.6 cm ± 9.8 cm; p = 0.01) was higher than that of girls (60.4 cm ± 8.3 cm). Mean arm circumference was similar between the genders, being 20.9 cm (± 3.6) for girls and 21.1 cm (± 3.6) for boys. There was a significant difference in mean systolic BP for age, ethnicity/race and nutritional status. Thus, the highest systolic BP means were observed at ages 9 (103.9 mmHg ±11.2 mmHg) and 10 years (104.3 mmHg ± 11.7 mmHg). The Asian/indigenous ethnicity showed the highest mean systolic BP (107.6 mmHg ± 12.9 mmHg). The highest mean values of systolic BP in the nutritional status were those of overweight (105.1 mmHg ± 10.6 mmHg) and obese children (106.3 mmHg ± 10.8 mmHg). The other means of systolic BP were considered similar for gender and height deficit.
The highest diastolic BP mean for age was found in children aged 9 (63.2 mmHg ± 10.1 mmHg) and 10 years
(62.4 mmHg ± 8.1 mmHg). The overweight (64.2 mmHg ± 8, 2 mmHg) and obese ones (65.0 mmHg ± 9.5 mmHg) reached the highest means of the nutritional status. The other means of diastolic BP were considered similar for gender, ethnicity/race, and height deficit (Table 2). At the first moment, elevated BP was observed in 58 (8.1%) children; these were referred to the second moment, in which 23 (3.2%) remained with elevated BP. This last group was referred to the third moment, when there was confirmation of hypertension in 15 (2.1%) children (Table 3).
The mean systolic and diastolic BP at the three moments can be seen in Figure 1. The mean values of the systolic BP at the first moment were significantly different from those at the second moment (p = 0.05), different from what occurred with the diastolic BP (p = 0.42). From the first to the third moment, both the systolic and diastolic BP did not show significant differences. The same occurred from the second to the third moment.
Figure 2 shows that, at all the three moments, the children classified as obese had a higher prevalence of high BP, being, at the last moment, five times higher than the prevalence found in the group of children with normal weight.
The Kolmogorov-Smirnov (K-S) test did not reject (p > 0.05) the normality hypothesis of the data.
Discussion
Table 1 – Sample characterization according to gender
Characteristics Total
n (%)
Male gender n (%)
Female gender n (%)
p value
Age
7 223 (30.9) 102 (33.1) 121 (29.2)
0.658*
8 178 (24.7) 73 (23.7) 105 (25.4)
9 168 (23.3) 67 (21.8) 101 (24.4)
10 153 (21.2) 66 (21.4) 87 (21.0)
Ethnicity/race
White 173 (24.0) 80 (26.0) 93 (22.5)
0.137*
Black 121 (16.8) 57 (18.5) 64 (15.5)
Brown 407 (56.4) 166 (53.9) 241 (58.2)
Asian/indigenous 21 (2.9) 5 (1.6) 16 (3.9)
Nutritional status
Low weight 26 (3.6) 13 (4.2) 13 (3.1)
0.001*
Normal weight 442 (61.2) 167 (54.2) 275 (66.4)
Overweight 121 (16.8) 52 (16.9) 69 (16.7)
Obesity 133 (18.4) 76 (24.7) 57 (13.8)
Height deficit
Yes 6 (0.8) 4 (1.3) 2 (0.5)
0.217†
No 716 (99.2) 304 (98.7) 412 (99.5)
Frequency of physical education classes per week
1 26 (3.7) 13 (4.3) 13 (3.2)
0.621*
2 370 (52.0) 164 (53.9) 206 (50.5)
3 303 (42.6) 122 (40.1) 181 (44.4)
4 13 (1.8) 5 (1.6) 8 (2.0)
Behavior in physical education class
Always participates 573 (79.4) 250 (81.2) 323 (78.0)
0.237* Sometimes participates 139 (19.3) 52 (16.9 87 (21.0)
Never/almost never participates 10 (1.4) 6 (1.9) 4 (1.0)
Total 722 (100.0) 308 (100.0) 414 (100.0)
Table 2 – Mean differences between systolic and diastolic blood pressure in schoolchildren by age, gender, ethnicity/ race, nutritional status and height deficit
Characteristics SBP (mmHg) DBP (mmHg)
Mean ± SD p value Mean ± SD p value
Age
7 100.3 ± 10.8ᵃ
< 0.001*
61.5 ± 10.5ᵃᵇ
0.040*
8 101.1 ± 10.9ᵃ 60.8 ± 9.5ᵃ
9 103.9 ± 11.2ᵇ 63.2 ± 10.1ᵇ
10 104.3 ± 11.7ᵇ 62.4 ± 8.1ᵇ
Gender
Male 102.6 ± 11.7
0.237†
61.5 ± 10.3
0.159†
Female 101.9 ± 10.9 62.2 ± 9.3
Ethnicity/race
White 102.7 ± 10.6ᵃ
0.047*
63.0 ± 10.3
0.146*
Black 102.5 ± 11.0ᵃ 61.5 ± 9.0
Brown 101.6 ± 11.5ᵃ 61.6 ± 9.6
Asian/indigenous 107.6 ± 12.9ᵇ 63.0 ± 10.5
Nutritional status
Normal weight 100.3 ± 11.2ᵃ
< 0.001*
60.5 ± 9.9ᵃ
< 0.001*
Low weight 99.5 ± 9.3ᵃ 59.3 ± 8.3ᵃ
Overweight 105.1 ± 10.6ᵇ 64.2 ± 8.2ᵇ
Obesity 106.3 ± 10.8ᵇ 65.0 ± 9.5ᵇ
Height deficit
No 97.5 ± 16.6
0.189†
60.0 ± 14.4
0.210†
Yes 102.2 ± 11.2 62.0 ± 9.7
Total 102.2 ± 11.3 61.9 ± 9.7
Kolmogorov Smirnov (SBP) p value = 0.057; Kolmogorov Smirnov (DBP) p value = 0.093. Different letters indicate differences between means (Tukey’s test), *Analysis of variance; † Student’s t test for independent samples, SBP: systolic blood pressure; DBP: diastolic blood pressure; SD: standard deviation.
Table 3 – Prevalence of elevated blood pressure at three different moments
Moment Normal
n (%)
Borderline n (%)
Elevated n (%)
First 534 (75.0) 120 (16.9) 58 (8.1)
Second 28 (3.9) 7 (1.0) 23 (3.2)
Figure 2 – Prevalence of high blood pressure at the three moments, according to the nutritional status.
A study with children aged > 6 years verified a prevalence of sedentary lifestyle in more than 50% of the sample.21 More sedentary children tend to be obese or overweight, showing a worse physical condition,25 which results in severe health complications, mainly noncommunicable diseases (NCD). In the present study, all children had one physical education class at least once a week, and most of them always participated in the activities.
The greater waist circumference in the boys corroborated the fact that they have a higher prevalence of obesity, a result similar to that of a study carried out with Chinese children, which also associated this alteration with increased BP.26 A prevalence of 2.1% of SAH was found in the sample, following a protocol that considers three measurements at three different times, totaling nine measurements. Sorof et al.,12 using a very similar protocol, which recommended three BP measurements at three different consultations, at least 2 weeks apart, obtained a prevalence of 19.4% at the first consultation, 9.5% at the second and 4.5% as the final diagnosis.
Pavicević et al.,10 in a study of 3,000 children and adolescents, obtained a prevalence of high BP in 0.93% in the sample, using the protocol of the mean of three measurements performed at a single moment. Monge et al.,27 found a prevalence of 2.7% in population of 328 children and adolescents, after obtaining three
measurements and considering only the mean of the last two. A study11 carried out in Canada, with 130 children aged 3 to 8 years, obtained a high BP in 24.8% of them, using, for the diagnosis, the mean of the three measurements obtained in a single consultation. In Vitória, Brazil, a study7 carried out with 1,282 children was based on a protocol with two BP measurements; if the difference between the measurements was greater than 5 mmHg, a third measurement was performed, and the mean of the last two measurements was considered for diagnostic purposes, with a prevalence of 13.8%.
It can be observed, at the first moment, the presence of innumerable outliers, representing children with BP values that are very distant from the means and standard deviations. At the second moment, this number of children decreases considerably, persisting only in the mean diastolic BP. At the third moment, there are no outliers, a fact that corroborates previous studies12,28 showing lower BP variance and the “white coat effect” from the moment when more BP measurements are performed.
BP levels may increase from 14 to 27 mmHg, and such change is more evident in the first 4 minutes, decreasing in approximately 10 minutes and persisting through several consultations.31,32
According to the VI Brazilian Guideline for Arterial Hypertension,9 the white coat hypertension should already be treated with care, as these individuals have a worse cardiovascular prognosis,33 and it may represent a pre-hypertensive state in adults.30
The fact that obese individuals have a higher prevalence of elevated BP corroborates studies in Brazil and worldwide that reinforce the existence of a definite association between overweight, obesity and SAH.7,22,34 The chance of an obese individual to also have SAH is 7.53-fold higher than that of an overweight individual.35 Mavrakanas et al.36 state that obese children have five to six-fold higher BP than non-obese children. When compared to individuals with normal weight, overweight ones have the risk to develop hypertension increased by 180%.37
The stigma of obesity with the increase of elevated BP may also have other triggering variables. Fante38 states that children with marked physical characteristics are more vulnerable to psychological aggressions, called bullying, with that being the case of obese children, who may have other vulnerability traits, such as low self-esteem, insecurity, anxiety, and shyness. Thus, it is possible for these children to go through more stressful situations.
When facing a stressful situation, the neural axis is triggered instantaneously, causing activation of the autonomic nervous system (sympathetic bundle) and peripheral nervous system. This activation results in some effects, including an increase in BP and heart rate.39 It is clear that the association between emotional disorders and changes in visceral functions, such as SAH, is evident from the moment when the limbic structures, responsible for the emotions, are activated and generate cardiovascular and respiratory responses.40
Conclusion
Variables such as nutritional status, age, and ethnicity/ race were statistically significant for increased systolic blood pressure. The more blood pressure measurements are performed, the more reliable is the diagnosis of hypertension in the child and, in fact, caution is required in disclosing such data.
Although it is more complex to operate the protocol used in this research, it can be performed in population studies. In addition to reducing false-positives and confirming the true cases of hypertension, it would be
possible to determine risk situations for monitoring and investigation of secondary hypertension.
One study limitation was the fact that the blood pressure measurements were not always taken at the same time, and this factor could have generated hemodynamic changes, such as in pre- and post-school recess measurements, when feeding and active playing occur. This factor was minimized by respecting the rest period before the measurements, as well as the care in performing the procedure in a well-ventilated, quiet and illuminated room.
Initiatives should be taken so that life habits, which are more easily moldable in children, can be modified and public policies should prioritize their health. The measurement of blood pressure in children in Primary Care is important and necessary for the early detection of high blood pressure, and may be an important tool in the prevention of future complications. Health promotion goes beyond the limits of conventional institutions, by providing in spaces such as the school, alternative health education sites, aiming at the dissemination and awareness of healthy practices. This study contributed to a better understanding of childhood hypertension, collaborating to decision-making in this context.
Author contributions
Conception and design of the research: Souza CB, Dourado CS, MillJG, Salaroli LB, Molina MCB. Acquisition of data: SouzaCB, Dourado CS, MillJG, Salaroli LB, Molina MCB. Analysis and interpretation of the data: SouzaCB, Dourado CS, MillJG, Salaroli LB, Molina MCB. Statistical analysis: SouzaCB, Dourado CS, MillJG, Salaroli LB, Molina MCB. Obtaining financing: SouzaCB, Dourado CS. Writing of the manuscript: Souza CB, Dourado CS, MillJG, Salaroli LB, Molina MCB. Critical revision of the manuscript for intellectual content: SouzaCB, Dourado CS, MillJG, Salaroli LB, Molina MCB. Supervision / as the major investigador: Molina MCB.
Potential Conflict of Interest
No potential conflict of interest relevant to this article was reported.
Sources of Funding
There were no external funding sources for this study.
Study Association
1. Goulart FA. Doenças crônicas não transmissíveis: estratégias de controle e desafios para os sistemas de saúde. Brasília: Organização Pan-Americana de Saúde; 2011. [Acesso em: 20 ago 2016]. Disponível em: http://apsredes.org/site2012/wp-content/uploads/2012/06/ Condicoes-Cronicas_flavio1.pdf
2. Ministério da Saúde. Datasus. D.29 Taxa de internação hospitalar
(SUS) por causas selecionadas. Brasília; 2012. [Acesso em 2016 set 25]. Disponível em: http://tabnet.datasus.gov.br/cgi/tabcgi.exe?idb2012/ d29.def
3. Ministério da Saúde. Datasus. C.8 Taxa de mortalidade específica
por doença do aparelho circulatório. Brasília; 2012. [Acesso em 2016 set 25]. Disponível em: http://tabnet.datasus.gov.br/cgi/tabcgi. exe?idb2012/c08.def
4. Chen X, Wang Y. Tracking of blood pressure from childhood to
adulthood: A systematic review and meta-regression analysis. Circulation. 2008;117(25):3171-80.
5. Tanne JH. Children should have blood pressure and cholesterol checked
by age of 5. BMJ. 2002;325(7354):8.
6. Daniels SR. Cardiovascular sequelae of childhood hypertension. Am J
Hypertens. 2002;15(2 Pt 2):61S-63S.
7. Molina Mdel C, Faria CP, Montero MP, Cade NV, Mill JG.
[Cardiovascular risk factors in 7-to-10-year-old children in Vitória, Espírito Santo State, Brazil]. Cad Saude Publica. 2010;26(5):909-17.
8. Pellanda LC, Echenique L, Barcellos LM, Maccari J, Borges FK, Zen BL. [Ischemic heart disease: prevention should begin in childhood]. J Pediatr (Rio J). 2002;78(2):91-6.
9. Sociedade Brasileira de Cardiologia; Sociedade Brasileira de
Hipertensão; Sociedade Brasileira de Nefrologia. [VI Brazilian Guidelines on Hypertension]. Arq Bras Cardiol. 2010;95(1 Suppl):1-51. Erratum in: Arq Bras Cardiol. 2010;95(4):553.
10. Pavicević M, Pavicević D, Milosević B, Stojanović D. [Arterial
hypertension frequency in urban and rural population of children]. Srp Arh Celok Lek. 2005;133(3-4):152-5.
11. Eisenmann JC, Wrede J, Heelan KA. Associations between adiposity,
family history of CHD and blood pressure in 3–8 year-old children. J Hum Hypertens. 2005;19(9):675-81.
12. Sorof JM, Lai D, Turner J, Poffenbarger T, Portman RJ. Overweight,
ethnicity, and the prevalence of hypertension in school-aged children. Pediatrics. 2004;113(3 Pt 1):475-82.
13. National High Blood Pressure Education Program Working Group
on High Blood Pressure in Children and Adolescents. The fourth report on the diagnosis, evaluation, and treatment of high blood pressure in children and adolescents. Pediatrics. 2004;114(2 Suppl 4th Report):555-76.
14. Brasil. Decreto nº 7.508, de 28 de junho de 2011. Regulamenta a Lei no
8.080, de 19 de setembro de 1990, para dispor sobre a organização do Sistema Único de Saúde - SUS, o planejamento da saúde, a assistência à saúde e a articulação interfederativa, e dá outras providências. Diário Oficial da União 28 jun 2011; Capítulo 1, p. 1.
15. Stergiou GS, Yiannes NG, Rarra VC. Validation of the Omron 705 IT
oscillometric device for home blood pressure measurement in children and adolescents: The Arsakion School Study. Blood Press Monit. 2006;11(4):229-34.
16. World Health Organization. (WHO). Growth reference 5-19 years.
[Access in 2016 Sep 23]. Available from: http://www.who.int/ growthref/en/
17. Instituto Brasileiro de Geografia e Estatística. (IBGE). Conceitos:
cor ou raça. [Acesso em 2016 set 26]. Disponível em:< http:// www.ibge.gov.br/home/estatistica/populacao/condicaodevida/ indicadoresminimos/conceitos.shtm
18. Juli MR. Childhood obesity: global issues. Psychiatr Danub.
2016;28(Suppl-1):87-91.
19. Costa RF, Cintra IP, Fisberg M. Prevalence of overweight and obesity
in school children of Santos city, Brazil. Arq Bras Endocrinol Metab. 2006;50(1):60-7.
20. Yamamoto-Kimura L, Posadas-Romero C, Posadas-Sánchez R, Zamora-González J, Cardoso-Saldaña G, Méndez Ramírez I. Prevalence and interrelations of cardiovascular risk factors in urban and rural Mexican adolescents. J Adolesc Health. 2006;38(5):591-8.
21. de Araújo TL, de Lopes MV, Cavalcante TF, Guedes NG, Moreira RP,
Chaves ES, et al. [Analysis of risk indicators for the arterial hypertension in children and teenagers]. Rev Esc Enferm USP. 2008;42(1):120-6.
22. Chung ST, Hong B, Patterson L, Petit CJ, Ham JN. High overweight
and obesity in Fontan patients: a 20-year history. Pediatr Cardiol. 2016;37(1):192-200.
23. Bloch KV, Coutinho ES, Lôbo MS, Oliveira JE, Milech A. Blood pressure,
capillary glucose, and anthropometric measurements in a Yanomámi population. Cad Saude Publica. 1993;9(4):428-38.
24. Chen L, Simonsen N, Liu L. Racial differences of pediatric hypertension in relation to birth weight and body size in the United States. PLoS One. 2015;10(7):e0132606.
25. Muros JJ, Cofre-Bolados C, Zurita-Ortega F, Castro-Sánchez M,
Linares-Manrique M, Chacón-Cuberos R. Relación entre condición física, actividad física y diferentes parámetros antropométricos en escolares de Santiago (Chile). Nutr Hosp. 2016;33(2):110.
26. Zhang YX, Zhao JS, Chu ZH. Percentiles of waist-to-sitting-height
ratio and its relationship with obesity and elevated blood pressure among children and adolescents in Shandong, China. Blood Press Monit. 2016;21(1):33-7.
27. Monge R, Beita O. Prevalence of coronary heart disease risk factors in
Costa Rican adolescents. J Adolesc Health. 2000;27(3):210-7.
28. Guedis AG, Sousa BD, Marques CF, Piedra DP, Braga JC, Cardoso ML, et al. White coat hypertension and its accurate diagnostic. Is it important? Rev Bras Hipertens. 2008;15(1):46-50.
29. Gus M. White-coat hypertension. Rev Bras Hipertens. 2008;15(4):206-8.
30. Smith PA, Graham LN, Mackintosh AF, Stoker JB, Mary DA.
Sympathetic neural mechanisms in white-coat hypertension. J Am Coll Cardiol, 2002;40(1):126-32.
31. Mancia G, Bertineri G, Grassi G, Parati G, Pomidossi G, Ferrari A, et al. Effects of blood pressure measurement by the doctor on patient’s blood pressure and heart rate. Lancet. 1983;2(8352):695-8.
32. Mancia G, Parati G, Pomidossi G, Grassi G, Casadei R, Zanchetti A.
Alerting reaction and rise in blood pressure during measurement by physician and nurse. Hypertension. 1987;9:209-15.
33. Mancia G, Facchetti R, Bombelli M, Grassi G, Sega R. Long-term
risk of mortality associated with selective and combined elevation in office, home, and ambulatory blood pressure. Hypertension. 2006;47(5):846-53.
34. Monego ET, Jardim PC. [Determinants of risk of cardiovascular diseases
in schoolchildren]. Arq Bras Cardiol. 2006;87(1):37-45.
35. Carneiro G, Faria AN, Ribeiro Filho FF, Guimarães A, Lerário D, Ferreira SR, et al. [Influence of body fat distribution on the prevalence of arterial hypertension and other cardiovascular risk factors in obese patients]. Rev Assoc Med Bras (1992). 2003;49(3):306-11.
36. Mavrakanas TA, Konsoula G, Patsonis I, Merkouris BP. Childhood
obesity and elevated blood pressure in a rural population of northern Greece. Rural Remote Health. 2009;9(2):1150.
37. Haffner SM, Ferrannini E, Hazuda HP, Stern MP. Clustering of cardiovascular risk factors in confirmed prehypertensive individuals. Hypertension. 1992;20(1):38-45.
38. Fante C. Fenômeno bullying: como prevenir a violência nas escolas e
educar para a paz. 2ª ed. Campinas (SP): Verus; 2005.
39. Margis R, Picon P, Cosner AF, Silveira RO. Relação entre estressores,
estresse e ansiedade. Rev Psiquiatr (RS). 2003;25(supl 1):65-74.
40. Fonseca FC, Coelho RZ, Nicolato R, Diniz LF, Silva Filho HC. The