Copyright © 2008 by Sociedade Brasileira de Pediatria
O
RIGINALA
RTICLEPredicting insulin resistance in children:
anthropometric and metabolic indicators
Sérgio R. Moreira,1 Aparecido P. Ferreira,1 Ricardo M. Lima,1 Gisela Arsa,1Carmen S. G. Campbell,2 Herbert G. Simões,2 Francisco J. G. Pitanga,3
Nanci M. França2
Abstract
Objective:To predict insulin resistance in children based on anthropometric and metabolic indicators by analyzing the sensitivity and specificity of different cutoff points.
Methods:A cross-sectional study was carried out of 109 children aged 7 to 11 years, 55 of whom were obese, 23 overweight and 31 well-nourished, classified by body mass index (BMI) for age. Measurements were taken to determine BMI, waist and hips circumferences, waist circumference/hip circumference ratio, conicity index and body fat percentage (dual emission X-ray absorptiometry). Fasting blood samples were taken to measure triglyceridemia, glycemia and insulinemia. Insulin resistance was evaluated by the glycemic homeostasis method, taking the 90th percentile as the cutoff point. Receiver operating characteristic curves were analyzed to a 95% confidence interval in order to identify predictors of glycemic homeostasis, and sensitivity and specificity were then calculated.
Results:After analysis of the area under the receiver operating characteristic curve (confidence interval), indicators that demonstrated the power to predict insulin resistance were, in the following order: insulinemia = 0.99 (0.99-1.00), 18.7 μU·mL-1; body fat percentage = 0.88 (0.81-0.95), 41.3%; BMI = 0.90 (0.83-0.97), 23.69 kg·m2-¹; waist circumference= 0.88 (0.79-0.96), 78.0 cm; glycemia = 0.71 (0.54-0.88), 88.0 mg·dL-1; triglyceridemia = 0.78 (0.66-0.90), 116.0 mg·dL-1and conicity index = 0.69 (0.50-0.87), 1.23 for the whole sample; and were: insulinemia = 0.99 (0.98-1.00), 19.54 μU·mL-1; body fat percentage = 0.76 (0.64-0.89), 42.2%; BMI = 0.78 (0.64-0.92), 24.53 kg·m2-¹; waist circumference = 0.77 (0.61-0.92), 79.0 cm and triglyceridemia = 0.72 (0.56-0.87), 127.0 mg·dL-1, for the obese subgroup.
Conclusions:Anthropometric and metabolic indicators appear to offer good predictive power for insulin resistance in children between 7 and 11 years old, employing the cutoff points with the best balance between sensitivity and specificity of the predictive technique.
J Pediatr (Rio J). 2008;84(1):47-52:Prediction, insulin resistance, cutoff points, children.
Introduction
Insulin resistance is a clinical condition that is character-ized by reduced cellular glucose uptake in response to a given concentration of insulin and which has been identified as a public health problem,1while attention has also been called
to the condition in populations such as children and adolescents.2-4The disorder is associated with a defect in post-receptors of the insulin signaling pathway,5which inter-feres with the translocation process of the muscular glucose transporter (GLUT-4), which itself performs an important role
1. Programa de Mestrado e Doutorado em Educação Física, Universidade Católica de Brasília (UCB), Brasília, DF, Brazil. Bolsista, Coordenação de Aperfeiçoa-mento de Pessoal de Nível Superior (CAPES).
2. Programa de Mestrado e Doutorado em Educação Física, UCB, Brasília, DF, Brazil.
3. Programa de Mestrado e Doutorado em Educação Física, UCB, Brasília, DF, Brazil. Departamento de Educação Física, Universidade Federal da Bahia (UFBA), Salvador, BA, Brazil.
No conflicts of interest declared concerning the publication of this article.
Suggested citation:Moreira SR, Ferreira AP, Lima RM, Arsa G, Campbell CS, Simões HG, et al. Predicting insulin resistance in children: anthropometric and metabolic indicators. J Pediatr (Rio J). 2008;84(1):47-52.
Manuscript received Jun 26 2007, accepted for publication Oct 16 2007.
doi:10.2223/JPED.1740
in glucose uptake. Recently, some authors6,7have extrapo-lated this initial theory and proposed an explanation for insu-lin resistance based on a lipocentric perspective, by which an accumulation of intramuscular lipids originating from long chain fatty acids penetrating cells would inhibit translocation of GLUT-4 to the plasmatic membrane, thereby also suggest-ing a possible alternative method of identifysuggest-ing insulin resis-tance based on indicators associated with body fat content.
The techniques for diagnosing insulin resistance based on biomolecular evaluation of insulin receptors and post-receptors5and on the euglycemic-hyperinsulinemic clamp test (which analyzes glucose uptake during induced hyperin-sulinemia),2,8are expensive and, for many health profession-als, difficult to access. Huang et al.9validated the glucose homeostasis index (HOMA) for the identification of insulin resistance in children, demonstrating it to be an interesting proposal when compared with the gold standard. Neverthe-less, the HOMA calculations require values for fasting insuline-mia and glyceinsuline-mia, which in turn demand invasive sample collections. These procedures make the use of this index prob-lematic, especially for the diagnostic evaluation of large popu-lation samples.
It is clear that there is a need for diagnostic tests to be developed that are easy to apply, offer good precision and are of low cost, with the objective of predicting insulin resistance based on risk factors.10It is a fact that childhood obesity is associated with negative consequences for children’s health, and its prevalence has been increasing progressively over recent years.11-13In this context, excess body fat is a vari-able which may have the potential to predict insulin resis-tance in children.9,14 To give one example, waist circumference (WC) has been highlighted as an independent predictor of metabolic and hemodynamic disorders.15,16 How-ever, these studies identified cutoff points for the variable based on the 90th percentile for a given population and fur-ther research is required to suggest diagnostic tests and their respective advantages, and with the inclusion of data on the degree of sensitivity and specificity of the methods being proposed.
Although the health sciences have identified indicators based on body composition to predict insulin resistance, dia-betes type 2 and other diseases of a cardiovascular character,16-18no studies have been carried out with children to investigate indicators with cutoff points determined based on an analysis of the balance between the sensitivity and specificity of the prediction technique. This being so, the objective of this study was to test insulin resistance predic-tion in children based on anthropometric and metabolic indi-cators while simultaneously calculating the sensitivity and specificity of cutoff points.
Methods
This was a population-based cross-sectional study of an initial randomized sample selected from the public schools of
Taguatinga, a satellite city of Brasília, DF, Brazil, in accor-dance with a sample size calculation with a confidence inter-val (CI) of 97%. Schools, grades and classes were chosen at random, preserving the proportionality of the children enrolled in the educational sector chosen for study. The sample analy-sis had demonstrated that 394 children were needed to achieve a number of participants (p = 0.05) representative of the population of schoolchildren enrolled in the public school system. However, with the intention of guaranteeing a more expressive number, the initial analysis included 958 children from 10 public schools (p = 0.03), observing a prevalence of overweight of 10.6% (n = 102) and of 7.7% (n = 74) of obe-sity, meaning that 18.3% of the total number of children were overweight. After screening the 958 initial subjects, 109 chil-dren of both sexes were chosen with a variety of nutritional status classifications and aged from 7 to 11 years. The sample studied was classified according to body mass index/age (BMI/age),19defining 55 children as obese (over the 95th per-centile), 23 children as overweight (between percentiles 85 and 95) and 31 children as well-nourished (between percen-tiles 5 and 75). The number of overweight and obese partici-pants was defined based on the prevalence of overweight and obesity observed previously (18.3%) in this population, and resulting in an estimate that 71 individuals (p = 0.05) would be sufficient to represent the population of overweight and obese children enrolled in the public education system. A fur-ther subgroup of 31 children classified as well-nourished com-prised the control group, completing the breakdown of the whole sample studied.
The protocol for this research was approved by the Ethics Committee at the Universidade Católica de Brasília (UCB) and by the Taguatinga Regional Education Department (Secre-taria Regional de Ensino de Taguatinga). Those responsible for the study participants signed a free and informed consent form giving authorization for the children selected to partici-pate in the study.
The weight, height and BMI20of each child were mea-sured using a Plena brand balance with a digital readout and a stadiometer by Seca. Waist circumference and hip circumfer-ence (HC) were measured,20using a tape measure, Seca brand, and then calculations were performed to obtain the waist-to-hip ratio (WHR)21and conicity index (C index),18as follows:
4.6A. The volunteers were requested to remove all metal objects that they might be wearing or carrying. Each subject was then positioned in decubitus dorsal on the DEXA machine for a whole body scan with the pediatric analysis option selected, in accordance with the manufacturer’s recommen-dations. The equipment had been duly calibrated before use. Fat mass was calculated for each participant in relative terms (%F), and all analyses were carried out by the same researcher.13
After an overnight fast of 12 hours, venous blood was taken at the UCB Hospital between 7:45 and 9:00 am for bio-chemical analysis. The samples were conditioned in vacuum tubes with separator gel and without anticoagulant. After col-lection, the blood was centrifuged for 10 minutes at 3,000 rpm to separate the serum from the remaining components, and the serum was used for analysis. Triglycerides and blood glu-cose were assayed using an enzymatic colorimetric kit, pro-cessed in an Autohumalyzer A5 (Human-2004). Insulin was assayed using the Automated Chemiluminescence System ACS-180 (Ciba-Corning Diagnostic Corp., 1995, United States).
Insulin resistance was calculated using the HOMA method,9as illustrated by the following equation:
The HOMA index has been validated for children by Huang et al.9against the euglycemic-hyperinsulinemic clamp tech-nique. The criterion adopted here for a diagnosis of insulin resistance was a HOMA index over the 90th percentile (p. 90), as has been proposed in the past.22-24
Receiver operating characteristic (ROC) analysis was adopted to select the cutoff points that identified insulin resis-tance for each of the indicators studied.25For this procedure the sample was divided into a total group (n = 109; 9.24±1.38 years) and a subgroup comprising just the obese children (n = 55; 9.20±1.16 years). Briefly, a ROC curve is generated by plotting sensitivity on the y-axis as a function of [1 - specific-ity] on the x-axis. Sensitivity is the percentage of individuals who exhibited the outcome (in the case studied here, insulin resistance) and who have been correctly diagnosed by the indicator in question (i.e. true positives), while specificity describes the percentage of individuals who did not exhibit the outcome and were correctly diagnosed by the indicator (i.e. true-negatives). The criterion utilized to choose the cut-off points was to select the values at which sensitivity and specificity were most similar and were not less than 60%. The statistical significance of each analysis was verified by the area under the ROC curve and by the 95% confidence interval (95%CI). Thus, a perfect indicator would offer an area under
the ROC curve of 1.00, while a diagonal line would represent an area of 0.50. For an indicator to be exhibiting any discrimi-native power its area under the ROC curve must be between 0.50 and 1.00, and the greater the area the greater the indi-cator’s discriminative power. Another way to determine pre-dictive capacity is using the 95%CI, where, for an anthropometric or metabolic indicator to be considered a sig-nificant predictor of insulin resistance, the lower limit of the CI (LL-CI) must not be less than < 0.50.26Additionally, Pear-son’s linear correlation test was applied to the relationships between each of the indicators being tested and insulin resis-tance, to a significance level of p < 0.05. Statistical analysis of the data was carried out using the software programs Statatmversion 9.1 and Statistica®version 5.1.
Results
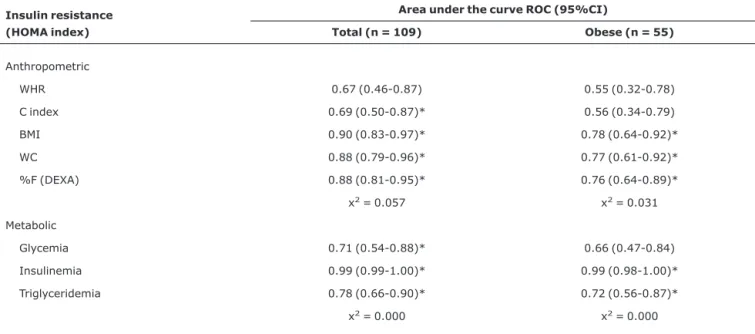
Table 1 lists the areas under the ROC curves for the anthro-pometric and metabolic insulin resistance predictors together with their respective CIs. Neither the WHR for the whole group or for the obese subgroup, nor the C index or glycemia for the obese subgroup demonstrated significant discriminatory power for insulin resistance (LL-CI < 0.50). In contrast, after analysis of the areas under the ROC curves, the anthropomet-ric indicators C index, BMI, WC and %F for the whole group and BMI, WC and %F for the obese subgroup did prove to be significant predictors of insulin resistance (LL-CI ≥ 0.50). Fur-thermore, the metabolic indicators glycemia, insulinemia and triglyceridemia, for the whole group, and insulinemia and trig-lyceridemia, for the group made up of obese children, all dem-onstrated significant discriminatory power for insulin resistance prediction (LL-CI ≥ 0.50).
With relation to the ROC curves, it is worth drawing atten-tion to the fact that the x-axis represents [1 - specificity] and the y-axis the sensitivity of possible indicators for predicting insulin resistance (reference). Therefore, the points at which the indicators proposed in this study as having predictive power for insulin resistance exhibit the greatest similarity between the two axes (x and y) were defined as cutoff points and these are listed in Table 2. Furthermore, the correlations between these predictors and insulin resistance are also given in Table 2.
Discussion
and triglyceridemia for the subgroup composed of obese chil-dren (Table 2).
The euglycemic-hyperinsulinemic clamp test has been described as being the gold standard for the identification of insulin resistance in children and adolescents.2,9,17It was not possible to use the euglycemic-hyperinsulinemic clamp tech-nique to test for insulin resistance in this study, and the HOMA
index was used instead, which could be characterized as a limi-tation. However, Huang et al.9have validated the HOMA tech-nique for identifying insulin resistance in children, and several authors22-24have used the index successfully. Despite the practicality of using HOMA when compared with the gold stan-dard, it is still necessary to measure two variables in order to calculate it (glycemia and insulinemia), and these are obtained invasively. Furthermore, measuring insulinemia is
Table 1- Area under the ROC curve and 95%CI for the relationships between anthropometric and metabolic indicators and insulin resistance for the whole group and the obese subgroup
Insulin resistance (HOMA index)
Area under the curve ROC (95%CI)
Total (n = 109) Obese (n = 55)
Anthropometric
WHR 0.67 (0.46-0.87) 0.55 (0.32-0.78)
C index 0.69 (0.50-0.87)* 0.56 (0.34-0.79)
BMI 0.90 (0.83-0.97)* 0.78 (0.64-0.92)*
WC 0.88 (0.79-0.96)* 0.77 (0.61-0.92)*
%F (DEXA) 0.88 (0.81-0.95)* 0.76 (0.64-0.89)*
x2= 0.057 x2= 0.031
Metabolic
Glycemia 0.71 (0.54-0.88)* 0.66 (0.47-0.84)
Insulinemia 0.99 (0.99-1.00)* 0.99 (0.98-1.00)*
Triglyceridemia 0.78 (0.66-0.90)* 0.72 (0.56-0.87)*
x2= 0.000 x2= 0.000
%F = body fat percentage; 95%CI = 95% confidence interval; BMI = body mass index; C index = conicity index; DEXA = dual emission X-ray absorptiometry; HOMA = glycemic homeostasis index; ROC = receiver operating characteristic; WC = waist circumference; WHR = waist-to-hip ratio. *Area under the curve ROC demonstrating discriminatory power for insulin resistance (LL-CI ≥ 0.50).
Table 2- Cutoff points, correlation, sensitivity and specificity of the anthropometric and metabolic indicators for predicting insulin resistance in the whole group (n = 109) and the obese subgroup (n = 55)
Insulin resistance (HOMA index)
Cutoff point Sensitivity (%) Specificity (%) Total Obese Total Obese Total Obese
Anthropometric
C index 1.23 (r = 0.39)* NP 63.64 NP 63.27 NP
WC (cm) 78.0 (r = 0.67)* 79.0 (r = 0.57)* 81.82 63.64 77.55 63.64
BMI (kg/m2) 23.69 (r = 0.66)* 24.53 (r = 0.54)* 81.82 72.73 79.59 72.73
%F (DEXA) 41.30 (r = 0.57)* 42.20 (r = 0.43)* 90.91 72.73 83.67 72.73
Metabolic
Glycemia (mg·dL-1) 88.00 (r = 0.37)* NP 72.70 NP 73.50 NP
Insulinemia (μU·mL-1) 18.70 (r = 0.99)* 19.54 (r = 0.99)* 100.00 90.91 96.90 93.18
Triglyceridemia (mg·dL-1) 116.00 (r = 0.47)* 127.00 (r = 0.46)* 63.60 63.64 67.30 63.64
%F = body fat percentage; BMI = body mass index; C index = conicity index; DEXA = dual emission X-ray absorptiometry; HOMA = glycemic homeosta-sis index; WC = waist circumference.
considered difficult to apply within the daily practice of many different health professionals, since biochemical assays are needed that must be carried out in a laboratory environment by a fully trained technician.
Many studies15,18,23,27have attempted to identify practi-cal and precise indices for predicting diseases, including insu-lin resistance,9,16,17which may later trigger diabetes type 2 early in life.28Information related to detection of insulin resis-tance during childhood, acquired in a simple and inexpensive manner, can be of benefit to a variety of professionals work-ing with child health durwork-ing their prophylactic and therapeu-tic practherapeu-tice, in addition to reducing healthcare costs.
In this study it was possible to identify predictors of insu-lin resistance based on a single metabolic measurement, such as glycemia, triglyceridemia or insulinemia itself. As would be expected, insulinemia demonstrated the greatest predictive power when its area under the ROC curve was analyzed25,26 (Table 1), in addition to a high correlation and better sensitiv-ity and specificsensitiv-ity when compared with the other indicators (Table 2). On the other hand, triglyceridemia and glycemia, although having lower percentages for sensitivity and speci-ficity when compared with insulinemia (Table 2), proved to be good predictors of insulin resistance. When the area under the ROC curve25and the CI were analyzed, in particular the CI lower limit greater than 0.50, it was confirmed that there was a significant predictive ability26for glycemia for the whole sample and for triglyceridemia for both the whole sample and for the obese subgroup (Table 1). Nowadays, triglyceridemia and glycemia can be tested using low cost portable analyz-ers, making it easily possible to use these measurements for the prediction of insulin resistance in children.
Furthermore, anthropometric indicators such as %F, the C index, BMI and WC, also demonstrated significant predic-tive power25,26for insulin resistance (Table 1). Notwithstand-ing, %F was measured using DEXA, an expensive method that is highly complex to apply clinically. However, similar results are observed when the areas under the ROC curves for the indicators BMI and WC are analyzed with relation to the area under the ROC curve for %F as measured by DEXA, for the whole group and the obese subgroup (Table 1). Furthermore, there were significant moderate to high correlations between %F measured by DEXA and BMI (r = 0.89), WC (r = 0.84) and the C index (r = 0.53) in this study, and with BMI (r = 0.73) and WC (r = 0.61) in a study by Gomes et al.27The power of the variable WC to predict insulin resistance that was detected for both groups in this study (Tables 1 and 2), is in keeping with other studies10,15,16that have demonstrated that this variable is an independent predictor, in a variety of popula-tions, for insulin resistance, lipid content and arterial blood pressure. It is therefore suggested that the anthropometric indicators studied here be used for predicting insulin resis-tance in children, since they offer the advantages of ease of measurement, low cost, a noninvasive nature and values
referring to the degree of sensitivity and specificity of the cut-off point proposed.
Currently, in places where morphophysiological, postural and nutritional characteristics are assessed, such as at sports clubs, gymnasiums and physiotherapy, nutrition and pediat-rics consulting rooms, there is an ever rising prevalence of patients with a variety of risk factors, of which obesity is of greatest prominence,11,12,29which is itself associated with insulin resistance at early ages.13,14,16This being so, the prac-ticality of using the indicators proposed here represents eas-ily applied procedures and great clinical importance for future therapeutic and preventative interventions. These practices are even more relevant to the assessment of children, since they make it possible to prevent the complications associ-ated with insulin resistance and diabetes type 2 in later life.
Based on the results observed, we conclude that it has been possible to identify anthropometric and metabolic indi-cators with discriminatory power for the prediction of insulin resistance in children aged 7 to 11 years, based on the cutoff points with the best balance between sensitivity and specific-ity. The predictors of insulin resistance proposed were insulinemia, %F, BMI, WC, glycemia, triglyceridemia and the C index for the whole sample, and insulinemia, %F, BMI, WC and triglyceridemia for the subgroup of obese children. The ease with which the indicators proposed can be measured makes them important tools to be used in the routines of health professionals. Further studies with similar methodolo-gies are needed to examine the application of these indica-tors to different populations and to stratify them by characteristics such as ethnicity and family history of diabe-tes type 2.
References
1. Stephens JW, Ambler G, Vallance P, Betteridge DJ, Humphries SE, Hurel SJ.Cardiovascular risk and diabetes. Are the methods of risk prediction satisfactory?Eur J Cardiovasc Prev Rehabil. 2004;11:521-8.
2. Moran A, Jacobs DR Jr., Steinberger J, Hong CP, Prineas R, Luepker R, et al.Insulin resistance during puberty: results from clamp studies in 357 children.Diabetes. 1999;48:2039-44.
3. Sinaiko AR, Jacobs DR Jr., Steinberger J, Moran A, Luepker R, Rocchini AP, et al.Insulin resistance syndrome in childhood: associations of the euglycemic insulin clamp and fasting insulin with fatness and other risk factors.J Pediatr. 2001;139:700-7.
4. Valente AM, Strong W, Sinaiko AR. Obesity and insulin resistance in young people.Am Heart J. 2001;142:440-4.
5. Klip A.Regulation of glucose transport by insulin and non hormonal factors.Life Sci. 1982;31:2537-48.
6. Berggren JR, Hulver MW, Dohm GL, Houmard JA.Weight loss and exercise: implications for muscle lipid metabolism and insulin action.Med Sci Sports Exerc. 2004;36:1191-5.
8. DeFronzo RA, Tobin JD, Andres R.Glucose clamp technique: a method for quantifying insulin secretion and resistance. Am J Physiol. 1979;237:E214-23.
9. Huang TT, Johnson MS, Goran MI.Development of a prediction equation for insulin sensitivity from anthropometry and fasting insulin in prepubertal and early pubertal children.Diabetes Care. 2002;25:1203-10.
10. Zimmet P, Alberti G, Kaufman F, Tajima N, Silink M, Arslanian S, et al.The metabolic syndrome in children and adolescents.
Lancet. 2007;369:2059-61.
11. Mello ED, Luft VC, Meyer F.Obesidade infantil: como podemos ser eficazes?J Pediatr (Rio J). 2004;80:173-82.
12. Lobstein T, Baur L, Uauy R; IASO International Obesity TaskForce.
Obesity in children and young people: a crisis in public health. Obes Rev. 2004;5 Suppl 1:4-104.
13. Ferreira AP, Oliveira CE, França NM.Metabolic syndrome and risk factors for cardiovascular disease in obese children: the relationship with insulin resistance (HOMA-IR). J Pediatr (Rio J). 2007;83:21-6.
14. Bacha F, Saad R, Gungor N, Arslanian SA.Are obesity-related metabolic risk factors modulated by the degree of insulin resistance in adolescents?Diabetes Care. 2006;29:1599-604.
15. Fernandez JR, Redden DT, Pietrobelli A, Allison DB.Waist circumference percentiles in nationally representative samples of African-American, European-American, and Mexican-American children and adolescents.J Pediatr. 2004;145:439-44.
16. Lee S, Bacha F, Gungor N, Arslanian SA.Waist circumference is an independent predictor of insulin resistance in black and white youths.J Pediatr. 2006;148:188-94.
17. Yeckel CW, Weiss R, Dziura J, Taksali SE, Dufour S, Burgert TS, et al.Validation of insulin sensitivity indices from oral glucose tolerance test parameters in obese children and adolescents.J Clin Endocrinol Metab. 2004;89:1096-101.
18. Pitanga FJ, Lessa I.Sensibilidade e especificidade do índice de conicidade como discriminador do risco coronariano de adultos em Salvador, Brasil.Rev Bras Epidemiol. 2004;7:259-69.
19. National Center for Chronic Disease Prevention and Health Promotion, National Center for Health Statistics. CDC table for calculated body mass index values for selected heights and weights for ages 2 to 20 years. http://www.cdc.gov/ growthcharts. Access: 10/02/2006.
20. Marins JC, Giannichi RS. Avaliação e prescrição de atividade física: guia prático. 2ª ed. Rio de Janeiro: Shape; 1998.
21. Lohman TG, Roche AE, Martorell R. Anthropometric standardization reference manual. Illinois: Human Kinetics; 1988.
22. Davis CL, Flickinger B, Moore D, Bassali R, Domel Baxter S, Yin Z.Prevalence of cardiovascular risk factors in schoolchildren in a rural Georgia community.Am J Med Sci. 2005;330:53-9.
23. Hirschler V, Aranda C, Calcagno Mde L, Maccalini G, Jadzinsky M.Can waist circumference identify children with the metabolic syndrome? Arch Pediatr Adolesc Med. 2005; 159:740-4.
24. Srinivasan SR, Myers L, Berenson GS.Changes in metabolic syndrome variables since childhood in prehypertensive and hypertensive subjects: The Bogalusa Heart Study.Hypertension. 2006;48:33-9.
25. Erdreich LS, Lee ET.Use of relative operating characteristic analysis in epidemiology. A method for dealing with subjective judgement.Am J Epidemiol. 1981;114:649-62.
26. Schisterman EF, Faraggi D, Reiser B, Trevisan M.Statistical inference for the area under the receiver operating characteristic curve in the presence of random measurement error.Am J Epidemiol. 2001;154:174-9.
27. Gomes MA, Rech CR, Gomes MBA, Santos DL.Correlação entre índices antropométricos e distribuição de gordura corporal em mulheres idosas.Rev Bras Cineantropom Desempenho Hum. 2006;8(3):16-22.
28. Rotteveel J, Belksma EJ, Renders CM, Hirasing RA, Delemarre-Van de Waal HA.Type 2 diabetes in children in the Netherlands: the need for diagnostic protocols.Eur. J Endocrinol. 2007; 157:175-80.
29. Seidell JC.Environmental influences on regional fat distribution.
Int J Obes. 1991;15 Suppl 2:31-5.
Correspondence: Sérgio Rodrigues Moreira SCLN 106, Bloco A/211
CEP 70742-510 – Brasília, DF – Brazil