Copyright © 2008 by Sociedade Brasileira de Pediatria
ORIGINAL
ARTICLE
Use of the Revised Children’s Diet Quality Index to
assess preschooler’s diet quality, its sociodemographic
predictors, and its association with body weight status
Sibylle Kranz,1 Jill L. Findeis,2 Sundar S. Shrestha3Abstract
Objective:To determine the level of overall diet quality, sociodemographic predictors of diet quality, and the
association between diet quality and body weight status in a nationally representative sample of preschoolers.
Methods:Cross-sectional study using a sample of 2-5 years old with sociodemographic, dietary, and
anthropometric data (n = 1,521) in the National Health and Examination Survey 1999-2002. Overall diet quality was
determined using the Revised Children’s Diet Quality Index. Sociodemographic predictors (age, sex, sociodemographic,
ethnic group, household income, preschool attendance, federal food program participation) of diet quality were
determined using multiple linear regression models in the total sample and stratified by household income for Food
Stamp eligible (< 1.3 of the poverty income ratio) or Special Supplemental Program for Women, Infants, and Children
eligible (poverty income ratio < 1.85). Association between diet quality and prevalence of childhood obesity was assessed
with Pearson chi-square tests. Statistical significance was assumed at p ≤ 0.05. All analysis was conducted using complex
survey design routines.
Results:On average, preschooler consumed suboptimal levels of whole grains, fruits, vegetables, and dairy. Overall
diet quality decreased with increasing age (beta-coefficient: -2.38, p < 0.001) but improved with increasing family
income in the full sample (beta-coefficient: 1.22, p < 0.001) but not in the low-income subpopulations. Mexican American
children had significantly better diet quality than non-Hispanic white children (beta-coefficient: 2.18, p < 0.033)
especially in the low income group (beta-coefficient: 3.57, p < 0.006). Childhood obesity prevalence decreased
significantly with increasing diet quality.
Conclusions:Preschooler’s diet quality needs to be improved to support the prevention of childhood obesity early
in life.
J Pediatr (Rio J). 2008;84(1):26-34:Diet, diet surveys, obesity, food quality.
Introduction
Childhood obesity rates have been increasing dramati-cally in the past decades in the USA while preschooler’s intake
of fruits and vegetables decreased.1The number of children
at risk for overweight (85th-94th percentile on the body mass
index-for-age growth charts) or overweight (≥ 95th
percen-tile) has reached epidemic proportions.2In addition to the
health problems associated with high body weight,
over-weight children might also be at increased risk to suffer from the metabolic syndrome.3,4
1. PhD, RD. Assistant professor, Department of Nutritional Sciences, Pennsylvania State University, PA, USA. Research associate, The Population Research Institute, Pennsylvania State University, PA, USA.
2. PhD. Professor, Department of Agricultural Economics and Rural Sociology, Pennsylvania State University, PA, USA. 3. Department of Agricultural Economics and Rural Sociology, Pennsylvania State University, PA, USA.
Sources of support for this study came from the USDA, Economic Research Service Small Grant no. #K-981834-09, and a Pennsylvania State University Seed Grant.
No conflicts of interest declared concerning the publication of this article.
Suggested citation:Kranz S, Findeis JL, Shrestha SS. Use of the Revised Children’s Diet Quality Index to assess preschooler’s diet quality, its sociodemo-graphic predictors, and its association with body weight status. J Pediatr (Rio J). 2008;84(1):26-34.
Manuscript received Jul 26 2007, accepted for publication Oct 31 2007.
doi:10.2223/JPED.1745
To help prevent childhood obesity, it is of pivotal
impor-tance to understand the relationship between modifiable lif-estyle factors, such as dietary intake patterns and the
development of excessive body weight. Dietary intake levels of some food groups or nutrients have been found to be
asso-ciated with overall diet quality or body weight status,5,6
how-ever, there is lack of data indicating a direct association between overall diet quality, measured with a composite diet
quality assessment tool specifically designed for children, and body weight status in American preschoolers. In an effort to
close this gap, the aims of this study were to determine the level of overall diet quality in American children and to
ascer-tain the sociodemographic predictors of overall diet quality, as well as to examine the association between diet quality and
body weight status.
Methods
Sample
The Centers for Disease Control and Prevention (CDC) conducts the National Health and Nutrition Examination
Sur-vey (NHANES, http://www.cdc.gov/nchs/nhanes.htm), an
ongoing survey using a multistage, stratified area design to obtain a sample of respondents that is representative of the
civilian non-institutionalized American population. Certain population groups were over-sampled (e.g. young children,
adolescents 12-19 years, African Americans, Mexican Ameri-cans, and low-income persons).
Although the data are released in 2-year increments, they
were designed to be merged to multi-year data sets.7The first
4-year data (NHANES 1999-2002) contains information on
21,004 individuals who provided interview data. Of these, 19,759 individuals also had medical examination data and the
sample size for children 2-5 years old who provided
sociode-mographic, dietary, and body mass index (BMI) data, and who were not breastfeeding was 1,521. To allow the examination
of the effect of federal food programs, such as the Food Stamp Program and the Special Supplemental Program for Women,
Infants, and Children (WIC), multiple regression models were employed in two income-stratified subpopulations. Thus,
lin-ear regression models were developed for the total sample of preschoolers, the children who were income-eligible for the
WIC program (poverty income ratio - PIR ≤ 1.85, n = 861) or
the Food Stamp Program (PIR < 1.3, n = 676). All samples were nationally representative of the American
preschool-age population.
Sociodemographic data
Sociodemographic information, such as age, sex, race, ethnicity, preschool participation, and total household income
was reported by the adult completing the household inter-view during the NHANES survey. Age was used as continuous
variable in this study.
Children’s race is determined based on the interview
responder’s categorization as American Indian or Alaskan Native, Asian, black or African American, Native Hawaiian or
Pacific Islander, white, or other. In addition, self-reported eth-nic background is determined by whether the child is Mexican
American, other Hispanic or Latino, both (Mexican and other
Hispanic), or not Hispanic. In an effort to capture cultural dif-ferences of children living in the USA, the variables were
employed to define four mutual exclusive ethnic groups: non-Hispanic white, non-non-Hispanic black, Mexican Americans, and
other.
To estimate the relative income of the households with
preschool-age children in the sample, the method suggested by the USA Census Bureau to calculate the PIR was
employed.8The PIR is an indicator of the total household
income in relation to the number of individuals living in the household. Based on annually updated threshold incomes,
families’ incomes are compared to the threshold. In 2006, for instance, a weighted average threshold for a family of four
was US$ 20,614, thus families with a combined income above this value were considered as not living in poverty.9Total
household income was used in this study to represent indi-viduals eligible for the federal Food Stamp Program (PIR <
1.3), as well as for the WIC (PIR < 1.85), or children living in
families with medium income (1.85-3.4 PIR) and children in high income families (3.5-5.0 PIR). The PIR variable was
capped at 5.0, so that an investigation of very high-income families was not possible using this data set. Two
dichoto-mous variables were created to categorize children as Food Stamp or WIC participants (compared to income-eligible
non-participants). An interaction term (Food Stamp vs. WIC) was created to examine the relationship between participating in
either or both of the programs.
Diet
NHANES dietary data was collected with one interviewer administered 24-hour recall. Respondents were asked to
report dietary intake during the past 24 hours using a
multiple-pass approach.10Caretakers reported the diets for children
less than 6 years old. Intake information was disaggregated
to provide dietary intake data for total energy (kcal per day), macro or micronutrients (g or mg per day), and MyPyramid11
food groups (in cups or ounces per day).
Overall diet quality was assessed using the Revised
Chil-dren’s Diet Quality Index (RC-DQI),12an index based on
national dietary intake recommendations, such as the Dietary
Reference Intakes (DRI) for macronutrients and iron,13,14
MyPyramid,11and position papers from the American Dietetic
Association (ADA),15and the American Academy of
Pediat-rics (AAP).16,17The RC-DQI has a maximum of 90 points and
consists of 13 components: added sugar, total fat, linoleic and
linolenic fatty acids, docosahexaenoic acid (DHA) and eicosa-pentaenoic acid (EPA), total grains, whole grains,
as a component representing a proxy for energy balance (time
spent watching television interacted with total daily energy intake). A full description of the RC-DQI can be found
else-where.12 In short, usual dietary intake information is col-lected from the child’s caretaker and scores assigned for each
of the 13 components. The calculation of the score is based
on under- as well as overconsumption of intake. The formula to calculate the points scored for each component is based on
underconsumption –point score = (actual intake/ideal intake) * maximum points – or overconsumption – point score =
maximum component points - (actual intake/ideal intake) * 100%. For instance, for a 2-year-old boy the recommended
intake of fruit is 1.5 cups per day. If the child ate only 0.5 cups of fruits, he scores 3 points out of the possible 10 component
scores: 10 - (0.5/1.5) * 100. Conversions to the metric
sys-tem from the units of intake in MyPyramid (ounces and cups) can be based on the assumption that 1 ounce is equivalent to
28.4 g (e.g. one slice of bread) and one cup is equivalent to 240 mL.
The proportion of children who met the dietary income
rec-ommendations of the components and scored maximum points for each component was calculated and results
described for the total sample. Total RC-DQI score as continu-ous value from zero to 90 points was the dependent variable
in all linear regression models, whereas total RC-DQI score
was divided into quartiles to examine the association between diet quality and the prevalence of childhood obesity.
Anthropometric data
Measured height and weight as well as calculated BMI are
available in the NHANES data set. Weight (kg) was obtained as the individual stood on a digital scale. Standing height (m)
was measured with an electronic stadiometer in individuals who were at least 2 years old. CDC’s BMI-for-age and
sex-specific growth charts were used to create four distinct groups: underweight (less than 5th percentile), healthy
weight (5th to 84th percentile), at risk for overweight
(between the 85th and 94th percentile), and overweight (≥ 95th percentile). As expected, anthropometric data was not
normally distributed, thus, the method by Cole et al. to con-struct a smoothed curve using the calculated power (L), mean
(M), and coefficient of variation (S) to provided standards in terms of centiles was employed to determine children’s
nor-malized growth centile standards.18Binary dummy variables
were created that equaled “1” when children were classified
as at risk for overweight or overweight and “0” otherwise.
Statistical analysis
All analysis was conducted using complex sample survey routines (version 9.2; StataCorp LP, College Station, TX,
USA19) to maintain the nationally representative character of
the data. Descriptive statistics, such as means and standard errors (SE), proportions, were calculated. The
interrelation-ships between participation in food assistance programs and
income required the assessment of endogeneity, thus,
endo-geneity between the income and income-related variables (such as child’s age, sex, age squared, ethnicity,
sociodemo-graphic, body weight status, and federal food program par-ticipation) were tested using the Hausman-Wu test.20
The status of overall diet quality was described by
calcu-lating the population’s mean RC-DQI score and the percent-age of children receiving full point score for each of the 13
RC-DQI components. Multiple linear regression models were designed to examine the sociodemographic predictors of
over-all diet quality in the total sample as well as in the two
sub-samples of children who were income-eligible for the WIC or the Food Stamp Program. Forward and backward deletion
pro-cess was employed with a p < 0.2 and < 0.25 respectively, indicating significance for the models. Likelihood ratio tests
were conducted to examine the importance of each added/ removed term to the model. Results were reported for the final
models as beta-coefficient, 95% confidence interval and level of statistical significance (p). Quartiles of total RC-DQI scores
were created to assess the relationship between level of diet
quality and the prevalence of children being at risk for over-weight or overover-weight. Pearson’s chi-square test was employed
to determine the significant difference in proportion of chil-dren at risk for overweight or overweight between the
quar-tiles of RC-DQI scores. Statistical significance was assumed at a p < 0.05. The Institutional Review Board (IRB) in the
Office of Research Protection at Pennsylvania State Univer-sity granted approval for the study based on the use of
sec-ondary data with no person identifiers.
Results
The descriptions of the samples can be found in Table 1. The proportion of non-Hispanic white children was highest in
the total sample while more children in the low income samples were Mexican American or non-Hispanic black. Within
the income-eligible subpopulations, approximately half of the children were enrolled in either program. One third of the
pre-schoolers were either at risk for overweight or overweight.
The overall diet quality of the population was low, in that the population average total RC-DQI score was 59 points,
ranging from 21-86 points of the total maximum of 90 points (Table 2). With the exceptions of the DHA and EPA, the total
grain, or the iron component, less than half of the children met the intake recommendations of the RC-DQI components
and achieved full points. Only 8% of the sample met the intake recommendation for whole grains.
Hausman-Wu test results showed that there was no endo-geneity between the available sociodemographic variables
and the children’s household income variable. Thus, addi-tional stratification by income-related covariates was not
nec-essary. The regression models indicated that increasing age
than non-Hispanic white children. No other ethnic group was significantly different from the referent group. Boys in the WIC
income-eligible subsample had significantly better diet
qual-ity than girls (Tables 4 and 5) and Mexican-American children scored almost 4 points more on the total RC-DQI than their
non-Hispanic white counterparts. Food Stamp Program par-ticipation was not a significant predictor of overall diet quality
in either subsample whereas a beneficial, although not statis-tical significant effect of WIC participation was indicated. The
interaction between WIC and Food Stamp participation was not statistically significant in either model.
The proportion of children at risk for overweight or
over-weight decreased significantly between the lowest and the highest RC-DQI total score quartile (Figure 1). Although this
trend was not consistent in the second and third quartile, the decrease of the numbers of children at risk for overweight
between the first, second, and forth quartile of RC-DQI score
was statistically significant whereas the difference in the pro-portion of children who were overweight was only statistically
lower between the first and the second, the first and the
fourth, as well as the third and the fourth RC-DQI score quartile.
Discussion
Results of this study showed that preschooler’s diet leaves much room for improvement. Particularly the consumption of
whole grains, fruits, vegetables, and dairy were subopti-mal.21A 1-year increase in children’s age was associated with
a loss of approximately two points in the diet quality index.
This phenomenon is likely due to the increasing indepen-dence in food choice and dietary intake with increasing age.
While most children are still in the parent-guided transition period to table foods at 2 years of age,22older children will
have become independent eaters and choose their own foods for meals and snacks.
Table 1- Description of the population of American preschoolers in the National Health and Nutrition Examination Survey (NHANES 1999-2002)
in percent
Characteristics Total, n = 1,521
Ethnic group
Non-Hispanic white 61.9
Non-Hispanic black 12.9
Mexican 13.5
Other 11.7
Food Stamp income-eligible 34.2
Food Stamp participants 53.0
WIC income-eligible 46.3
WIC participants (of eligible) 43.7
Household income
< 1.3 PIR 34.2
1.3-1.84 PIR 12.0
1.85-3.4 PIR 21.7
> 3.5 PIR 32.1
Attends preschool 21.5
At risk for overweight (85-94th BMI percentile) 21.8
Overweight (≥ 95th BMI percentile) 11.2
Increasing family income was predictive of better diet quality scores in the total population. The significance of
fam-ily income on preschooler’s diet quality was removed in the
two low-income subpopulations. This finding indicates a threshold level in the relationship between family income and
dietary intake. Family economic power has been found to pre-dict the purchases of foods with high nutritional quality, such
as whole grain starches (e.g. bread and pasta), fresh fish, fruits and vegetables.23However, it has been found that WIC
or Food Stamp Program participation increase the diet
qual-ity of children.24,25Hence, federal food program participation
appears to reflect change in behavior in that more resources
are spent on the purchase of high-quality foods.
The large proportion of fruit and high-fiber vegetables, such as beans, that are traditionally consumed in the
Mexi-can diet were likely the reason for the observed increased diet
quality in Mexican-American children. This effect of ethnic background was particularly high in the WIC income-eligible
subgroup. Hence, it appears that especially low-income chil-dren may benefit from adopting traditional Mexican diets. The
importance of cultural background and family income on the foods provided in households with children has been
estab-lished.26,27However, the emergence of Mexican American
ethnicity as the strongest positive predictor of good diet qual-ity indicates the urgent need to further explore the potential
underlying factors for this beneficial effect.
Table 2- Proportion of American preschoolers with maximum Revised Children’s Diet Quality Index (RC-DQI) component scores (in percent)
Component
Scoring Scheme
(ideal values) Maximum points
With maximum points
(%)
Added sugar (%kcal)* ≤ 10% of energy 10 33
Total fat (%kcal)* 25-35% of energy 2.5 45
Linoleic acid (%kcal)* ≤ 5-10% of energy 2.5 43
Linolenic acid (%kcal)* 0.6-1.2% of energy 2.5 22
DHA + EPA (%kcal)* ≤ 10% of a-linolenic acid 2.5 93
Grains (ounces)*† MyPyramid 5 72
Whole grains (ounces)*† MyPyramid 5 8
Fruits (cups)*† MyPyramid 10 45
Vegetables (cups)*† MyPyramid 10 46
100% Fruit juice* 12 ounces 10 24
Dairy (cups)*† MyPyramid 10 24
Iron (md/dL)‡ Dietary Reference Intake 10 71
Energy balance*§ Age- and gender-specific 10 17
DHA = docosahexaenoic acid; EPA = eicosapentaenoic acid.
* Continuous variables: for underconsumption point score = (actual intake/ideal intake) * maximum points and for overconsumption point score = maximum points - (actual intake/ideal intake) * 100%.
† MyPyramid age- and gender-specific intake recommendations:
Total grains: 3 ounces in 2-3 year olds, 4 ounces in 4-5 year-old girls, and 5 ounces in 4-5 year-old boys; 1 ounce = 28.4 g, for instance one slice of bread; Whole grains: 1/2 of the total grains.
Vegetables: 1 cup in 2-3 year olds, 2 cups in 4-5 year olds; 1 cup = 8 ounces = 240 mL.
Fruit: 1.5 cups in 2-3 year olds, 1.5 cups in 4-5 year-old girls, and 2 cups in 4-5 year-old boys; 1 cup = 8 ounces = 240 mL. Dairy: 2 cups per day in 2-5 year olds; 1 cup = 8 ounces = 240 mL.
‡ Iron: categorical variable based on age- and gender-specific Dietary Intake Reference values; less than estimated average requirement (EAR) (0 points), EAR-recommended dietary allowance (RDA) (5 points), or meets RDA (10 points).
§Time spent watching TV and estimated energy requirement (EER) combined score.
(TV score + energy score)/2 based on individual scores as follows:
TV score: ≤ 2 hours of TV = 10 points, if more than 2 hours point loss based on 10 points - (time spent TV/2 hours) * 100%.
Although this study was limited by the use of one single
24-hour recall to estimate usual intake, it is based on a large, nationally representative data set that was designed for
nutri-tion and health surveillance in the populanutri-tion. Clinicians may choose to ask the caretakers of young children to report
chil-dren’s usual diet, rather than intakes of the previous day alone.
The results presented here contribute new evidence to the diet-childhood obesity relationship. Although this study
focused on the difference between children with Hispanic and non-Hispanic background, results are applicable to other eth-nic groups as well in various countries. While large propor-tions of children in South America might not be considered Mexican but non-Hispanic white, dietary intake patterns are likely more similar to the Mexican American population than to Hispanic white American children. Furthermore, non-Hispanic white American children have similar rates of child-hood obesity as Latin American and Caribbean children.28
However, while parts of the preschool population in South
Table 3- Sociodemographic predictors of Revised Children’s Diet Quality Index (RC-DQI) scores in American preschoolers aged 2-5 years
Sociodemographic characteristic Beta coefficient
95% confidence
interval p
Total sample (n = 1,521)
Age (years) -2.38 -3.10 to -1.67 < 0.001
Ethnicity (referent non-Hispanic white)
Non-Hispanic black -1.23 -5.77 to 3.31 0.585
Mexican American 2.18 0.19 to 4.18 0.033
Non-Hispanic other 2.23 -2.04 to 6.50 0.295
Household income (poverty income ratio) 1.22 0.74 to 1.70 < 0.001
WIC* eligible (n = 861)
Age (years) -2.08 -3.06 to -1.10 < 0.001
Male (referent female) 1.87 0.09 to 3.65 0.039
Ethnicity (referent non-Hispanic white)
Non-Hispanic black -1.93 -5.93 to 2.06 0.331
Mexican American 3.57 1.08 to 6.05 0.006
Non-Hispanic other 3.93 -0.29 to 8.15 0.067
WIC participant (referent: non-participant) 2.03 -0.75 to 4.82 0.147
Food Stamp eligible (n = 676)
Age (years) -2.2 -3.10 to -1.33 < 0.001
Ethnicity (referent non-Hispanic White)
Non-Hispanic black -3.11 -7.39 to 1.16 0.147
Mexican American 2.75 -0.24 to 5.76 0.070
Non-Hispanic other 3.75 -0.48 to 7.99 0.080
Preschool attendance (referent: not in preschool) 2.13 -0.149 to 5.75 0.238
WIC participant (referent: non-participant) 2.71 -0.10 to 5.53 0.058
America are at high risk for childhood obesity, others are likely
to develop medical manifestations of malnutrition, such as stunting.
While several foods and nutrients have been found to be associated with chronic disease risk and dietary intake
rec-ommendations are based on these diet-disease relation-ships,29,30the direct association between lower diet quality
and increased risk childhood obesity was demonstrated in this
study. Results emphasized the need to improve overall diet quality, for instance by increasing whole grain, fruit, and veg-etable intake. Certain ethnic groups are likely to have much better diet quality than others, especially in the low-income population. Hence, low-income children should be encour-aged to consume foods common in the traditional Mexican diet, such as high proportions of fruits and vegetables to increase overall diet quality and decrease the risk for child-hood obesity in preschoolers.
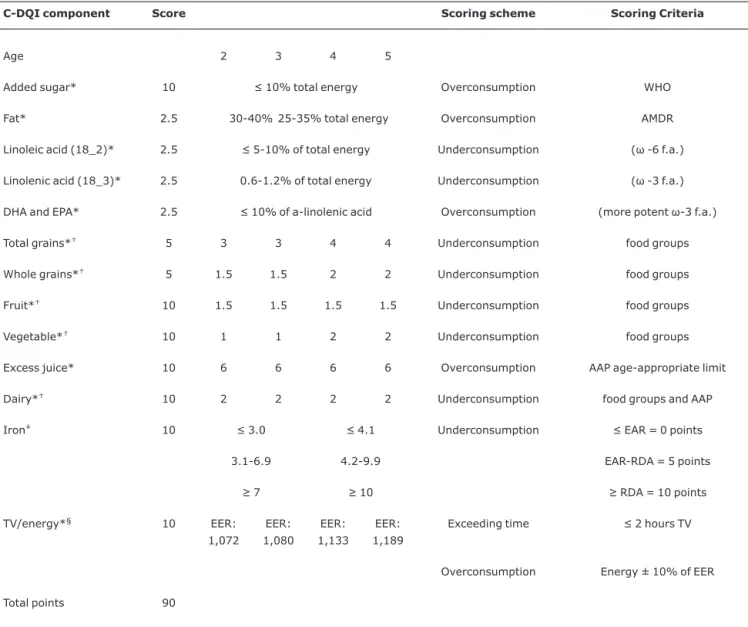
Table 4- Components and scoring scheme for the Revised Children’s Diet Quality Index (RC-DQI): girls
C-DQI component Score Scoring scheme Scoring Criteria
Age 2 3 4 5
Added sugar* 10 ≤ 10% total energy Overconsumption WHO
Fat* 2.5 30-40% 25-35% total energy Overconsumption AMDR
Linoleic acid (18_2)* 2.5 ≤ 5-10% of total energy Underconsumption (ω -6 f.a.)
Linolenic acid (18_3)* 2.5 0.6-1.2% of total energy Underconsumption (ω -3 f.a.)
DHA and EPA* 2.5 ≤ 10% of a-linolenic acid Overconsumption (more potent ω-3 f.a.)
Total grains*† 5 3 3 4 4 Underconsumption food groups
Whole grains*† 5 1.5 1.5 2 2 Underconsumption food groups
Fruit*† 10 1.5 1.5 1.5 1.5 Underconsumption food groups
Vegetable*† 10 1 1 2 2 Underconsumption food groups
Excess juice* 10 6 6 6 6 Overconsumption AAP age-appropriate limit
Dairy*† 10 2 2 2 2 Underconsumption food groups and AAP
Iron‡ 10 ≤ 3.0 ≤ 4.1 Underconsumption ≤ EAR = 0 points
3.1-6.9 4.2-9.9 EAR-RDA = 5 points
≥ 7 ≥ 10 ≥ RDA = 10 points
TV/energy*§ 10 EER:
1,072
EER:
1,080
EER:
1,133
EER:
1,189
Exceeding time ≤ 2 hours TV
Overconsumption Energy ± 10% of EER
Total points 90
AAP = American Academy of Pediatrics; AMDR = acceptable macronutrient distribution ranges; DHA = docosahexaenoic acid; EAR = estimated average requirement; EER = estimated energy requirement; EPA = eicosapentaenoic acid; RDA = recommended dietary allowance; WHO = World Health Orga-nization.
* Continuous score for overconsumption: maximum points - (actual intake/ideal intake) * 100%; underconsumption (actual intake/ideal intake) * maxi-mum points.
† Dietary guidelines MyPyramid food group patterns by age-appropriate energy patterns.
‡ Categorical variable based on less than EAR (0 points), EAR-RDA (5 points), or meets RDA (10 points). § Combined score: (TV score + energy score) / 2.
TV score: ≤ 2 hours of TV = 10 points.
References
1. Kranz S, Siega-Riz AM, Herring AH.Changes in diet quality of American preschoolers between 1977 and 1998.Am J Public Health. 2004;94:1525-30.
2. Ogden CL, Carroll MD, Curtin LR, McDowell MA, Tabak CJ, Flegal KM.Prevalence of overweight and obesity in the United States, 1999-2004.JAMA. 2006;295:1549-55.
3. Goodman E, Dolan LM, Morrison JA, Daniels SR.Factor analysis of clustered cardiovascular risks in adolescence: obesity is the predominant correlate of risk among youth.Circulation. 2005; 111:1970-7.
4. Huang TT, Ball GD, Franks PW.Metabolic syndrome in youth: Current issues and challenges.Appl Physiol Nutr Metab. 2007; 32:13-22.
5. Kranz S, Smiciklas-Wright H, Francis LA.Diet quality, added sugar, and dietary fiber intakes in American preschoolers.Pediatr Dent. 2006;28:164-71.
6. Epstein LH, Gordy CC, Raynor HA, Beddome M, Kilanowski CK, Paluch R.Increasing fruit and vegetable intake and decreasing fat and sugar intake in families at risk for childhood obesity.Obes Res. 2001;9:171-8.
Figure 1 - The proportion of preschoolers at risk for overweight or overweight with increasing Revised Children’s Diet Qual-ity Index (RC-DQI) total score quartiles in a nationally representative sample of American children 2-5 years old (n = 1,521)
Table 5- Components and scoring scheme for the Revised Children’s Diet Quality Index (RC-DQI): boys
C-DQI component Score Scoring scheme Scoring Criteria
Age 2 3 4 5
Added sugar* 10 ≤ 10% total energy Overconsumption WHO
Fat* 2.5 30-40% 25-35% total
energy
Overconsumption AMDR
Linoleic acid (18_2)* 2.5 ≤ 5-10% of total energy Underconsumption (ω -6 f.a.)
Linolenic acid (18_3)* 2.5 0.6-1.2% of total energy Underconsumption (ω -3 f.a.)
DHA and EPA* 2.5 ≤ 10% of a-linolenic acid Overconsumption (more potent ω-3 f.a.)
Total grains*† 5 3 3 5 5 Underconsumption food groups
Whole grains*† 5 1 1.5 2.5 2.5 Underconsumption food groups
Fruit*† 10 1.5 1.5 2 2 Underconsumption food groups
Vegetable*† 10 1 1 2 2 Underconsumption food groups
Excess juice* 10 6 6 6 6 Overconsumption AAP age-appropriate limit
Dairy*† 10 2 2 2 2 Underconsumption food groups and AAP
Iron‡ 10 ≤ 3.0 ≤ 4.1 Underconsumption ≤ EAR = 0 points
3.1-6.9 4.2-9.9 EAR-RDA = 5 points
≥ 7 ≥ 10 ≥ RDA = 10 points
TV/energy*§ 10 EER:
1,120
EER: 1,162
EER: 1,215
EER: 1,275
Exceeding time ≤ 2 hours TV
Overconsumption Energy ±10% of EER
Total points 90
AAP = American Academy of Pediatrics; AMDR = acceptable macronutrient distribution ranges; DHA = docosahexaenoic acid; EAR = estimated average requirement; EER = estimated energy requirement; EPA = eicosapentaenoic acid; RDA = recommended dietary allowance; WHO = World Health Orga-nization.
* Continuous score for overconsumption: maximum points - (actual intake/ideal intake) * 100%; underconsumption (actual intake/ideal intake) * maxi-mum points.
†Dietary guidelines MyPyramid food group patterns by age-appropriate energy patterns.
‡Categorical variable based on less than EAR (0 points), EAR-RDA (5 points), or meets RDA (10 points). §Combined score: (TV score + energy score) / 2.
TV score: ≤ 2 hours of TV = 10 points.
7. United States Department of Health and Human Services. The National Health and Nutrition Examination Survey. Hyattsville, MD: NCHS; 2004.
8. Census Bureau. How the census bureau measures poverty (official measure).http://www.census.gov/hhes/www/poverty/ povdef.html; 2004. Access: October 16, 2007.
9. United States Census Bureau. How the census bureau measures poverty. In: Census Bureau, Housing and Household Economic Statistics Division.http://www.census.gov/hhes/www/poverty/ poverty.html. Access: October 16, 2007.
10. Guenther PM, De Maio UJ, Ingwersen LA, Berlin MC. The multiple-pass approach for the 24-hour recall in the Continuing Survey of Food Intakes by Individuals. 994-6. FASEB J 1996;10:A198.
11. United States Department of Agriculture Human Nutrition Information Service. My pyramid.http://www.mypyramid.gov. Access: October 16, 2007.
12. Kranz S, Hartman T, Siega-Riz AM, Herring AH.A diet quality index for American preschoolers based on current dietary intake recommendations and an indicator of energy balance.J Am Diet Assoc. 2006;106:1594-604.
13. Institute of Medicine Food and Nutrition Board. Dietary reference intakes for vitamin a, vitamin k, arsenic, boron, chromium, copper, iodine, iron, molybdenum, nickel, silicon, vanadium, and zinc. Washington DC: National Academy Press; 2001.
14. Institute of Medicine of the National Academy of Sciences. Dietary reference intakes for energy, carbohydrate, fiber, fat, fatty acids, cholesterol, protein, and amino acids (macronutrients). Report. Washington, DC: National Academy Press; 2002.
15. Nicklas T, Johnson R, American Dietetic Association.Position of the American Dietetic Association: dietary guidance for healthy children ages 2 to 11. J Am Diet Assoc. 2004;104:660-77.
16. American Academy of Pediatrics Committee on Public Education.
Children, adolescents, and television. Pediatrics 2001;107:423-426.
17. American Academy of Pediatrics.Committee on Nutrition. American Academy of Pediatrics: The use and misuse of fruit juice in pediatrics (re0047).Pediatrics. 2001;107:1210-3.
18. Cole TJ.The LMS method for constructing normalized growth standards.Eur J Clin Nutr. 1990;44:45-60.
19. STATA corporation. Stata statistical software: Release 9.0. In. 9.0 ed. College Station, TX; 2005.
20. Wooldridge JM. Econometric analysis of cross section and panel data. Cambridge: MIT Press; 2002.
21. Field AE, Gillman MW, Rosner B, Rockett HR, Colditz GA.
Association between fruit and vegetable intake and change in body mass index among a large sample of children and adolescents in the United States.Int J Obes Relat Metab Disord. 2003;27:821-6.
22. Briefel RR, Reidy K, Karwe V, Jankowski L, Hendricks K.Toddlers' transition to table foods: Impact on nutrient intakes and food patterns. J Am Diet Assoc. 2004;104:s38-44.
23. Drewnowski A, Darmon N.Food choices and diet costs: an economic analysis.J Nutr. 2005;135:900-4.
24. Siega-Riz AM, Kranz S, Blanchette D, Haines PS, Guilkey DK, Popkin BM.The effect of participation in theWICc program on preschooler's diets.J Pediatr. 2004;144:229-34.
25. Rose D, Habicht JP, Devaney BL.Household participation in the Food Stamp and WIC programs increases the nutrient intakes of preschool children.J Nutr. 1998;128:548-55.
26. Kranz S, Siega-Riz AM.Sociodemographic determinants of added sugar intake in preschoolers 2 to 5 years old.J Pediatr. 2002;140:667-72.
27. Patrick H, Nicklas TA.A review of family and social determinants of children's eating patterns and diet quality.J Am Coll Nutr. 2005;24:83-92.
28. Duran P, Caballero B, de Onis M.The association between stunting and overweight in Latin American and Caribbean preschool children.Food Nutr Bull. 2006;27:300-305.
29. Gidding SS, Dennison BA, Birch LL, Daniels SR, Gillman MW, Lichtenstein AH, et al; American Heart Association; American Academy of Pediatrics.Dietary recommendations for children and adolescents: A guide for practitioners: consensus statement from the American Heart Association. Circulation. 2005; 112:2061-75.
30. Pereira MA, Jacobs DR, Jr.Van Horn L, Slattery ML, Kartashov AI, Ludwig DS. Dairy consumption, obesity, and the insulin resistance syndrome in young adults: the CARDIA Study. JAMA. 2002;287:2081-9
Correspondence: Sibylle Kranz
Department of Nutritional Sciences, Population Research Institute
Pennsylvania State University 5 G Henderson Building