New reference values for maximal respiratory
pressures in the Brazilian population*
,**
Novos valores de referência para pressões respiratórias máximas na população brasileira
Dirceu Costa, Helena Amaral Gonçalves, Luciana Peraro de Lima, Daniela Ike, Karina Maria Cancelliero, Maria Imaculada de Lima Montebelo
Abstract
Objective: To compare MIP and MEP determined in healthy subjects with those predicted using the equations
proposed in another study, and, if necessary, to suggest new equations for MIP and MEP to be used in the Brazilian
population. Methods: The study sample comprised 60 healthy males and 60 healthy females, 20-80 years of age
(20 subjects per ten-year age bracket). Maximal respiratory pressures were determined following a standardized protocol. Results: Regarding MIP, the measured values were significantly lower than those predicted for both males (31%) and females (24%). There were no significant differences between measured and predicted MEP in either gender. We found that age presented the greatest power to predict MIP and MEP in both genders. New
equations were proposed. Conclusions: The previously proposed equations were unable to predict MIP and MEP
for all of the subjects in our sample. Therefore, the results of this study can facilitate the prediction of respiratory muscle strength in healthy adult subjects in Brazil. Further studies, involving subjects from different regions of the country, could lead to the development of better tables or equations for maximal respiratory pressures in the Brazilian population.
Keywords: Respiratory muscles; Muscle strength; Reference values.
Resumo
Objetivo: Comparar PImáx e PEmáx medidas em indivíduos saudáveis com os valores previstos utilizando-se
as equações propostas em outro estudo e, se necessário, sugerir novas equações para PImáx e PEmáx para a
população brasileira. Métodos: Participaram do estudo 60 homens e 60 mulheres saudáveis com idades entre 20 e
80 anos (20 indivíduos por faixa etária de 10 anos). As pressões respiratórias máximas foram determinadas segundo
um protocolo padronizado. Resultados: Os valores medidos de PImáx foram significativamente menores que
aqueles previstos tanto para homens (31%) e mulheres (24%). Não houve diferenças significativas entre a PEmáx medida e prevista nos dois gêneros. A idade provou ser a variável com melhor poder preditivo para PImáx e PEmáx nos dois gêneros. Novas equações foram propostas. Conclusões: As equações propostas no estudo prévio não foram capazes de predizer PImáx e PEmáx de todos os indivíduos de nossa amostra. Portanto, os resultados deste estudo podem facilitar a predição da força muscular respiratória de adultos saudáveis no Brasil. Novos estudos, com indivíduos de diferentes regiões do país, poderão contribuir para o desenvolvimento de melhores tabelas ou equações para as pressões respiratórias máximas na população brasileira.
Descritores: Músculos respiratórios; Força muscular; Valores de referência.
* Study carried out at the Universidade Nove de Julho – UNINOVE, Nove de Julho University – São Paulo, Brazil, and Universidade Metodista de Piracicaba – UNIMEP, Methodist University of Piracicaba, Piracicaba, Brazil.
Correspondence to: Dirceu Costa. Programa de Pós-Graduação em Ciência de Reabilitação, Universidade Nove de Julho, Avenida Francisco Matarazzo, 612, Água Branca, CEP 05001-100, São Paulo, SP, Brasil.
Tel. 55 11 3665-9325. E-mail: [email protected] or [email protected]
Financial support: This study received financial support from the Conselho Nacional de Desenvolvimento Científico e Tecnológico (CNPq, National Council for Scientific and Technological Development), process # 502727/2007-1 and 301381/2005-4.
Submitted: 2 March 2009. Accepted, after review: 7 January 2010.
that there are differences among studies for certain variables, and that new equations should therefore be drawn up.
Methods
The study sample comprised 120 healthy subjects (60 males and 60 females), 20-80 years of age, residing in the city of São Carlos, located in the state of São Paulo, Brazil. Each of the six ten-year age brackets used in the study included 10 male and 10 female subjects.
The volunteers were selected according to the criteria of having a BMI between 18.0 and 29.5 kg/m2(8) and being a nonsmoker. Subjects with a history of respiratory or cardiovascular disease were excluded, as were those with any neuromuscular disease that would prevent the tests from being performed. All of the volunteers received guidance and information about the study procedures, in accordance with Brazilian National Health Council Resolution 196/96. The human research ethics committee of the institution approved the study (Protocol # 01/06), and the participants gave written informed consent.
After the anamnesis, during which an evaluation record, containing questions about smoking, practice of regular physical activity, presence of cardiovascular and respiratory dysfunction, family history and medications in use, was filled out, the anthropometric measures were collected. Weight and height were measured with a calibrated scale (Welmy S.A., Santa Bárbara do Oeste, Brazil), whereas BMI was calculated according to the formula BMI = weight (kg)/height2 (m2).
We determined MIP and MEP values with a previously calibrated aneroid vacuum manometer (GER-AR, São Paulo, Brazil), graduated in cmH2O, with a range of ± 300 cmH2O. The manometer was equipped with a mouthpiece adapter containing an orifice of approximately 2 mm in diameter in order to prevent a rise in the intraoral pressure generated by the contraction of the buccinator muscles, thereby hindering interference in the results, in accordance with the recommendations given in two studies.(5,9)
The volunteers remained seated, with the trunk at an angle of 90° with the hip, and their feet on the ground, using a nasal clip in all maneuvers.
Introduction
In 1969, Black & Hyatt(1) introduced a simple form of measuring maximal respiratory pressures with a manometer/vacuum manometer graduated in cmH2O, showing that this constituted a quantitative measure of the function and strength of the respiratory muscles.(2) Since then, respiratory muscle strength has universally been measured by determining maximal respiratory pressures.
The measurement of respiratory muscle strength is carried out by assessing the maximal static respiratory pressure generated in the mouth after complete inhalation and exhalation, characterizing, respectively, MIP and MEP, which are indicative of the strength of the inspiratory and expiratory muscle groups.(3) According to one study,(4) MIP is a measure of inspiratory muscle strength, whereas MEP measures the strength of abdominal and intercostal muscles. The determination of MIP and MEP is a simple, practical and accurate method.
Due to the importance of measuring maximal respiratory pressures, especially in respiratory therapy, various studies have been conducted in an endeavor to establish tables with predicted values for MIP and MEP, considering factors such as age, gender and height in different populations. In Brazil, there have been few studies regarding reference values for maximal respiratory pressures, although a few have been of note: Camelo Jr. et al.(5) were the first authors to suggest MIP and MEP values for the adult Brazilian population; Neder et al.(6) proposed predictive equations for the Brazilian population; and Parreira et al.(7) discovered that the equations proposed by Neder et al.(6) were not capable of predicting MIP and MEP values in the target population.
The correlations of MIP and MEP with the independent variables (age, weight, height and BMI) were determined by means of Pearson’s correlation coefficient. The variables that presented statistically significant correlations were placed in linear regression models in order to establish the predictive equations for the respiratory pressures.
Finally, the percentage variability for MIP and MEP values measured in the sample was calculated with the predicted values, together with the confidence interval for each age bracket, separated by gender, in order to determine to which age brackets the new proposed equations would be more adequate. The level of significance was set at p ≤ 0.05.
Results
The anthropometric data of the study sample are presented in Table 1.
The measures of maximal respiratory pressures found in this study were compared with the predicted values using the equations by Neder et al.(6), separated by gender.
All of the MIP values measured in the sample were lower than those predicted for both males and females, and these differences were significant (p ≤ 0.05). However, no significant differences were found between measured and predicted MEP values for males and females (Table 2).
For the determination of MIP, subjects were asked to make a maximal inspiratory effort, starting from RV, whereas, for that of MEP, a maximal expiratory effort, starting from TLC, was elicited.(10) All of the subjects performed at least three reproducible maneuvers, each maintained for at least one second, until three technically adequate efforts had been made. For data analysis, the highest value was recorded, provided that it did not exceed the second highest value by 10%. We compared the values measured in this study with those predicted using the equations proposed by Neder et al.(6) for MIP and MEP, as follows:
For males:
• MIP: y = −0.80 × age + 155.3 • MEP: y = −0.81 × age + 165.3 For females:
• MIP: y = −0.49 × age + 110.4 • MEP: y = −0.61 × age + 115.6
Data were statistically analyzed with the Statistical Package for the Social Sciences, version 11.0 (SPSS Inc., Chicago, IL, USA). Initially, to compare the measured values with those predicted using the equations proposed by Neder et al.,(6) the Shapiro-Wilk test was used for assessing normal distribution. Student’s t-test was used for variables with normal distribution, whereas the Wilcoxon test was used for those with non-normal distribution. For the Bland &
Altman plots, MedCalc, version 9.4.1.0 (MedCalc Software, Mariakerke, Belgium) was used.
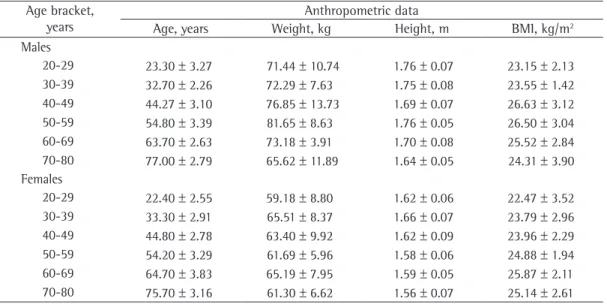
Table 1 - Anthropometric data of the study sample by gender and age bracket.a
Age bracket, years
Anthropometric data
Age, years Weight, kg Height, m BMI, kg/m2
Males
20-29 23.30 ± 3.27 71.44 ± 10.74 1.76 ± 0.07 23.15 ± 2.13
30-39 32.70 ± 2.26 72.29 ± 7.63 1.75 ± 0.08 23.55 ± 1.42
40-49 44.27 ± 3.10 76.85 ± 13.73 1.69 ± 0.07 26.63 ± 3.12
50-59 54.80 ± 3.39 81.65 ± 8.63 1.76 ± 0.05 26.50 ± 3.04
60-69 63.70 ± 2.63 73.18 ± 3.91 1.70 ± 0.08 25.52 ± 2.84
70-80 77.00 ± 2.79 65.62 ± 11.89 1.64 ± 0.05 24.31 ± 3.90
Females
20-29 22.40 ± 2.55 59.18 ± 8.80 1.62 ± 0.06 22.47 ± 3.52
30-39 33.30 ± 2.91 65.51 ± 8.37 1.66 ± 0.07 23.79 ± 2.96
40-49 44.80 ± 2.78 63.40 ± 9.92 1.62 ± 0.09 23.96 ± 2.29
50-59 54.20 ± 3.29 61.69 ± 5.96 1.58 ± 0.06 24.88 ± 1.94
60-69 64.70 ± 3.83 65.19 ± 7.95 1.59 ± 0.05 25.87 ± 2.11
70-80 75.70 ± 3.16 61.30 ± 6.62 1.56 ± 0.07 25.14 ± 2.61
• MEP: y = −1.26 × age + 183.31
• (R2 = 48.9; RSE = 586.81; SEE = 24.22; 5th percentile = −38.95)
Females:
• MIP: y = −0.46 × age + 74.25
• (R2 = 24.8; RSE = 300.72; SEE = 17.20; 5th percentile = −28.83)
• MEP: y = −0.68 × age + 119.35
• (R2 = 35.14; RSE = 315.33; SEE = 17.76; 5th percentile = −23.24).
where R2 is the coefficient of determination, RSE is the residual standard error, and SEE is the standard error of the estimate.
Considering the variability for the predicted values, it was shown that the fluctuation was greater for MIP than for MEP, especially for males in the 30-39 year age bracket. For females, the fluctuation was greater for MIP, but with the greatest variability in the 70-80 year age bracket.
Discussion
The search for reference values for respiratory muscle strength has encouraged researchers in several countries to establish equations. Johan et al.(11) compared MIP and MEP values in Chinese, Malaysian and Indian adults and found significant ethnic differences in the respiratory pressures. Bruschi et al.(12) established equations for the Italian population, considering age and gender, as well as body surface area.
When Pearson’s correlation coefficient was used to determine which variables would better explain the respiratory pressure values, MIP correlated positively with height and weight for males (r = 0.34; p = 0.008 and r = 0.33; p = 0.01, respectively), as did MEP for males (r = 0.38; p =0.03 and r = 0.294; p =0.02, respectively). However, MIP and MEP negatively correlated with age (r = −0.72 and r = −0.68, respectively; p < 0.001 for both).
For females, MIP presented a weakly positive correlation with height (r = 0.269; p = 0.04) and a moderately negative correlation with age (r = −0.49; p < 0.001), whereas MEP only presented a moderately negative correlation with age (r = −0.405; p = 0.001).
The concordance between measured and predicted values was visually assessed using Bland & Altman plots (Figures 1 and 2).
Since age was the variable with the best predictive power regarding maximal respiratory pressures, this variable was considered in a simple regression analysis model in order to establish the equations for MIP and MEP. On the basis of the linear regression model, considering gender and age as predictive variables, the following equations for MIP and MEP are proposed for the Brazilian population:
Males:
• MIP: y = −1.24 × age + 232.37
• (R2 = 60.73; RSE = 356.58; SEE = 18.88; 5th percentile = −23.38)
Table 2 - Measured and predicted MIP and MEP for males and females.a
Age bracket, years
MIP, cmH2O MEP, cmH2O
Measured Predicted Measured Predicted
Men
20-29 −113.5 ± 18.11 −136.72 ± 2.53* 148 ± 29.46 146.43 ± 2.65
30-39 −120 ± 16.16 −129.14 ± 1.81* 135.5 ± 31.92 138.81 ± 1.83
40-49 −100.42 ± 16.44 −119.97 ± 2.38* 127.08 ± 19.59 129.53 ± 2.41
50-59 −86 ± 26.23 −114.46 ± 10.85* 112.5 ± 27.21 120.91 ± 2.75
60-69 −85.00 ± 22.61 −104.34 ± 2.10* 104.00 ± 22.09 113.70 ± 2.13
70-80 −53 ± 19.18 −93.7 ± 2.23* 74.5 ± 22.79 102.93 ± 2.26
Women
20-29 −80.50 ± 20.06 −99.42 ± 1.25* 100.00 ± 18.41 101.94 ± 1.55
30-39 −82.5 ± 22.88 −93.64 ± 1.69* 94 ± 17.61 95.29 ± 1.77
40-49 −78.6 ± 20.94 −88.50 ± 1.44* 105.5 ± 25.54 88.27 ± 1.70
50-59 −69 ± 19.41 −83.84 ± 1.61* 88.5 ± 21.35 82.54 ± 2.01
60-69 −63.5 ± 13.55 −78.70 ± 1.88* 71 ± 9.07 76.13 ± 2.34
70-80 −52 ± 11.83 −73.31 ± 1.55* 66.5 ± 14.15 69.42 ± 1.93
aValues expressed as mean ± SD; each age bracket comprised 10 subjects. *p ≤ 0.05 vs. measured values from the
the equations by Neder et al.(6) were incapable of predicting MIP and MEP in the present study.
Considering that the methodology used in the present study was similar to that employed in the study conducted by Neder et al.,(6) one possible explanation for these differences could be that, in that study,(6) the diameter of the orifice of the measuring instrument was not specified. This might have resulted in overestimated values, due to undesired contraction of the buccinator muscles, since the activation of these muscles can generate a pressure that interferes with that According to the results obtained in the
present study, MIP was shown to be significantly lower than the predicted values using the equations proposed by Neder et al.(6) for both males (a difference of 31%) and females (a difference of 24%) in the 20-80 year age bracket. Although MEP was predominantly lower, there were no statistically significant differences between the measured and predicted values for either gender (differences of 10% and 6% for males and females, respectively). Therefore, our results showed that the predicted values using
Figure 2 - Concordance between mean MEP values (measured and predicted) for males (in A) and females (in B), by age bracket, using Bland & Altman plots. Mean ± 1.96 SD (in cmH2O); 95% CI vs. mean of the difference between the mean values (measured MEP − predicted MEP).
for this decrease, according to the authors, was the sarcopenia associated with the aging process. According to a few studies,(2,14,19) respiratory muscle strength decreases approximately 8-10% per decade from the age of 40 onward.
Black and Hyatt(1) measured MIP and MEP in healthy subjects 20-86 years of age and formulated an equation related to the age parameter. Other authors(13) measured the same parameters in White individuals (adults and children), using age, height and weight to consider equations in order to determine predicted values.
Similarly to Neder et al.,(6) we observed that age had the greatest predictive power. Using gender and age as variables, we proposed new equations for the determination of respiratory muscle strength in the Brazilian population. However, in order to determine in which age brackets the proposed new equations could best be applied, the percentage variability for MIP and MEP values that were measured was calculated together with the predicted values, and we found that the proposed equations would be better adjusted for MIP for males from the age of 30 onward and for females in the 70-80 year age bracket.
In conclusion, the results of this study can contribute to that by Neder et al.(6) in order to predict the inspiratory muscle strength in particular. Therefore, this study shows that the new equations for the determination of MIP and MEP are possible alternatives and can be used for some age brackets, confirming the initial hypothesis of the study. It is important to point out that further studies are still necessary, involving a greater sample of subjects from various regions in Brazil so that new tables or equations for the determination of maximal respiratory pressures in the Brazilian population can be drawn up.
References
1. Black LF, Hyatt RE. Maximal respiratory pressures: normal values and relationship to age and sex. Am Rev Respir Dis. 1969;99(5):696-702.
2. McConnell AK, Copestake AJ. Maximum static respiratory pressures in healthy elderly men and women: issues of reproducibility and interpretation. Respiration. 1999;66(3):251-8.
3. Costa D. Fisioterapia Respiratória Básica. São Paulo: Editora Atheneu; 1999.
4. Mangelsdorff G, Borzone G, Leiva A, Martínez A, Lisboa C. Strength of inspiratory muscles in chronic heart failure
produced by the respiratory muscles.(10) However, if one is dealing with possible methodological differences in terms of data collection, this hypothesis must be considered with caution.
One group of authors(7) recently measured MIP and MEP in a population of healthy subjects from three Brazilian cities and compared the values obtained with those predicted by Neder et al.(6) The authors showed that, for females, the mean MIP values were significantly lower than those predicted, whereas, for males, the mean MEP values were significantly higher than those predicted. However, MEP for females and MIP for males showed no significant differences. Few of the values found were within the range predicted for the age bracket, and the authors concluded that the Neder et al. equations(6) were not capable of predicting MIP and MEP for that sample, a finding that is in agreement with the results of the present study.
Our measurements were lower than those previously reported for adults(1,5,13) and for elderly subjects (over the age of 65 years).(2,14) However, they were higher than those reported for Asian subjects(11) and similar to those found for White subjects.(15)
In the correlation of the variables with the maximal respiratory pressures, the results of the present study revealed that MIP and MEP showed a strong negative correlation with age, both for males and females, and a weak positive correlation with weight and height for males, whereas only MIP had this type of correlation with height for females.
In two studies,(13,15) height was shown to be a negative predictor only for females, and, in two studies,(15,16) weight was shown to be a positive predictor for both genders. From this aspect, MIP correlated positively with weight for males in the study conducted by Neder et al.(6) According to one group of authors,(17) the influence of weight on maximal respiratory pressures might be due to the fact that this variable would be related to muscle mass and, therefore, alterations in weight could affect the diaphragm mass, exerting an influence on respiratory muscle performance.
mouth pressures: a population-based study. Am Rev Respir Dis. 1992;146(3):790-3.
13. Wilson SH, Cooke NT, Edwards RH, Spiro SG. Predicted normal values for maximal respiratory pressures in caucasian adults and children. Thorax. 1984;39(7):535-8.
14. Enright PL, Kronmal RA, Manolio TA, Schenker MB, Hyatt RE. Respiratory muscle strength in the elderly. Correlates and reference values. Cardiovascular Health Study Research Group. Am J Respir Crit Care Med. 1994;149(2 Pt 1):430-8.
15. Harik-Khan RI, Wise RA, Fozard JL. Determinants of maximal inspiratory pressure. The Baltimore Longitudinal Study of Aging. Am J Respir Crit Care Med. 1998;158(5 Pt 1):1459-64.
16. Leech JA, Ghezzo H, Stevens D, Becklake MR. Respiratory pressures and function in young adults. Am Rev Respir Dis. 1983;128(1):17-23.
17. Arora NS, Rochester DF. Respiratory muscle strength and maximal voluntary ventilation in undernourished patients. Am Rev Respir Dis. 1982;126(1):5-8.
18. Watsford ML, Murphy AJ, Pine MJ. The effects of ageing on respiratory muscle function and performance in older adults. J Sci Med Sport. 2007;10(1):36-44.
19. Chen HI, Kuo CS. Relationship between respiratory muscle function and age, sex, and other factors. J Appl Physiol. 1989;66(2):943-8.
and chronic pulmonary obstructive disease [Article in Spanish]. Rev Med Chil. 2001;129(1):51-9.
5. Camelo Jr JS, Terra Filho J, Manço JC. Pressões respiratórias máximas em adultos normais. J Pneumol. 1985;11(4):181-4.
6. Neder JA, Andreoni S, Lerario MC, Nery LE. Reference values for lung function tests. II. Maximal respiratory pressures and voluntary ventilation. Braz J Med Biol Res. 1999;32(6):719-27.
7. Parreira VF, França DC, Zampa CC, Fonseca MM, Tomich GM, Britto RR. Pressões respiratórias máximas: valores encontrados e preditos em indivíduos saudáveis. Rev Bras Fisioter. 2007;11(5):361-8.
8. Coutinho W. Consenso latino-americano de obesidade. Arq Bras Endocrinol Metab. 1999;43(1):21-67. 9. Sobush DC, Dunning M 3rd. Assessing maximal
static ventilatory muscle pressures using the “bugle” dynamometer. Suggestion from the field. Phys Ther. 1984;64(11):1689-90.
10. Souza RB. Pressões respiratórias estáticas máximas. J Pneumol. 2002;28(Suppl 3):S155-S65.
11. Johan A, Chan CC, Chia HP, Chan OY, Wang YT. Maximal respiratory pressures in adult Chinese, Malays and Indians. Eur Respir J. 1997;10(12):2825-8. 12. Bruschi C, Cerveri I, Zoia MC, Fanfulla F, Fiorentini M,
Casali L, et al. Reference values of maximal respiratory
About the authors
Dirceu Costa
Adjunct Professor. Postgraduate Program in Physiotherapy, Universidade Federal de São Carlos – UFSCar, Federal University of São Carlos – São Carlos, Brazil. Professor. Postgraduate Program in Rehabilitation Science, Universidade Nove de Julho – UNINOVE – São Paulo, Brazil.
Helena Amaral Gonçalves
Physiotherapist. Student in the Continuing Education Course in Respiratory Therapy, Universidade Estadual de Campinas – Unicamp, State University at Campinas – Campinas, Brazil.
Luciana Peraro de Lima
Physiotherapist. Universidade Metodista de Piracicaba – UNIMEP, Methodist University at Piracicaba – Piracicaba, Brazil.
Daniela Ike
Physiotherapist. Preventive Medicine Program, Unimed de Piracicaba, Piracicaba, Brazil.
Karina Maria Cancelliero
PhD in Physiotherapy. Universidade Federal de São Carlos – UFSCar, Federal University of São Carlos – São Carlos, Brazil.
Maria Imaculada de Lima Montebelo