Contents lists available atScienceDirect
Agriculture, Ecosystems and Environment
j o u r n a l h o m e p a g e :w w w . e l s e v i e r . c o m / l o c a t e / a g e e
Soil emissions of NO, N
2
O and CO
2
from croplands in the savanna region of
central Brazil
Êrika B. Fernandes Cruvinel
a,∗, Mercedes M. da C. Bustamante
b, Alessandra R. Kozovits
c, Richard G. Zepp
daFederal Institute of Education, Science and Technology of Brasília, Gama Campus, 72.450-025, Brazil bUniversity of Brasilia, Department of Ecology, 70.910-900, Brazil
cFederal University of Ouro Preto, Department of Biodiversity, Evolution and Environment, 35.400-000, Brazil dEnvironmental Protection Agency, College Station Road, Athens, GA 30.605-2700, United States
a r t i c l e
i n f o
Article history:
Received 21 September 2010 Received in revised form 16 July 2011 Accepted 21 July 2011
Available online 18 September 2011
Keywords:
Land use Cerrado
Trace gas emissions No-till systems Emission factors
a b s t r a c t
In the last 40 years, a large area of savanna vegetation in Central Brazil (Cerrado) has been converted to agriculture, with intensive use of fertilizers, irrigation and management practices. Currently, the Cerrado is the main region for beef and grain production in Brazil. However, the consequences of these agricultural practices on NO, N2O and CO2emissions from soil to atmosphere are still poorly investigated. The
objec-tives of this study were to quantify soil emissions of NO-N, N2O-N and CO2-C in different no-till cultivation
systems in comparison with native savanna vegetation. The agricultural areas included: (a) the maize and Brachiaria ruziziensesintercropping system followed by irrigated bean in rotation; (b) soybean followed by natural fallow; and (c) cotton planting overB. ruziziensesstraw. The study was performed from August 2003 to October 2005 and fluxes were measured before and after planting, after fertilizations, during the growing season, before and after harvesting. NO-N fluxes in the soybean field were similar to those measured in the native vegetation. In the cornfield, higher NO-N fluxes were measured before planting than after planting and pulses were observed after broadcast fertilizations. DuringBrachiariacultivation NO-N fluxes were lower than in native vegetation. In the irrigated area (bean cultivation), NO-N fluxes were also significantly higher after broadcast fertilizations. Most of the soil N2O-N fluxes measured under
cultivated and native vegetation were very low (<0.6 ng N2O-N cm−2h−1) except during bean cultivation
when N2O-N fluxes increased after the first and second broadcast fertilization with irrigation and during
nodule senescence in the soybean field. Soil respiration values from the soybean field were similar to those in native vegetation. The CO2-C fluxes during cultivation of maize and irrigated bean were twice
as high as in the native vegetation. During bean cultivation with irrigation, an increase in CO2-C fluxes
was observed after broadcast fertilization followed by a decrease after the harvest. Significantly lower soil C stocks (0–30 cm depth) were determined under no-tillage agricultural systems in comparison with the stocks under savanna vegetation. Fertilizer-induced emission factors of N oxides calculated from the data were lower than those indicated by the IPCC as default.
© 2011 Published by Elsevier B.V.
1. Introduction
The savannas of central Brazil, locally known as Cerrado, have been the focus of intense agricultural expansion since the 1970s. By 2002, approximately 80 million hectares, corresponding to about 39.5% of the total Cerrado area, had already been converted into dif-ferent land uses. Cultivated pastures and agriculture fields occupy 26.5 and 10.5% of the Cerrado, respectively (Sano et al., 2008). If cattle ranching over natural grasslands (about 23 million ha) and
∗Corresponding author. Tel.: +55 61 2103 2259.
E-mail address:[email protected](Ê.B. Fernandes Cruvinel).
secondary forests are accounted for, the overall agro-pastoral land-use in the Cerrado biome increases to about 47% (Bustamante and Ferreira, 2011). Although pasture is still the main land use in the region, croplands are continuously expanding, especially for the cultivation of soybean and maize. The gentle relief of the Cerrado region that has favored mechanized agriculture and the devel-opment of cultivars adapted to soils and seasonal climate were particularly important factors in cropland expansion. In the case of soybean (Glycine max), nitrogen is derived from biological N2
fixation (BNF) reducing costs of nitrogen fertilization and making production economically more feasible in Brazil (Alves et al., 2003). Brazil is the third largest world producer of maize. Maize productiv-ity has been growing systematically (from 1.9 in 1990 to 3.3 t ha−1
2004–2005 (MAPA, 2008) due to the use of modern technology, mechanization and high inputs of fertilizer and biocides (on average ten applications of biocides during the crop cycle). Although com-mon bean is not an important export product, it is the main source of protein for less privileged segments of the Brazilian population. In contrast to soybeans, N fixing symbiosis is not very effective in beans and productivity gains are related to the use of N fertilization (Vargas et al., 1994).
The rapid expansion of agriculture in the Cerrado region was accompanied by deforestation, intensive use of fertilizers, irriga-tion and other management practices that are related to substantial changes in biogeochemical cycles. Agricultural practices have been known to affect emission rates of trace gases from soil to the atmo-sphere (Jambert et al., 1997; Sitaula et al., 2000; Akiyama et al., 2000; Giacomini et al., 2006) and some of these gases have impor-tant effects on atmosphere chemistry. The production and emission of NO, N2O and CO2from soil are the result of the mineralization of
organic matter and depend on environmental factors, such as inor-ganic N availability, temperature, soil moisture and land use (Hall et al., 1996).
In spite of the changes in intense land use in the region, little information exists on trace gas emissions from cropland soils in the Cerrado.Carvalho et al. (2006)found higher NO fluxes immediately and three days after N fertilization and irrigation in maize fields under conventional and no-tillage systems, but N2O fluxes were
under the detection limit. Low N2O soil fluxes after N fertilization
were measured from a rotation rice-Brachiaria-soybean-Crotalaria
under conventional and no-till management practices in the Cer-rado region (Metay et al., 2007).
In this context, the objectives of this study were: (1) to quantify the soil emissions of NO-N, N2O-N and CO2-C during the cultivation
cycle of different crops in no-till systems in the Cerrado region in comparison to native vegetation, and (2) to determine the relation-ships between soil trace gas fluxes and soil N and C, temperature and moisture.
2. Methods
2.1. Study sites
The study was carried out at two commercial farms: Dom Bosco Farm and Pamplona Farm, both located in the municipality of Cristalina (Federal State of Goiás, Brazil). Study areas character-istics, soil classification and soil characteristics of the study sites are presented inTable 1. The climate is tropical (Köppen Aw) with two well-defined seasons: dry season (May to September) and wet season (October to April), during which 90% of the annual precip-itation occurs. Rainfall was measured daily in the Dom Bosco and Pamplona Farms. Total precipitation is presented inTable 1while Fig. 1presents monthly distribution of rainfall. At the Dom Bosco Farm two cultivation systems under no-till and with mechanical harvest were studied: (a) Maize (Zea maizcv. 30k75) andBrachiaria ruzizienses intercropping system followed by irrigated bean (Phaseolus vulgaris, type “Preto”), hereafter maize-Brachiaria-bean rotation. This cultivation system was introduced in 1998 after ten years ofBrachiariasp. cultivation following conversion from native vegetation using slash-and-burn. (b) Soybean (G. maxcv. P98C81 Pioneer) followed by natural fallow (no winter cover crop). The crop was introduced in 1977 after removal of native vegetation
Coordinates 16◦18′S and 47◦30′W 16◦15′S and 47◦37′W
Altitude 826 m 826 m
Total precipitation (study period)
2078.5 mm (Aug 2003 to Oct 2004)
1555 mm (Nov 2004 to Aug 2005)
Soil classification
Brazilian Soil Taxonomy (Embrapa, 1999)
Latossolo Vermelho Latossolo Vermelho
US Soil Taxonomy Oxisols Oxisols
Soil characteristics (0–20 cm depth)
pH
Native soil 4.2–4.4 4.2–4.4
Cultivated soils 5.1–5.9 5.1–5.9
Cation exchange capacity-ECEC
Native soil 9.0 cmol C kg−1 9.0 cmolc kg−1
Cultivated soils 8.5 cmol C kg−1 10.4 cmolc kg−1
Base saturation
Native soil 11.0% 11.0%
Cultivated soils 74.3% 57.7%
Clay content (0–5 cm depth)
Native soil 67.8±4.2% 75.9±1.9%
Cultivated soils 48.8±6.5%
(maize-Brachiaria-bean rotation) 67.6field)±4.7% (cotton
72.2±5% (soybean field)
Drainage Well-drained Well-drained
using slash-and-burn and soybean seeds are inoculated with
Bradyrizobium japonicum. A native cerrado area with the same soil type was selected as reference site. This area has been protected from fire since 1974 but it burned accidentally in October 2004 before the last measurement of soil emissions.
At the Pamplona Farm an area cultivated with cotton (yield of 4.5 t ha−1) under no-till and mechanically harvested was used
in this study. Herbaceous cotton (Gossypium hirsutumcv. ITA 90-Pioneer) was cultivated overB. ruziziensesstraw.B.ruzizienseswas planted by airplane and dried with herbicide (2,4D – U46DFluid 868/720 CS) 20 days before cotton planting. Previously, the area was cultivated with soybean followed by natural fallow during win-ter. This rotation system was established in 1980 after removal of native vegetation using slash-and-burn. This study includes only the period cultivated with cotton. A native cerradostricto sensu
area with the same soil type was chosen as reference site. This area has been protected from fire since 1994 but it burned accidentally in November 2004 before the first gas flux measurement.Table 2 presents details on the areas under cultivation including period of measurements, cropping cycles and management practices.
The management of fertilizers was representative of the agri-cultural practices in central Brazil region. In general, for soybean only one N-application is performed together with P-addition dur-ing plantdur-ing. For the other crops, besides the N-fertilization durdur-ing planting, one (bean) or two (maize and cotton) broadcast fertil-izations are made during crop growth. In the present study, two broadcast N-fertilizations were made during bean cultivation. The second broadcast fertilization was performed with a relative low amount of urea because of the low temperatures just after the first fertilization.
2.2. Physical and chemical characterization of soils
Soil samples (0–20 cm depth) for chemical characterization were collected before the beginning of trace gas measurements (July 2003) in each cultivation system and in native areas. Soil samples (0–5 cm depth) were collected in 20 points distributed randomly for texture determination per system.
2.3. Trace gas flux measurements
In each area one plot of 10 m×15 m was selected for trace gas sampling. In the Dom Bosco Farm (soybean, maize-irrigated bean and native vegetation) six replicates for soil NO-N and CO2
-C and four replicates for N2O-N measurements were made. In the
native area N2O-N fluxes were collected only from August 2003 to
February 2004 because fluxes were mostly under the detection lim-its in accordance with previous results fromPinto et al. (2002)and Varella et al. (2004). In the cotton field (Pamplona Farm) the fluxes of NO-N and CO2-C were measured in three replicates in planted
rows and in three replicates between rows while in the native area six replicates were measured for NO-N and CO2-C fluxes. N2
O-N fluxes were measured at four points both in the cotton field (whether in row or between rows) and in the area under cerrado vegetation.
In the cultivated areas NO-N, N2O-N and CO2-C fluxes were mea-sured before and after planting, after nitrogen fertilizations, along the growing season and shortly before and after harvest. In the soybean field, one measurement was also taken during the fallow period (dry season). In the native vegetation, measurements were taken monthly, except in November 2003 and July 2004 because of technical problems. Technical problems also prevented the mea-surements of N2O-N fluxes in October 2004 (irrigated bean and
native vegetation – Dom Bosco Farm) and November 2004 (cotton and native vegetation – Pamplona Farm).
Soil surface fluxes of NO-N, N2O-N and CO2-C were measured using polyvinyl chloride (PVC) cylindrical chambers with 24 cm diameter and 8.7 L. Chamber bases were installed into the upper 2 cm of the soil 30 min before of the measurement. Air was circu-lated in a closed loop between the chamber and the analyzers.
NO-N and CO2-C fluxes were measured using the dynamic
chamber technique. NO was analyzed using an NOx Box (Scintrex LMA-3), after first converting NO to NO2by passing the gas
sam-ple through CrO3. NO2reacts with Luminol®solution to produce a
luminescent reaction that is functionally related to the mixing ratio of NO2. NO concentration was recorded over a 5-min period. Fluxes
were calculated from the rate of increase of NO concentration using the linear portion of the accumulation curve. The instrument was calibrated twice daily, before and after sampling, using mixtures of a NO standard (0.4 ppm) with NO- and NO2-free air. CO2was
analyzed over a 3-min period using a photosynthesis system with
integrated infrared gas analyzer and data system (LiCor 6200). CO2
concentrations were logged every 2 s, yielding a continuous mon-itoring of increasing CO2concentrations that were used to fit the
most appropriate regression function.
N2O fluxes were measured with a static chamber technique
(Matson et al., 1990). The samples were collected from the headspace of the chamber using 60 mL polypropylene syringes with siliconized polypropylene plungers at 10-min intervals. In the laboratory, the samples were analyzed within 24 h after sample col-lection with a gas chromatograph (Shimadzu GC-14A) fitted with a63Ni electron capture detector. N
2O fluxes were calculated from
the rate of concentration increase, determined by linear regres-sion based on samples. The detection limit (0.6 ng N2O-N cm−2h−1)
defined byVerchot et al. (1999)was adapted in this study since a similar system and methods were used.
Soil temperatures (2.5 and 5.0 cm depth) were determined dur-ing the gas flux measurements.
2.4. Soil sampling
After gas flux measurements soil samples (0–5 cm depth) were collected from within the chambers to determine soil moisture, inorganic-N availability and microbial biomass C. Six soil sam-ples were collected in the soybean and maize-irrigated bean plots as well as in the native area (Dom Bosco Farm) while in the cotton field (Pamplona Farm) three soil samples in rows and three between rows and six samples in the native area were collected.
2.5. Water-filled pore space (%WFPS)
Soil samples were dried to constant weight at 105◦C for
gravi-metric soil moisture determination. Bulk density was determined (0–5 cm depth) using volumetric cylinders (Embrapa, 1999). For particle density, a value of 2.65 g cm−3 was used. Values of the
gravimetric soil moisture were converted to WFPS values (Linn and Doran, 1984): WFPS % = (g×sbd×100%)/[1−(sbd/spd)], where g= gravimetric soil moisture; sbd = soil bulk density; spd = soil
par-ticle density.
2.6. Inorganic-N availability and soil microbial biomass C
Field-moist soil samples (0–5 cm) were extracted with KCl (2 M) for 1 h and the inorganic-N concentrations were determined by col-orimetry. NO3-N was determined by UV-absorption according to
Meier (1991)and NH4-N was determined through reaction with
Nessler reagent. The results are expressed on a dry weight basis (DW).
Microbial biomass C (0–5 cm) was determined by the
chloro-form fumigation-incubation method proposed byJenkinson and
Powlson (1976). In the Dom Bosco Farm, composite soil sam-ples (compose of six subsamsam-ples) were collected from August 2003 to June 2004 for determination of microbial biomass, there-fore statistical analyses were not possible for this period. After this period, six soil samples were collected at every sampling date.
2.7. C and N stocks (0–30 cm depth)
Sampling for determination of organic C and total N concen-trations and bulk density was done in February 2005, in three trenches per area. In each trench one sample was collected from 0–5, 5–10, 10–20 and 20–30 cm depths. Samples for bulk density were collected with volumetric rings and dried at 105◦C. Soil C and
Ê.B. Fernandes Cruvinel et al. /Agriculture, Ecosystems and Environment 144 (2011) 29–40 Table 2
Dates of gas sampling and fertilization and amount and form of N applied during crop cycles at the Dom Bosco Farm and Pamplona Farm (from August 2003 to August 2005).
Farm Cultivation systems and native areas
Vegetation covers Planting and harvest or planting and spraying dates Gas sampling period/dates Fertilization dates Amount of N applied (kg ha−1)
N source Crop period
(N applied)
Dom Bosco (2999.4 ha)
Maize andBrachiaria ruziziensesintercropping system followed by irrigated bean in rotation (75 ha)
Maize (Zea maizcv. 30k75) Planting 05-Sep-03 Harvest 17-Feb-04
28-Aug-03 to 19-Feb-04 (5 sampling dates) 05-Sep-03 29-Sep-03 13-Oct-03 33.7 103.2 18.4
MAPb(in the crop
rows)
Urea (broadcasting) Urea (broadcasting)
Planting
16 DAEd
30 DAEd
Brachiaria ruzizienses Planting 05-Sep-03
Spraying of glyphosate 06-May-04
28-Apr-04 No fertilization
Irrigated bean (Phaseolus
vulgaris, type “Preto”) irrigation interval 30 h and 6 mm of water in each event
Planting 06-Jun-04 Harvest 19-Oct-04
11-Jun-04 to 19-Oct-04 (9 sampling dates)
08-Jun-04 21-Jul-04 04-Aug-04 19.3 81.0 2.4a
MAPb(in the crop
rows)
Urea (broadcasting) Urea (broadcasting)
Planting
33 DAEd
47 DAEd
Soybean followed by natural fallow (207 ha)
Soybean (Glycine maxcv.
P98C81 Pioneer) Planting 05-Dec-03 Harvest 24-Apr-04 28-Aug-03 to 28-Apr-04 (7 sampling dates)
05-Dec-03 21.2 MAPb(in the crop
rows)
Planting
Native area (620 ha) Cerrado vegetation
(cerradostricto sensu)
(Ribeiro & Walter, 1998)
28-Aug-03 to 19-Oct-04 (13 sampling dates)
Pamplona (14,085.2 ha)
Cotton planting overBrachiaria
ruziziensesstraw (721 ha)
Brachiaria ruzizienses Planting 06-Oct-04 Spraying of 2,4D 07-Nov-04
No sampling No fertilization
Herbaceous cotton (Gossypium hirsutumcv. ITA 90-Pioneer) Planting 27-Nov-04 Harvest 30-Jul-05 23-Nov-04 to 01-Aug-05 (10 sampling dates) 27-Nov-04 23-Dec-04 25-Jan-05 24.0 36.0 90.0
DAPc(in the crop rows)
Ammonium sulfate (broadcasting) Urea (broadcasting)
Planting
15 DAEd
45 DAEd
Native area (2677.5 ha) Cerrado vegetation
(cerradostricto sensu)
(Ribeiro & Walter, 1998)
29-Nov-04 to 01-Aug-05 (8 sampling dates)
aUnusual fertilization: N-applied because beans plants growth was affected by low temperature.
b MAP = Mono-ammonium phosphate.
c DAP = Di-ammonium phosphate.
Fig. 2.Water filled pore space (% WFPS) at 0–5 cm soil depth in croplands and in native cerrado in the same period. (A) Dom Bosco Farm (from August 2003 to October 2004), (B) Pamplona Farm (from November 2004 to August 2005).
errors in estimated C and N stocks may occur when sampling is based on fixed depths (Davidson and Ackerman, 1993; Veldkamp, 1994; Neill et al., 1997). In this study, soil bulk density differed significantly from the reference area (under native vegetation) only under maize-bean-rotation. In this case soil C and N stocks were corrected for comparison of equivalent soil mass (Neill et al., 1997).
2.8. Fertilizer-induced emission factors (FIE)
Fertilizer-induced emission factors (FIE) for maize, bean and cotton were estimated. Fertilizer-induced emission factor (FIE) is defined by theIPCC (2007)as the emission of N, as N-N-NO and N2O
from fertilized areas by subtracting the emission from a reference area without fertilizer (assuming that all other conditions are sim-ilar to those of fertilized soil). The FIE is expressed as a percentage of total N applied.
Fluxes were integrated for the crop cycle considering the mean fluxes measured and the number of days in each crop phase. For practices that used mechanization (planting and harvesting) a response period of five days was considered while for N fertiliza-tion or watering, a period to three days was considered based on the duration of the N pulses recorded byPinto et al. (2002, 2006) andCarvalho et al. (2006)in Oxisols of the region. Monthly means were considered during the growth season (without fertilization or watering). Fluxes from the native cerrado were calculated consid-ering monthly means and the occurrence of rain events in the dry season generating pulses with three days of duration. In order to consider the influence of random errors, an error estimate was cal-culated for every crop and for native areas. The estimated error for the cropping period was calculated using the propagated error for every day of measurements. The propagated error was calculated using the square root of the sum of square of the standard errors for every date. The estimated error was then calculated dividing the propagated error by the total flux during the cropping period and expressed as percentage.
2.9. Statistical analysis
All statistical analyses were conducted using SPSS ver. 13.0 with a 0.05 probability level. The normal distribution of data was tested using Kolmogorov–Smirnov test statistics (Sokal and Rohlf, 1981). Data were ln-transformed when they did not follow a normal distri-bution. One-way analysis of variance (ANOVA) followed by the post hoc Tukey test was used to compare means. N2O flux and NH4+-N
data were not normally distributed even after transformation. In this case, non-parametric Kruskal–Wallis and Mann–Whitney tests were used.
Cultivation phases and management practices (before and after planting, after N fertilization, growing season, before and after harvesting) for every crop were compared. In the case of cot-ton cultivation, data collected from row and between rows were also compared. Cultivated areas were also compared with refer-ence areas (native vegetation). Relationships between NO, N2O and
CO2fluxes and environmental variables were evaluated with linear
regression using the stepwise process.
3. Results
3.1. Soybean cultivation and maize-irrigated bean rotation (Dom Bosco Farm)
Soil moisture during bean cultivation was influenced by irriga-tion and ranged from 31% to 45% WFPS while values measured in soil under native vegetation ranged in the same period from 23.5% to 15.2%. In the other agricultural areas, soil moisture was affected by seasonal rainfall distribution. The highest values of WFPS in the 0–5 cm soil depth in each study area were about 43% in the maize field and the native cerrado and about 54% in the soybean field (Fig. 2).
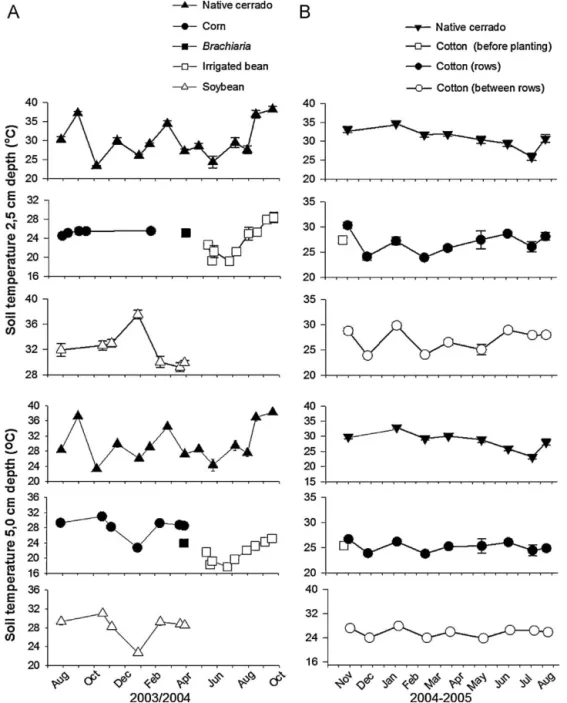
Fig. 3.Soil temperature (◦C) at 0–2.5 and 2.5–5.0 cm depth in croplands and in native cerrado in the same period. (A) Dom Bosco Farm (from August 2003 to October 2004),
(B) Pamplona Farm (from November 2004 to August 2005).
respectively (Fig. 3). Under maize-bean rotation soil temperatures were lower and varied from 17.7 to 25.0◦C.
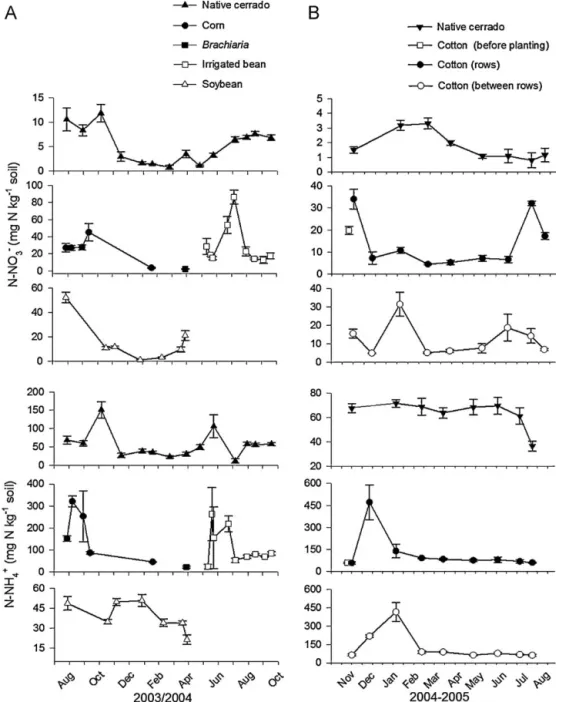
In the native cerrado, NO3−-N concentration varied from 0.8
(wet season) to 11.8 mg NO3−-N kg−1soil (dry season). Soil NH4+
-N concentration peaked in -November 2003 (151.1 mg -NH4+-N kg−1
soil) and in June 2004 (106.1 mg NH4+-N kg−1 soil) while during
the other months concentrations varied from 11.7 to 68.7 mg NH4+
-N kg−1soil (Fig. 4).
In the soybean field, during the fallow period and after the first rain events, the NO3−-N concentration was around 52 mg NO3−
-N kg−1soil but decreased (ca.1–3 mg NO3−-N kg−1soil) during the
period of intense plant growth. Shortly before and after the harvest, nitrate increased again (up to 21 mg NO3−-N kg−1soil). Availability
of NH4+-N ranged from 21.3 to 50.7 mg NH4+-N kg−1soil.
In the area under maize-bean rotation, the NH4+-N
concen-tration was 152.1 mg NH4+-N kg−1soil before maize planting and
increased to 320.7 mg NH4+-N kg−1 soil after planting with
N-fertilization. However, NH4+-N concentration decreased in the
subsequent phases until the postharvest phase. During maize cul-tivation, NO3−-N availability before planting and after planting and
the first broadcast N-fertilization was about 27 mg NO3−-N kg−1
soil but decreased significantly during the post-harvest phase (3.6 mg NO3−-N kg−1soil).
Afterwards, during the cultivation ofBrachiaria(April 2004), while NO3−-N concentration remained close to 2 mg NO3−-N kg−1
soil, the concentration of NH4+-N was about 23 mg NH4+-N kg−1
soil increasing to 263.1 mg NH4+-N kg−1 soil one day after bean
planting. In the irrigated bean field, the soil NH4+-N
concentra-tion remained high shortly after the first broadcast N-fertilizaconcentra-tion (July 2004, 218.6 mg N kg−1 soil) but was lower after the second
broadcast N-fertilization (August 2004, 53.1 mg NH4+-N kg−1soil)
until the postharvest phase (October 2004, 84.5 mg NH4+-N kg−1
soil). Availability of NO3−-N increased significantly (28.6 mg NO3−
-N kg−1soil,P= 0.000,F= 30.95) before the planting of bean. During
bean cultivation, the highest NO3−-N concentrations were
Fig. 4.Soil NO3−-N (mg NO3−-N kg−1soil) and NH4+-N (mg NH4+-N kg−1soil) at 0–5 cm in croplands and in native cerrado in the same period. (A) Dom Bosco Farm (from August 2003 to October 2004), (B) Pamplona Farm (from November 2004 to August 2005).
(83.5 mg NO3−-N kg−1 soil) N-fertilization. In the other
cultiva-tion phases, NO3−-N concentrations were lower (from 12.9 to
22.8 mg NO3−-N kg−1soil).
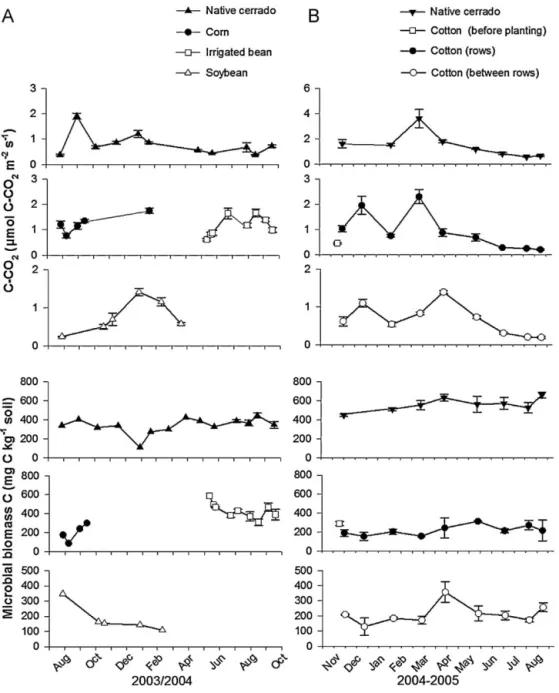
Soil microbial biomass tended to be similar in the soy-bean field, during maize cultivation and in native cerrado soil (86.8–444.3 mg C kg−1 soil) but was higher during cultivation of
irrigated bean (309.8–590.3 mg C kg−1soil) (Fig. 5).
3.2. Soil NO-N and N2O-N fluxes
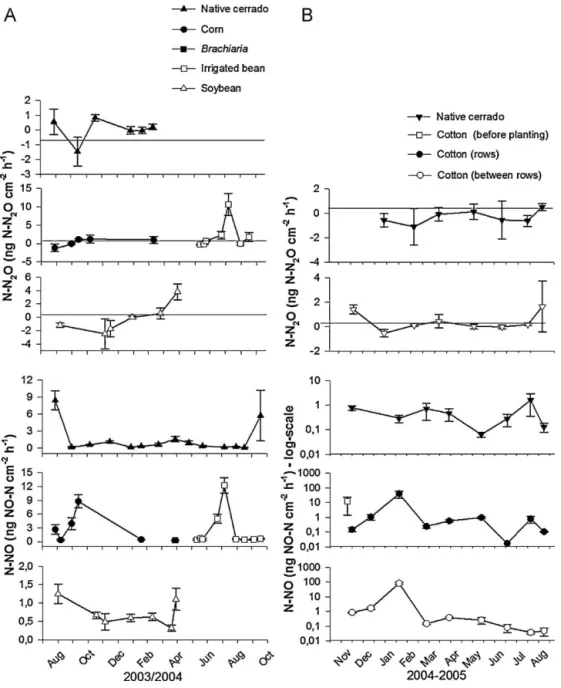
In the native cerrado, a pulse of NO-N (8.4 ng NO-N cm−2h−1)
was measured after the first rain events (28 mm) during the dry season. In the transition from dry to wet season higher and very variable NO-N fluxes (5.7±10.9 ng NO-N cm−2h−1) were also mea-sured after rain events (45 mm) (Fig. 6). Afterwards, NO-N fluxes ranged between 0.07 and 1.50 ng NO-N cm−2h−1. Soil moisture (%
WFPS) accounted for 70% the NO-N fluxes measured in the native cerrado soil during the wet season (P= 0.000,F= 27.92).
In general, NO-N fluxes during the soybean cropping cycle were similar to those measured in the native cerrado but were not explained by the environmental variables tested. NO-N fluxes were slightly higher during the fallow period and shortly after the harvest (1.3 and 1.1 ng NO-N cm−2h−1, respectively). Lowest NO-N fluxes
in the soybean field were measured prior to the harvest (0.3 ng NO-N cm−2h−1).
NO-N fluxes during maize cultivation were also not explained by the environmental variables tested. Higher NO-N fluxes were measured before planting (2.7 ng NO-N cm−2−1) than after
plant-ing (0.4 ng NO-N cm−2h−1) with row fertilization. Pulses of NO-N
emissions were observed two days after the first and second (3.9 and 8.8 ng NO-N cm−2h−1, respectively). DuringBrachiaria
cultiva-tion, NO-N fluxes (0.3 ng NO-N cm−2h−1) were lower than those
in the native cerrado (1.5 ng NO-N cm−2h−1) but increased during
Fig. 5.Soil CO2-C fluxes (mol CO2-C m−2s−1) and microbial biomass (mg C kg−1soil) in croplands and in native cerrado in same period. (A) Dom Bosco Farm (from August 2003 to October 2004), (B) Pamplona Farm (from November 2004 to August 2005).
During the other cultivation phases, NO-N fluxes varied between 0.3 and 0.7 ng NO-N cm−2h−1. Availability of NO3+-N accounted for
82% (P= 0.000,F= 104.47) of the NO-N fluxes during the cultivation of bean with irrigation.
Most of the soil N2O-N fluxes measured under cultivated
and the native cerrado were very low and under the detection limit (0.6 ng N2O-N cm−2h−1). Nevertheless, under bean
cultiva-tion with irrigacultiva-tion, N2O-N fluxes increased significantly shortly
after irrigation with broadcast fertilizations with urea (2.3 ng N2
O-N cm−2h−1and 10.6 ng N2O-N cm−2h−1). Modest and variable
increments in N2O-N fluxes occurred during the senescence of the
bean (1.7 ng N2O-N cm−2h−1) as well during nodule senescence in
the soybean field (3.8 ng N2O-N cm−2h−1). Availability of NO3−-N
accounted for 85% (P= 0.000,F= 62.00) of N2O fluxes during cultiva-tion of bean with irrigacultiva-tion while fluxes from the soybean field, the native cerrado and during maize cultivation could not be explained by the environmental variables tested.
Integrated fluxes per crop cycle are presented in Table 3. Emission of NO-N per hectare under maize and bean cultivation were similar (0.3 kg NO-N ha−1) while for soybean it was 0.2 kg
NO-N ha−1. Negative N2O-N fluxes were recorded, indicating
possi-ble uptake, in 50% and 60% of observations during the fallow period in the dry season, before and shortly after planting of the maize and soybean plants, respectively. Negative N2O-N fluxes were
not observed during the irrigated bean cycle and emissions were around 0.2 kg N2O-N ha−1. Nitrogen losses as NO-N represented
0.1% of the N fertilizer added during maize cultivation (155.3 kg N), while losses as N2O-N represented 0.3%. For irrigated bean,
nitro-gen losses as NO-N represented 0.2% of the N fertilizer added during cultivation (102.7 kg N), while losses as N2O-N represented 0.2%.
3.3. Soil CO2-C fluxes
Soil CO2-C fluxes in the native cerrado ranged from 0.4 (dry
sea-son) to 1.2mol CO2-C m−2s−1 (wet season) and were similar to
those in the soybean field (0.2mol to 1.2mol CO2-C m−2s−1).
Soil moisture (% WFPS) accounted for 63% (P= 0.000,F= 20.45) of soil CO2-C fluxes in the soybean field.
In general, CO2-C emissions during cultivation of maize and
Fig. 6.Soil N2O-N (ng N2O-N cm−2h−1) and NO-N (ng NO-N cm−2h−1) fluxes in croplands and in native cerrado in the same period. (A) Dom Bosco Farm (from August 2003 to October 2004), (B) Pamplona Farm (from November 2004 to August 2005). Data points in Pamplona Farm represents log N-NO.
Soil respiration during maize cultivation varied from 0.8 to 1.8mol CO2-C m−2s−1. Soil respiration measured in the dry
sea-son in the maize field was three times higher than in native cerrado soil. NH4+-N availability accounted for 55% (P= 0.001,F= 12.40) of
CO2-C fluxes during maize cultivation. During cultivation of bean
with irrigation, a significant increase (P= 0.000) in CO2-C fluxes
(from 0.9 to 1.6mol CO2-C m−2s−1) was observed two days after
broadcast fertilization. Soil respiration remained higher until har-vest and decreased after harhar-vest to values similar to those measured shortly before and after planting. Soil respiration under cultivation of bean with irrigation was also not explained by the environmental variables tested.
Table 3
Estimative of soil NO-N and N2O-N emissions per hectare from croplands (maize, irrigated bean, soybean and cotton) and native savanna.
Study area Period (days) NO-N emitted (kg ha−1) Error estimate (%) N2O-N emitted (kg ha−1) Error estimate (%)
Dom Bosco Farm
Native cerrado 173 0.1 11.2 0.01 1528.0
Maize 173 0.3 21.1 0.2 35.7
Native cerrado 135 0.1 37.1 0.03 167.4
Irrigated bean 135 0.3 9.3 0.2 129.7
Native cerrado 153 0.2 17.6 −0.03 0.0
Soybean 153 0.2 13.4 0.1 28.1
Pamplona Farm
Native cerrado 258 0.3 2.4 −0.2 13.1
23.2 to 32.9 C and from 23.8 to 27.9 C in the native cerrado and in the cotton field, respectively. During the wet season, soil tempera-tures in the native cerrado soil were significantly higher (P= 0.042,
F= 4.38) than in the cultivated area, while during the dry season (May to August 2005), soil temperatures were similar in the two areas.
In the native cerrado, soil NO3−-N concentrations ranged from 0.8 to 3.3 mg N kg−1during the period of the study. The availability of NO3−-N increased by up to 1.5 times after planting in comparison to the pre-planting phase with the application N fertilizer but only in rows. A second peak of NO3−-N concentration was measured 15 days in rows before the harvest. The highest NO3−-N concen-tration (31.4 mg N kg−1soil) between rows was measured shortly after second broadcast N-fertilization. Throughout the other sam-pling dates, availability of NO3−-N in rows and between rows varied from 4.4 to 18.6 mg N kg−1soil. The highest concentrations of NH4+ -N were measured after the first broadcast -N fertilization. A large pulse of NH4+-N was measured after the second broadcast fertil-ization. In the other sampling dates, availability of NH4+-N varied from 60.8 to 91.5 mg N kg−1soil and was similar to that observed in the native cerrado soil. The concentration of NH4+-N under the native cerrado soil significantly (P= 0.037) decreased at the end of dry season (36.6 mg N kg−1soil).
Throughout all sampling dates, microbial biomass was higher under the native cerrado than under cultivation of cotton (rows and between rows). Soil microbial biomass values measured varied from 129.3 to 356.9 mg C kg−1soil, while under native vegetation values varied from 448.5 to 662.4 mg C kg−1soil.
3.4.1. Soil NO-N and N2O-N fluxes
Soil NO-N fluxes under native vegetation varied from 0.06 to 1.6 NO-N ng cm−2h−1. Higher but very variable NO-N fluxes (12.6±27.4 NO-N ng cm−2h−1) were measured under Brachiaria straw (before cotton planting). After the planting of cot-ton with N-fertilization in rows, the NO-N fluxes in rows (0.2±0.08 NO-N ng cm−2h−1) were lower than fluxes between rows (0.9±0.08 NO-N ng cm−2h−1) (P= 0.035). Slightly higher NO-N fluxes were measured in rows (1.1 NO-NO-NO-N ng cm−2h−1) and between rows (1.7 NO-N ng cm−2h−1) after the first broadcast fer-tilization. A large pulse of NO-N was measured after the second broadcasting of N-fertilizer in rows (39.3±20.1 NO-N ng cm−2h−1) and between rows (83.3±11.9 NO-N ng cm−2h−1). The fluxes mea-sured in January 2005 were almost 1000 times higher than NO-N soil fluxes under the native cerrado. NO-N fluxes mea-sured 15 days before the harvest were higher (P= 0.033,F= 10.19) in rows (0.78 NO-N ng cm−2h−1) than between rows (0.04 NO-N ng cm−2h−1). Availability of NH4+-N (0–5 cm depth) accounted for 85% (P= 0.000,F= 65.45) of NO-N fluxes between rows while NO-N fluxes in rows were not explained by the variables tested. In the native cerrado, 40% of the NO-N fluxes were explained by microbial biomass (P= 0.008,F= 7.89).
In general, the N2O-N fluxes from the cotton field were similar to those from the native cerrado (−0.6 to 0.5 ng N2O-N cm−2h−1). The N2O-N values ranged from 0.5 to 1.6 ng N2O-N cm−2h−1 (shortly after harvest) and could not be explained by the variables tested.
Compared with the other cropping systems, cotton cultivation resulted in the highest emission of N per hectare (0.8 kg NO-N ha−1). Most N2O-N fluxes (62%) were close to the detection limit and the emission per crop cycle was around 0.1 kg N2O-N ha−1, the same value calculated for maize cultivation. Nitrogen losses
(March 2005) and were higher than in the cultivated area (0.7–7.1mol CO2-C m−2s−1) throughout all sampling dates. Two days after cotton planting with the addition of N fertilizer a slight but significant increase (P= 0.012,F= 11.34) in CO2-C fluxes was measured but only in rows (1.0mol CO2-C m−2s−1).
Soil moisture (% WFPS, 0–5 cm depth) accounted for 88% (P= 0.000, F= 82.27) of CO2-C fluxes measured in rows, 78% (P= 0.000,F= 39.44) between rows and 59% (P= 0.000,F= 24.59) in the native cerrado.
3.5. Soil C and N stocks
In comparison with the remnant of the native cerrado (62.3 Mg C ha−1), significantly lower soil C stocks (0–30 cm depth) were determined under the maize-Brachiaria-bean rota-tion (56.4 Mg C ha−1) adopted for 10 years after land conversion (P= 0.088) and in soybean followed by the natural fallow sys-tem (51.7 Mg C ha−1) adopted for 31 years after land conversion (P= 0.007) Soil N stock (0–30 cm depth) was lower under soy-bean cultivation (2.7 Mg N ha−1) than under the native cerrado and maize-bean rotation (3.3 Mg N ha−1).
In the Pamplona Farm, C and N stocks after 27 years of cotton-soybean rotation were similar to those under native vegetation (53.2 Mg C ha−1and 3.1 Mg N ha−1).
4. Discussion
The low soil N2O-N fluxes recorded under cultivation and native vegetation are in accordance with results from other studies in the Cerrado region under maize cultivation (Carvalho et al., 2006), pasture (Varella et al., 2004; Pinto et al., 2006) and cerrado vege-tation (Pinto et al., 2002). Low soil N2O fluxes are related to low NO3-availability and aerobic conditions with WFPS lower than 60%
(Davidson et al., 2000). In general, Oxisols in the Cerrado region are well-drained, relatively N-limited and exhibit low nitrifica-tion rates (Nardoto and Bustamante, 2003). Moreover, surface soils under no-till systems preserve a structure similar to those under native vegetation favoring good soil aeration.
Although low fluxes of N oxides were observed in most of the study areas, agricultural practices could induce pulses of NO-N and NO-N2O-N. Availability of NO3-N explained the N2O-N fluxes
under irrigated bean cultivation. The largest NO-N and N2O-N peaks
were measured after N-fertilizations associated with irrigation that resulted in an increase of N availability and favorable WFPS condi-tions (i.e. less aerobic soil environment). Also, slightly higher NO3-N availability and N2O-N fluxes were recorded during the senescence
of bean and soybean and the post-harvest phase of cotton, espe-cially in rows, which could be related to root mortality (Varner et al., 2003; Silver et al., 2005) and N release from roots and nodules. Jantalia et al. (2006)also observed higher N2O-N fluxes in the last
phase of soybean cycle in long term studies in the Southern region of Brazil.
Negative fluxes of N2O were observed in the post-harvest phase.
Although soils are usually considered a net source of atmospheric N2O-N, they can also act as sinks, at least temporarily, depending
on management practices and environmental conditions (Minami, 1997). In general, N2O-N production and consumption processes
occur in soil microsites and are, thereafter, very variable. Chapuis-Lardy et al. (2007), in a review of the role of soils as sinks for N2O-N,
gas sources or sinks are not uniformly distributed in the soil or located too close to the surface for gradients to be measured, or when non-diffusive transport is involved.
Large additions of organic matter as observed after the cultiva-tion withBrachiariaand before cotton planting resulted in higher variability of NO-N fluxes with some peak values. This variability might be associated with the transition between the dry and wet season and the decomposition ofBrachiariastraw after the appli-cation of herbicide (Passianoto et al., 2003). NO-N fluxes in rows under cotton cultivation were explained by NH4+-N availability.
The slight increase in NO-N fluxes observed after first broadcast N-fertilization was possibly underestimated because time (4 h after application) may not have been sufficient for total reaction and production of higher pulses of NO-N. The second broadcast N-fertilization increased NO3−-N and NH4+-N availability three days
after N-application with consequent increases in NO-N fluxes in rows and between rows. Availability of inorganic-N and NO-N fluxes tended to be higher between rows. This could be a conse-quence of competition between roots and microbes for N in rows during this phase of the cropping cycle. Differences in the fluxes between the first and second broadcast fertilizations could be also related to the amount and the form of N added (ammonium sul-fate or urea). Shortly before and after the cotton harvest, NO-N fluxes and NO3−-N availability were higher in rows, probably due
to root mortality and decomposition, especially fine roots (<2 mm diameter) as discussed before for N2O-N fluxes.
Under native vegetation, NO-N fluxes were explained by soil moisture (Dom Bosco Farm) and microbial biomass (Pamplona Farm). Although both cerrado areas burned during the period of the study, there was no detectable effect of fire on soil NO-N fluxes. Pinto et al. (2002)also only observed soil NO-N pulses in burned native areas after the occurrence of rain events.
Seasonal distribution of rainfall affecting soil moisture was the main factor explaining soil CO2-C fluxes under native vegetation,
cotton (in rows and between rows) and soybean cultivation. None of the variables tested explained soil respiration under the cultiva-tion of bean with irrigacultiva-tion. Although only under maize cultivacultiva-tion CO2-C fluxes have been explained by NH4+-N concentration, effects
of N-availability on soil CO2-C fluxes were observed also under
cotton and bean cultivation.
Microbial activity is controlled by availability of N and C, soil moisture and temperature. Although WFPS was higher in the cot-ton field during the wet season than in the native cerrado soil, soil respiration was lower under cotton cultivation than under the native cerrado. This could be explained by lower values of soil microbial biomass under cotton cultivation (about 2.5 times lower than in the native cerrado). Cotton cultivation demands a very intense management with several applications of biocides throughout the crop cycle and the study area is under this sys-tem (rotation of soybean-natural fallow-Brachiaria-cotton) since 1980. Higher soil respiration under native vegetation could be also associated with the burning that occurred before the first measure-ments. An increase in autotrophic respiration could be related to the resprouting of cerrado vegetation (grasses and woody layer).
Cotton cultivation in the Cerrado region has a longer cycle, extending from the wet to the dry season differently from soy-bean and maize cultivation. At the beginning of the wet season, soil under cotton cultivation was still covered withBrachiariastraw and this cover probably also led to lower soil temperatures and higher WFPS compared with the native cerrado. At the end of the wet sea-son growth inhibitor and defoliant were applied over cotton plants leading to lower soil cover and probably increasing evaporation.
Brachiariastraw was largely decomposed by the beginning of the dry season. As a result of these practices, soil under cotton cul-tivation during the dry season exhibited temperatures and WFPS similar to those under the native cerrado soil. Nevertheless, soil
CO2-C fluxes were still higher under native vegetation than under
cotton during the dry season.
Soil respiration was higher in the system rotation
maize-Brachiaria-irrigated bean (Dom Bosco farm) than under native vegetation. This could be related to the soil cover during the entire period of the study and to the diversity of covers (cereal (maize), grass (Brachiaria) and legume (bean)) and nutrient additions in association with irrigation. On the other hand, soybean cultiva-tion followed by natural fallow during the dry season produced soil CO2-C fluxes that were similar to those of the native cerrado.
Soil stocks of C and N are a function of C and N inputs and decomposition, management practices, soil and climate fac-tors. A high N input through Biological Nitrogen Fixation (ca. 185 kg N ha−1year−1) is estimated for soybean (Alves et al., 2006),
but grain production and pod filling are strong sinks for N. In addi-tion, soybeans are still widely cultivated in the Cerrado region as a monoculture without a second crop. The high harvest index (ca.
86%) for aboveground biomass (Alves et al., 2006) and the little remaining necromass under natural fallow might contribute to soil C and N losses over time. On the other hand, maize-Brachiaria-bean rotation in the Dom Bosco Farm, which is a system that maintains soil cover through the year, also resulted in a lower soil C stock but maintained soil N probably due to irrigation during the dry season and the input of N fertilizer. On the other hand, soil under the crop rotation system without irrigation (soybean-Brachiaria-cotton) in the Pamplona Farm featured similar stocks of C and N to those under the native cerrado even after 27 years of cultivation. Model simu-lations showed that the potential soil C storage in Cerrado Oxisols was highest under cropping systems with two crops per year (for example, soybean-maize cropping under no-till) and also indicated that gains in soil C were related to gains in soil N under cropping systems with two crops per year (Bustamante et al., 2006). The long-term accumulation of soil C can be expected only when the net N balance of the cropping systems is positive (Sisti et al., 2004). The fertilizer induced emission factor (FIE) established by the IPCC (2007)is 0.7% and 1% of the N applied via fertilizer for N-NO and N2O-N, respectively. Our results indicated that FIE for N oxides
under the environmental conditions and cultivation systems in the Cerrado are lower, which could affect the estimates of emissions made by inventories of anthropogenic greenhouse gas emissions in Brazil and in other tropical regions with similar soils.
The wide variation in estimated errors in the integration of the fluxes of NO and N2O during the cropping period was probably due
to the spatial variability, both horizontally and vertically, of culti-vated and native soils. The spatial variability is caused by alterations in the processes and factors that drive the dynamics of C and N in the soil such as soil characteristics, agricultural practices (fertiliza-tion, irrigation and mechanization), rhizodeposition and variations in temperature and humidity. Such processes and factors influ-ence the production, consumption and emission of nitrogen oxides, especially N2O that is produced in anaerobic microsites (Skiba et al., 1993; Davidson et al., 1993; Hall et al., 1996; Russow et al., 2000).
5. Conclusions
Losses of N in the form of NOx are higher than in the form of N2O-N from Oxisols of the Cerrado region under different crop sys-tems. Agricultural practices (N-fertilization and irrigation) induced higher NO-N emissions in comparison to soils under native vegeta-tion. Soil processes related to N2O-N production and consumption
in these soils, especially under changes in plant N allocation as during plant senescence and fine root mortality, need to be better understood.
Fertilizer-induced emission values (N2O-N and NO-N),
the Cerrado, more studies are necessary to indicate practices that minimize soil C losses and simultaneously avoid increasing N oxide emissions.
Acknowledgements
The authors are very grateful to Mr. Sebastião Conrado, owner of the Dom Bosco Farm, to the SLC Group, owner of Pamplona Farm and to the team of the Ecology Laboratory of the University of Brasilia for assistance during field and laboratory measurements. This research study was funded by NASA under the Large Scale Biosphere-Atmosphere in Amazonia (LBA) project ND-07 and by the Environmental Protection Agency-USA (EPA) through Assis-tance Agreement 827291-01. Êrika B. Fernandes Cruvinel received a fellowship from PIQDT-CAPES (Brazil).
References
Akiyama, H., Tsuruta, H., Watanabe, T., 2000. N2O and NO emissions from soils after
the application of different chemical fertilizers. Chemosphere Glob. Change Sci. 2, 313–320.
Alves, B.J.R., Boddey, R.M., Urquiaga, S., 2003. The success of BNF in soybean in Brazil. Plant Soil 252, 1–9.
Alves, B.J.R., Zotarelli, L., Fernandes, F.M., Heckler, J.C., de Macedo, R.A.T., Boddey, R.M., Jantalia, C.P., Urquiaga, S., 2006. Biological nitrogen fixation and nitrogen fertilizers on nitrogen balance of soybean, corn and cotton. PAB 41 (3), 449–456 (in Portuguese).
Bustamante, M.M.C., Corbeels, M., Scopel, E., Roscoe, R., 2006. Soil carbon storage in the Cerrado Region of Brazil. In: Rattan, L., Cerri, C.C., Bernoux, M., Etchevers, J., Cerri, E. (Eds.), Org. Carbon Sequestration in Soil of Latin America. The Haworth Press, pp. 285–304.
Bustamante, M.M.C., Ferreira, L.G., 2011. Land use change and the carbon budget in the Brazilian Cerrado. In: Hill, M., Hanan, N. (Eds.), Ecosystem Function in Savan-nas: measurement and modeling at landscape to global scales. CRC Press/Taylor and Francis Group, pp. 367–381.
Carvalho, A.M., Bustamante, M.M.C., Kozovits, A.R., Miranda, L.N., Vivaldi, L.J., Sousa, D.M., 2006. Emission of nitrogen oxides associated with urea application under conventional tillage and no-tillage. PAB 41 (4), 679–685 (in Portuguese). Chapuis-Lardy, L., Wrage, N., Metay, A., Chotte, J.-L., Bernoux, M., 2007. Soils, a sink
for N2O? A review. Glob. Change Biol. 13, 1–17.
Davidson, E.A., Ackerman, L., 1993. Change in soil carbon inventories following cul-tivation of previously untilled soil. Biogeochemistry 20, 161–193.
Davidson, E.A., Keller, M., Erickson, H.E., Verchot, L.V., Valdcamp, E., 2000. Testing a conceptual model of soil emissions of nitrous and nitric oxides. Bioscience 50 (8), 667–680.
Davidson, E.A., Matson, P.M., Vitousek, R., Riley, R., Dunkin, K., Garcia-Mendez, G.,
Maass, J.M., 1993. Processes regulating soil emissions of NO and N2O in a
sea-sonally dry tropical forest. Ecology 74, 130–139.
Embrapa, 1999. Centro Nacional de Pesquisa de Solo. Brazilian System of Soil Clas-sification, Rio de Janeiro, 412 pp. (in Portuguese).
Giacomini, S.J., Jantalia, C.P., Aita, C., Urquiaga, S.S., Alves, B.J.R., 2006. Nitrous oxide emissions with application of pig slurry in soil under no-tillage. PAB 41 (11), 1653–1661 (in Portuguese).
Hall, S.J., Matson, P.A., Roth, P.M., 1996. NOx emissions from soil: implications for air quality modeling in agricultural regions. Annu. Rev. Energy Environ. (21), 311–346.
IPCC (Intergovernmental Panel on Climate Change), 2007. IPCC AR4 – Fourth Assess-ment Report, Climate Change 2007: The Scientific Basis. IPCC, Valencia.
Jenkinson, D.S., Powlson, D.S., 1976. The effects of Biocidal treatments on metabolism in soil. V. A method for measuring soil biomass. Soil Biol. Biochem. 8 (3), 209–213. Linn, D.M., Doran, J.W., 1984. Effects of water-filled pore space on carbon dioxide and nitrous oxide production in tilled and nontilled soils. Soil Sci. Soc. Am. J. 48, 1267–1272.
MAPA-Brazilian Ministry of Agriculture/Statistics Data (in Portuguese).
http://www.agricultura.gov.br(accessed 26.08.08).
Matson, P.A., Vitousek, P.M., Livingston, G.P., Swanberg, N.A., 1990. Sources of variation in nitrous oxide from Amazonian Ecosystems. J. Geophys. Res. 95, 16789–16798.
Meier, M., 1991. Nitratbestimmung in Boden-proden (N-min-Methode). Labor Praxis, 244–247.
Metay, A., Oliver, R., Scopel, E., Douzet, J.-M., Moreira, J.A.A., Maraux, F., Feigl, B.J.,
Feller, C., 2007. N2O and CH4emissions soil under conventional and no-till
management practices in Goiânia (Cerrados, Brazil). Geoderma 141, 78–88. Minami, K., 1997. Atmospheric methane and nitrous oxide: source, sinks and
strate-gies for reducing agricultural emissions. Nutr. Cycl. Agroecosyst. 49, 203–211. Nardoto, G.B., Bustamante, M.M.C., 2003. Effects of fire on soil nitrogen dynamics
and microbial biomass in savannas of Central Brazil. PAB Brasília 38, 955–962. Neill, C., Melillo, J.M., Steudler, P.A., Cerri, C.A., de Moraes, J.F.L., Piccolo, M.C., Brito,
M., 1997. Soil carbon and nitrogen stocks following forest clearing for pasture in the southwestern Brazilian Amazon. Ecol. Appl. 7 (4), 1216–1225. Passianoto, C.C., Ahrens, T., Feigl, B.J., Steudler, P.A., do Carmo, J., Melillo, J.M., 2003.
Emissions of CO2, N2O and NO in conventional and no-till management practices
in Rodônia, Brazil. Biol. Fertil. Soils 38, 200–208.
Pinto, A.S., Bustamante, M.M.C., Kisselle, K., Burke, R., Zepp, R., Viana, L.T., Varella,
R.F., Molina, M., 2002. Soil emissions of N2O, NO and CO2in Brazilian savannas:
effects of vegetation type, seasonality, and prescribe fire. J. Geophys. Res. 107 (D20), 57-1/9.
Pinto, A.S., Bustamante, M.M.C., da Silva, M.R.S.S., 2006. Effects of different treat-ments of pasture restoration on soil trace gas emission in the cerrados of Central Brazil. Earth Interact. 10 (1), 1–26.
Russow, R., Sich, I., Neue, H.-U., 2000. The formation of the trace gases NO and N2O
in soils by the coupled processes of nitrification and denitrification: results of kinetic 15N tracer investigations. Chemosphere Glob. Change Sci. 2, 359–366. Sano, E.E., Rosa, R., Brito, J.L., Ferreira, L.G., 2008. Semidetailed land use mapping in
the Cerrado. Pesquisa agropecuária brasileira. Notas Científicas 43 (1), 153–156 (in Portuguese).
Silver, W.L., Thompson, A.W., McGroddy, M.E., Varnerw, R.K., Dias, J.D., Silva, H., Crill, P.M., Keller, M., 2005. Fine root dynamics and trace gas fluxes in two lowland tropical forest soils. Glob. Change Biol. 11, 290–306.
Sisti, C.P.J., Santos, R., Kohhann, B.J.R., Alves, B.J.R., Urquiaga, S., Boddey, R.M., 2004. Changes in carbon and nitrogen stocks in soil under 13 year of conventional or zero tillage in southern Brazil. Soil Till. Res. 18, 541–547.
Sitaula, B.K., Hansen, S., Sitaula, J.I.B., Bakken, L.R., 2000. Effects of soil compaction
on N2O emission in agricultural soil. Chemosphere Glob. Change Sci. 2, 367–371.
Skiba, U., Smith, K.A., Fowler, D., 1993. Nitrification and denitrification as sources of nitric oxide and nitrous oxide in sandy loam soil. Soil Biol. Biochem. 25, 1527–1536.
Sokal, R.R., Rohlf, F.J., 1981. Biometry. W.H. Freeman and Company, San Francisco. Varella, R.F., Bustamante, M.M.C., Pinto, A.S., Kisselle, K.W., Santos, R.V., Burke, R.A.,
Zepp, R.G., Viana, L.T., 2004. Soil fluxes of CO2, CO, NO, and N2O from an old
pasture and from native savanna in Brazil. Ecol. Soc. Am. 14 (4), s221–s231. Vargas, M.A.T., Suhet, A.R., Mendes, I.deC., Peres, J.R.R., 1994. Biological Nitrogen
Fixation in Cerrado Soils. EMBRAPA-CPAC/Planaltina-DF, p. 83. (in Portuguese). Varner, R.K., Keller, M., Robertson, J.R., 2003. Experimentally induced root mortality increased nitrous oxide emission from tropical forest soils. Geophys. Res. Lett. 30, 1141–1145.
Veldkamp, E., 1994. Organic carbon turnover in the three tropical soil under pasture after deforestation. Soil Sci. Soc. Am. J. 58, 175–180.