❊♥s❛✐♦s ❊❝♦♥ô♠✐❝♦s
❊s❝♦❧❛ ❞❡
Pós✲●r❛❞✉❛çã♦
❡♠ ❊❝♦♥♦♠✐❛
❞❛ ❋✉♥❞❛çã♦
●❡t✉❧✐♦ ❱❛r❣❛s
◆◦ ✹✻✶ ■❙❙◆ ✵✶✵✹✲✽✾✶✵
❉❡❝❡♥t ❲♦r❦ ❛♥❞ t❤❡ ■♥❢♦r♠❛❧ ❙❡❝t♦r ✐♥
❇r❛③✐❧
▼❛r❝❡❧♦ ❈♦rt❡s ◆❡r✐
❖s ❛rt✐❣♦s ♣✉❜❧✐❝❛❞♦s sã♦ ❞❡ ✐♥t❡✐r❛ r❡s♣♦♥s❛❜✐❧✐❞❛❞❡ ❞❡ s❡✉s ❛✉t♦r❡s✳ ❆s
♦♣✐♥✐õ❡s ♥❡❧❡s ❡♠✐t✐❞❛s ♥ã♦ ❡①♣r✐♠❡♠✱ ♥❡❝❡ss❛r✐❛♠❡♥t❡✱ ♦ ♣♦♥t♦ ❞❡ ✈✐st❛ ❞❛
❋✉♥❞❛çã♦ ●❡t✉❧✐♦ ❱❛r❣❛s✳
❊❙❈❖▲❆ ❉❊ PÓ❙✲●❘❆❉❯❆➬➹❖ ❊▼ ❊❈❖◆❖▼■❆ ❉✐r❡t♦r ●❡r❛❧✿ ❘❡♥❛t♦ ❋r❛❣❡❧❧✐ ❈❛r❞♦s♦
❉✐r❡t♦r ❞❡ ❊♥s✐♥♦✿ ▲✉✐s ❍❡♥r✐q✉❡ ❇❡rt♦❧✐♥♦ ❇r❛✐❞♦ ❉✐r❡t♦r ❞❡ P❡sq✉✐s❛✿ ❏♦ã♦ ❱✐❝t♦r ■ss❧❡r
❉✐r❡t♦r ❞❡ P✉❜❧✐❝❛çõ❡s ❈✐❡♥tí✜❝❛s✿ ❘✐❝❛r❞♦ ❞❡ ❖❧✐✈❡✐r❛ ❈❛✈❛❧❝❛♥t✐
❈♦rt❡s ◆❡r✐✱ ▼❛r❝❡❧♦
❉❡❝❡♥t ❲♦r❦ ❛♥❞ t❤❡ ■♥❢♦r♠❛❧ ❙❡❝t♦r ✐♥ ❇r❛③✐❧✴ ▼❛r❝❡❧♦ ❈♦rt❡s ◆❡r✐ ✕ ❘✐♦ ❞❡ ❏❛♥❡✐r♦ ✿ ❋●❱✱❊P●❊✱ ✷✵✶✵
✭❊♥s❛✐♦s ❊❝♦♥ô♠✐❝♦s❀ ✹✻✶✮
■♥❝❧✉✐ ❜✐❜❧✐♦❣r❛❢✐❛✳
Decent Work and the Informal Sector in
Brazil
Marcelo Côrtes Neri
1
1
Abstract
Brazil has a substantial share – about 60% by some measures - of its employees working
without labor registry and 62% of its private sector workers not contributing to social
security. Informality is important because its job precaurioness, social desprotection
consequences, and it is also very correlated with poverty and other social welfare concepts
measured at a family level. 58% of the country population that is found below the indigent
line live in families headed by informal workers.
The complexity of the informal sector is derived from the multiple relevant dimensions of
jobs quality. The basis used for guiding policy interventions depends on which effect of
informality one is interested such: as lowering job precaurioness, increasing occupational
risks, increasing the degree of protection against adverse shocks, allowing that good
oportunities to be taken by the credit provision, improving informal workers families living
conditions, implementing afirmative actions, reducing tax evasion etc.
This report gauges various aspects of the informal sector activities in Brazil over the last
decades. Our artistic constraint are the available sources of information. The final purpose is
to help the design of policies aimed to assist those that hold “indecent” jobs.
Social security perspective - The rate of social security evasion in the private sector
amounted to 62% in 1999 against 52.8% found in 1985. The rate of informality is higher for
females 66% than for males 59%. The rate of growth during the 1985-99 period were also
higher for females. Access of heads to social security (56%) is smaller than for other groups.
Heads are normally the main income earner in the household, so the existence of insurance
against unemployment shocks, maternity and old age plays a crucial role there. The age
profile of social security evasion rates presents an U-shaped format. It falls rapidly from 72%
for the 15-20 years old groups to its lowest level corresponding to 52% in the 25-30 years old
group and rising to 87% in the 65-70 years of age. The rate of social security evasion falls
with schooling levels - departing from 0.86% among illiterates - and income quintiles -
departing from 0.96% in the first quintile. The highest levels of evasion among economy
sectors are found in agriculture (90%) and construction ( 72%). Finally, in spatial terms the
highest levels of evasion are found among workers in rural areas (86%) and in the Northeast
How big is the informal sector? -There are 71 million occupied individuals which
corresponds to 44.7% of the total population. When restricting the analysis to active age
individuals (AAI - 15 to 65 years of age) this statistics reaches 64.4%. The working class
structure of the AAI population reveals that 23% are employees with card, 11% are public
servants and 4.1% are employers. The remainder can be roughly refered as the informal
sector: 23.4% are self employed, 11.2% are unpaid employees, 11.1% private sector
employees with no card, 7.6% domestic servants and 6.5% agricultural workers.
What is the size of earnings and schooling differentials? - Earnings differentials between
formal and informal sectors are: 83% between employees with card compared with those
without card and 284% of employers as compared to the self-employed. Average completed
years schooling differences found typically do not explain all earnings differences. Relative
earnings and schooling differentials of the so-called informal workers are: -2.3% and -19%
for the self employed, minus infinity (naturally) and -39% for unpaid employees, -29.9% and
1.67% for private employees without card, - 62% and -30% for domestic servants and - 64%
and -57% for agricultural workers.
Where are informal workers located? – According to city size the share of informal sector
jobs excedes occupied population shares in rural areas (31.6% and 24.55, respectively) and
small cities (15.1%, 14.6%). The opposite occurs in larger cities: medium cities (14.2%,
15.2%), larger non metropolitan cities (15.7%, 17.8%), metropolitan suburbs (9.3%, 11%)
and Metropolitan core (14%, 16.9%).
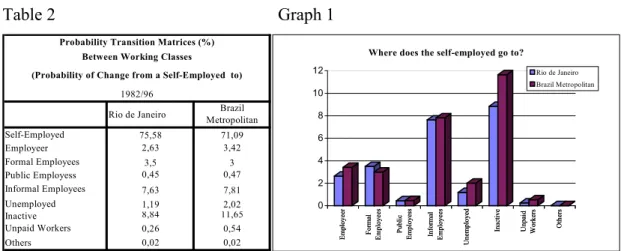
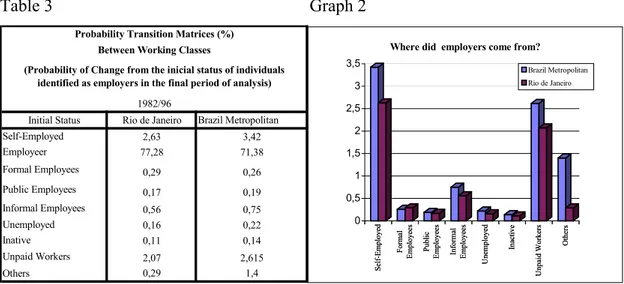
Occupational risk - Transitional data constructed from household surveys show that ex-post
risk of changing working class be divided into three groups according to their magnitude: (i)
Informal employees ( 63.14%), unemployed ( 42.06%) and unpaid workers (57.91%) are the
more unstable states, that is those with smaller probability of keeping their initial state
between consecutive months. (ii) Formal employees, public employees, and inactive present
higher staying probabilities around 90%. (iii) Self-employed and employers are in an
intermediary position with respect to the two groups mentioned above with staying
probabilities equal to 75.58% and 77.28%, respectively.
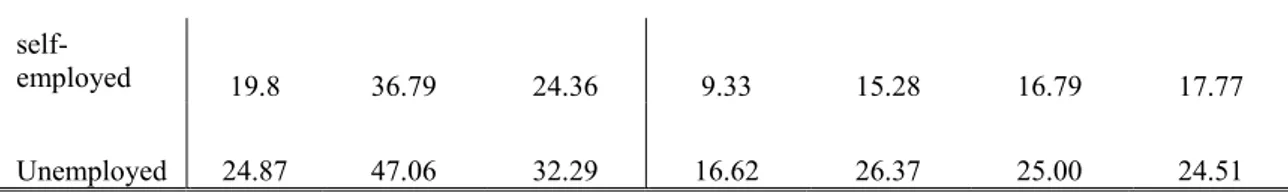
Income Risk (of those that did change jobs) - The differential between income risk between
self-employed and the whole sample of continuously occupied ranged from 54% to 26%
respect to other occupations, they are relatively more able to avoid additional risk increases in
times of higher aggregate instability.
Macro-economic issues - The possibility of constructing monthly series allowed us to
estimate the partial elasticity of informal sector earnings with respect to key macro variables.
Unemployment -Formal employees unemployment elasticity (-0.24) is smaller than the ones
found for informal workers (illegal employees (-0.42) and the self-employed (-0.62)).
Inflation - Informal employees elasticities are not statistically significant from the ones
estimated for the whole population. Real interest rates - The point estimates of interest rate
elasticity of earnings in informal sector is higher in module (illegal employees (-0.99) and the
selfemployed (0.98)) than the one found for formal employees (0.73). Minimum Wages
-partial elasticity corresponds to 0.32. The effect is higher among formal employees than in the
informal sector (illegal employees (0.16) and the self-employed (0.23)). Exchange Rates –
The impact of exchange rates on per capita income is not statistically different from zero in
either total average, formal emplyees and informal employees earnings. Self employees
average earnings fall when real exchange rates are devaluated (elasticity equals to -0.24).
Health status - The subjective self-evaluation of health conditions show that employees with
card (86.1%) are more likely to find their health status good or very good than self-employed
(71.2%), employees with no card (83.4%), agricultural workers (78.5%), domestic servants
(75.7%) and unpaid workers (72.1%).
The incidence of health problems (in the last two weeks) are less common in employees with
card (2.27%) than informal workers group: self-employed (4.26%), employees with no card
(2.93%), agricultural workers (3.13%), domestic servants (3.56%) and unpaid workers
(3.88%). The high incidence among the self-employed of hypertension (14.5%) and heart
disease (4.62) is anotner aspect that caught our attention. The high income volatily observed
among the self employed combined with their higher average age are natural candidates to
explain these differences.
Access to Health Services - Access to private health services are much higher employees
with card (42.9%) than among the self-employed (15.3%), employees with no card (16.3%),
agricultural workers (18.4%), domestic servants (15.9%) and unpaid workers (24.3%). The
reported quality of the plan among those who have a private health plan is not very different
among different working classes.
organizations and informality (43.3% for formal employees and 14.5% for both informal
employees and the self employed). The rates of effective current participation on these
activities is much smaller in all these groups only 8.8% of formal employees attend at least
one meeting per year. The same statistic corresponds 14.5% for informal employees and 3.25
in the case of the self employed.
Non professional associations - Membership rates in community associations are much
lower for formal employees (12.6%) and closer to informal sector occupations (12.3% for
informal employees, and 12.7% for the self employed). Nevertheless, the proportion of
individuals that attend to at least one meeting per year is higher for community associations
than the other types of relationships with associations analyzed. Informal workers are also
slightly more likely to attend meetings. Analysis of community associations membership
composition revealed the importance of neighborhood associations (31.4% for formal
employees, 34.7% informal employees and 37.6% for the self employed) and religious
associations (34.9% for formal employees, 38.1% informal employees but 33.1% for the self
employed).
Political Activities - Given the low rate of formal affiliation to political parties we used the
less stringent concept of having sympathy for political parties (24.8% for formal employees,
22.3% informal employees and 21.4% for the self employed). One final set of questions on
political literacy shows that 88% for formal employees, 80.2% informal employees and
82.3% for the self employed knew the correct name of the Brazilian President (Fernando
Henrique Cardoso). When one imposes the more stringent condition that the head knew the
name of the president, and respective governor and mayors these statistics fell to 74.7%,
66.4% and 68.8%, respectively.
Dealing with new technologies - The new requirements on labor skills imposed by
information age puts specific capital importance into new heights. Formal technical education
and access to new equipment, where one can learn by doin,g are today considered household
units strategic resources. 15.1% of formal employees against 9.9% for both informal
employees and 10% the self employed) did a technical course equivalent to a high school
degree. 33.2% of formal employees, 18.7% for both informal employees and 15.7% of the
self employed perceived a regular incorporation of new equipment on their work. The results
area also consistent with the idea that informal workers are victims of technological jobs
in the future: 66% of formal employees and 57-58% for both informal employees and the self
employed) said that they will need greater knowledge. While respectively 84.6%, 78.2% and
80.2% of these categories said that they believe that without new knowledge there is a big risk
of losing the current occupation.
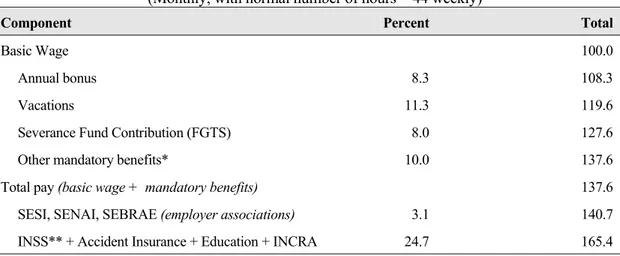
Linkages between the formal and informal sectors - Our main finding here is that many
characteristics found in the legal labor market in Brazil are also found in the illegal segment.
Furthermore, this similarity appears to be largely influenced by labor market regulations set
by the government. In other words, we show that labor laws affect not only the regulated
sector, but the "unregulated" sector as well. In most cases, we find that the typical kinks and
corners produced by legislation on wages, hours, and payment practices are also present in the
informal labor market segment. The main difference between informal and formal employees
is in their relationship – and hence of their employers – with the government in terms of
payroll taxes (the main one being social security contributions). While the employers of
about 95% of workers classified as formal (having a ratified work contract) had paid INSS
Part 1 – Outline:
Table of Contents:
I. Introduction
i. Objective
ii. Brazilian characteristics
iii. Plan of the report
II. The informal sector in the 21st century: Changing nature and trends
1. Conceptual and measurement issues
i. Sources of Information:
a. Pesquisa Nacional de Amostras a Domicilio – PNAD
b. Pesquisa Mensal do Emprego – PME
c. ENCIF 94 and 97
d. Rocinha 97
e. Census of Business Establishments of the Slums of Rio de Janeiro (CBR)
f. Pesquisa de Orçamentos Familiares – POF
g. Pesquisa de Padrões de Vida – PPV
ii. Definitons
2. Magnitude, heterogeneity and size: sub-regional variations
i. Social Security Perspective
a. What is the size of the unprotected sector in Brazil? How did it evolved
across time?
b. How heterogeneous are desprotection rates among socio-economic groups?
ii. Labor Market Perspective
a. How big is the informal sector?
b. What is the size of earnings and schooling differentials?
c. Where the informal workers are located?
d. Are the poor more informal?
3. Dynamics of the informal sector
i. Quantitative transitional analysis
a. Row analysis (where will the self-employed go to?) - Table 2 and Graph 1
b. Column analysis (where did employers come from?)
c. Diagonal analysis (occupational risk comparisons)
ii. Origins, Destinies and Risks of Informal Activities across Different Time
Horizons
iii. Analysis of Occupational Risk
a. Duration Dependence
b. Probability of Exiting Unemployment
c. Occupational Risk and Age
d. Self-Employed Income Risk
4. Segmentation and heterogeneity (mapping)
5. Macro-economic issues: how they affect or influence the informal sector
i. Dynamics of the informal sector during booms and recessions
a. Income
b. Poverty
ii. Analysis of correlation between macro variables and informal sector
earnings
a. Unemployment
b. Inflation
c. Real interest rates
d. Minimum Wages
e. Exchange Rates
6. Specific sub-groups: gender and child labour
i. Gender
ii. Child Labor
7. Nature of linkages between the formal and informal sectors
i. Overview
i. Objective
Brazil has a substantial share – about 60% by some measures - of its employees
working without labor registry and 62% of its private sector workers not contributing to social
security. Informality is important because its job precaurioness, social desprotection
consequences, and it is also very correlated with poverty and other social welfare concepts
measured at a family level. 58% of the country population that is found below the indigent
line live in families headed by informal workers.
The complexity of the informal sector as subsisting in a continuum with the formal
sector cannot be left out. As (ILO 2001) puts it: “Frequently we find legally established
workes with lower job quality than many informal jobs. In other words, not all informal sector
jobs is "indecent"”. The problem occurs when there are multiple relevant dimensions to
quantify a job quality. When one overlaps many yes or no (or black and white) classifications
we get various maybes (or tones of grey). To make matters even more complex, many isolated
aspects of the so-called informal sector are not discrete, but continuos2. Futhermore, these
aspects change frequently over time. Finally, the basis used for targeting policy and
programme interventions are quite different for different perspectives on how to view
informality such as lowering job precaurioness, decreasing occupational risks, increasing the
degree of protection against adverse shocks (idiossincratic or aggregate), allowing that good
oportunities to be taken by the credit provision, improving informal workers family living
conditions, implementing afirmative actions, reducing tax evasion etc.
The problem addressed in this report is to gauge various aspects of the informal sector
activities. Our artistic constraint are the available sources of information. The final purpose is
to help the design of policies aimed to assist those that hold “indecent” jobs.
ii. Brazilian characteristics
Brazil's experience over the last decades offers special conditions to analyze the
causes and consequences of low quality jobs and informality.
• First, labor markets surveys in Brazil have traditionally asked direct questions if
employees possess or not working permits (carteira de trabalho) allowing us to
2
. For example, a formal worker may contribute a small part of what he should be paying according to
distinguish formal from informal employees. Some of these surveys also ask if workers, in
general, contribute or not to social security.
• Second, Brazil is very well served in terms of large household surveys that offer the
possibility of following the same individuals through short periods of time. This
longitudinal aspect allow us to analyze changes in several labor market outcomes at an
individual level. The changing nature of jobs attributes will be captured using panel data.
• Third, there are very detailed surveys available on the functioning of small firms (below
five employees) at a national urban level. Since the emphasis o fthe report are workers
conditions we will use these surveys as a way to gauge working condition. There are also
similar surveys that investigate these characteristics at low income communities (favelas)
where poverty can be defined at a spatial level.
• Fourth, Brazil offers not only a regulated labor market, but these regulations also change
from time to time offering ‘natural experiments’ to study the effects of regulation on
informality. The high instability of macro and microeconomic enviroment also offers a lot
of variation to explain.
• Finally, and perhaps most importantly, the size of the country combined with the
increasing profusion of various local initiatives generate a rich laboratory to study the
outcomes of policies designed to foster informal jobs quality.
II.
The informal sector in the 21
stcentury: Changing nature and trends
1. Conceptual and measurement issues
i. Sources of Information:
We present below an overview of existing sources of microdata on informality and job
Standard H ousehold Surveys M icro-entrepreneurial Establishm ent Level
Surveys Surveys
PNAD 1976-99*
- Cross-section (100.000 per year) INFORMAL ECONOMY*
-Detailed Maps: Spatial, ENCIF - 94 and 97
Ocupational, Sectors, Firms Size
Health Supplement 98*
Poor Enterpreneurs
PME 1980-99*
- Cross-section (40.000 per month) ROCINHA 97* CAGED, RAIS
-Longitudinal Ministério do Trabalho
- Cohort - Time Series
Social Capital Supplement 96*
LOW INCOME SMALL COMMUNITIES*
98 and 99 POF 87/88 and 95/96
- Assets and Liabilities Data
CADASTRO DE EMPRESAS - IBGE PPV
a. Pesquisa Nacional de Amostras a Domicilio - PNAD (an annual national household survey).
This is an annual household survey performed in the third quarter that interviews
100,000 households every year. It is conducted by Instituto Brasileiro de Geografia e
Estatística - IBGE since 1967.
This survey has extensive information on personal and occupational characteristics of
individuals. PNAD underwent a major revision between 1990 and 1992 increasing the
size of the questionnaire from 60 to 130 questions. The new questionnaire that is
available for 1992, 1993, 1995, 1996 and 1997 has retrospective information on on
previous working classes and sectors activitities that also allow us to estimate transition
probabilities into and out of self-employment on an national basis.
b. Pesquisa Mensal do Emprego - PME :This monthly employment survey is performed in the six main Brazilian metropolitan regions by IBGE. It covered an average of
40000 monthly households since 1980. This survey has also detailed characteristics on
personal and occupational characteristics of all household members. PME replicates the
US Current Population Survey (CPS) sampling scheme attempting to collect
information on the same dwelling eight times during a period of 16 months. More
specifically, PME attempts to collect information on the same dwelling during months t,
t+1, t+2, t+3, t+12, t+13, t+14, t+15. This short-run panel characteristic will allow us
to assess occupational mobility and to study the closest determinants of movements into
and out of informal activities. PME large sample size combined with its high frequency
also allow us to construct monthly time series on earnings based social indicators at a
reasonably detailed level of desegregation.
c. ENCIF 94 and 97 :This survey collected data on small business and on self-employed units in the Rio de Janeiro metropolitan region during the second semester of 1994.
This survey was extended in 1997 to all Brazilian urban areas. The data collection
process was done in two steps: first, a standard household survey that while collecting
studied in detail the operation of small business and self-employed units. The survey
included questions related to volume of sales, volume of imputes bought, volume of
investments made, value of equipment, credit sources, future plans, technical assistance
received, number of employees hired, sectors of activity, duration, place of operation,
etc. We will emphasize here the worker dimension so microentreprises surveys will be
only used as a way to gauge jobs quality.
d. Rocinha 97: the surveys regularly conducted by IBGE – the Brazilian Central Statistical Office mentioned above cannot be expected to provide such detailed
information on a local level. The target population was composed of business
establishments located in residential and non-residential housing within the largest slum
of Rio de janeiro: Rocinha.
The survey collected information on the revenue, employment, wages, sales,
expenditure, and other economic variables, of the business establishments, located in
the various communities. In addition, information about the business organization and
the characteristics of the proprietors (and employees) was also collected, as was their
future business plans.
e. Census of Business Establishments of the Slums of Rio de Janeiro (CBR) - Between March of 1998 and March of 2000 a specific household survey and a census of business
establishments were carried out in 51 slums of the city of Rio de Janeiro. The objective
of the establishment census was to identify the basic structural characteristics of
economic units located in the communities.
A difficult part of the census was the detection of the establishments operating within
households but not visible from the outside. In such environments it is not unusual to
find small informal counters set up as storefronts extending from living rooms, garages
and front porches. These were all targeted by this census. For that reason, a definition
of the target population is in some sense peculiar. Establishments that are within the
scope of the survey were those, which are located in non-residential housing or in
household, and also those having counters or windows through which business is
conducted separate from domestic affairs. Therefore, an important issue involved in
this survey was what to consider an establishment and how to define it in terms of the
survey.
f. Pesquisa de Orçamentos Familiares - POF: This consumer expenditure survey was performed only twice in 1987 and 1996 by IBGE. It covers the eleven main Brazilian
metropolitan regions. Besides information on personal and occupational characteristics
of individuals, the survey has a very broad and desegregated data on income sources,
consumption expenditures and on how durable goods purchases are financed. POF also
has data on the access to financial services (credit cards, checking accounts etc.) and
how much they do contribute to social security.
g. Pesquisa de Padrões de Vida - PPV: The Brazilian version of the Living standard measurement survey (LSMS) was implemented only once in 1995-96 in a joint project
between the World Bank and IBGE. Even tough, PPV data has already been processed,
we did not warrant its use for this project at this point.
PPV sample of 5000 covers only the densely populated north-east and south-east
regions. Like PNAD, this survey also has detailed information on personal and
occupational characteristics of individuals. PPV has detailed information on personal
and occupational characteristics of individuals, on the possession of durable goods and
on housing conditions. PPV questionnaire has special sections devoted to consumption
(at a desegregated level), to individual financial behavior, to micro-enterprises and
self-employment finance.
ii. Definitons:
The literature on Brazilian labor markets often groups together self-employed units
and illegal employees and label them as the informal sector. The unifying feature according
to this classification would be the precariousness level of these occupations. Both of these
main source of information used here. According to the typical survey questionnaire
self-employed would be much closer to employers in terms of contractual labor relations. The
basic distinction between self-employed and employers is the fact that the former does not
hire labor. There is an extensive empirical literature for the US and the UK that uses the
movements towards self-employed as a proxy for the creation of enterpreneurship in the
economy.
In Brazil, formal employment usually implies that the worker is an employee with a
signed employment booklet (card). Informal employment in Brazil is understood to imply
that the worker is an employee without a signed employment booklet (no card), which
means that the employment relation is not registered with the Ministry of Labor and is
therefore not legally covered by the labor code (meaning that the worker probably does not
receive certain benefits and protections).
Unemployment is usually a narrowly defined concept: the worker must have looked
for work in the week prior to the interview, and not be engaged in any employed activity.
Any worker who is not employed and has not undertaken such a search is defined as
inactive. This category is, as a consequence, more heterogeneous than the others,
comprising anyone from the leisure-seeking plutocrat to the discouraged jobless. We
follow other definitions recomended by ILO and separate unemployed and inactive workers
in the analysis.
This report also uses as key elements to characterize empirically the decency of jobs a
vast array of attributes such as questions related to the degree of social security evasion,
various forms of fiscal evasion, jobs precariousness level, occupational and work related
health risks measures at an individual level and low living conditions at family levels. The
informal sector is perceived as a continuum with the formal sector working conditions.
2. Magnitude, heterogeneity and size: sub-regional variations
i. Social Security Perspective
An initial way to segment workers between formal and informal occupations is to
which divides employees according to having or not a registry in the Labor Ministry (MTE)
to the new criteria that uses register in the Social Security Ministry (MPAS). This later
category is perhaps more appropriate to analyze social protection and fiscal evasion issues.
a. What is the size of the unprotected sector in Brazil? How did it evolved across time?
According to PNAD 99, the latest survey available at a national level, there are 63.7
million individuals occupied in the private sector. The rate of social security evasion
INFORMALITY AS EVASION FROM SOCIAL SECURITY - BRAZIL
Evasion Rate Private Occupied Population (1000`s)
1985 1999 1985 1999
Total 0.53 0.62 53628 63742
Gender
Male 0.51 0.59 35712 39203
Female 0.56 0.66 17916 24540
Family Status
Head 0.43 0.56 25732 30841
Spouse 0.57 0.69 7820 13218
Son/Daugther 0.65 0.67 16982 16543
Other relatives 0.54 0.64 1932 2336 Aggregated members 0.59 0.65 240 269
Pensioner 0.24 0.37 191 93
Domestic servant 0.77 0.63 731 439 Domestic servant relative 1.00 0.10 0 2
Age
Less than 15 years 0.94 0.98 4055 3424
15 to 20 years 0.70 0.72 7970 7536
20 to 25 years 0.47 0.54 8257 8389
25 to 30 years 0.40 0.52 7347 7939
30 to 35 years 0.40 0.53 6449 7924
35 to 40 years 0.42 0.54 5392 7361
40 to 45 years 0.44 0.56 4330 6186
45 to 50 years 0.48 0.59 3427 4826
50 to 55 years 0.52 0.66 2544 3647
55 to 60 years 0.56 0.71 1815 2635
60 to 65 years 0.64 0.79 1122 1733
65 to 70 years 0.75 0.87 528 1126
More than 70 years 0.78 0.92 393 1017
Years of Schooling
0 years 0.83 0.86 10260 8410
0 to 4 years 0.70 0.80 11324 11487
4 to 8 years 0.51 0.66 17376 20949
8 to 12 years 0.24 0.44 10582 18120
More than 12 years 0.10 0.27 3850 4777
Sector of Activity
Agriculture 0.93 0.90 14430 16474
Constuction 0.51 0.72 3099 4523
Public Sector 0.12 0.36 5731 1551
Service 0.47 0.54 21245 31877
Industry 0.30 0.38 9122 9318
Population Density
Rural 0.86 0.86 15454 16538
Urban 0.46 0.59 21541 29552
Metropolitan 0.30 0.44 16632 17652
Region
Center 0.80 0.69 5001 4927
Northeast 0.32 0.82 12551 18230
North 0.36 0.75 5179 2190
Southeast 0.52 0.49 9298 27419
South 0.59 0.55 6820 10977
Income Quintile
1 (poorest) 0.96 0.96 11727 13899
2 0.69 0.83 11257 13282
3 0.49 0.53 11080 11519
4 0.25 0.42 9802 13488
5 (richest) 0.16 0.29 9761 11554
b. How heterogeneous are desprotection rates among socio-economic groups?
Bivariate analysis
As expected the rate of informality is higher for females 66% than for males 59%.
The rate of growth during the 1985-99 period were also higher for females. Access of heads
to social security (56%) is samller than for other groups, except for the small group
pensioners. Heads are normally the main income earner in the household, so the existence
of insurance against as unemployment shocks, maternity and old age plays a crucial role
there. The age profile of social security evasion rates presents an U-shaped format. It falls
rapidly from 72% for the 15-20 years old groups to its lowest level corresponding to 52% in
the 25-30 years old group and rising to 87% in the 65-70 years of age. The rate of social
security evasion falls monotonically with schooling levels - departing from 0.86% among
illiterates - and income quintiles - departing from 0.96% in the first quintile. The highest
levels of evasion among economy sectors are found in agriculture (90%) and construction (
72%). Finally, in spatial terms the highest levels of evasion are found among workers in
rural areas (86%) and in the Northeast region (82%).
Multivariate analysis
When we control for all attributes mentioned above simultaneously, by means of a
logistic regression of the probability of evasion, most of the individual attributes effects
becomes milder. This is because, there is a positive correlation between characteristics that
lead to social security evasion3. For example, spouses are more likely to be females. The controled gender effect is almost zero. The only exception are most of sector of activity
classes where the controled effects are greater than total effects. Once we control for other
attibutes the chances of evasion are higher in construction and services than if we do not
implement these controls.
We observe only a few inversions of the sign when we perform the controled experiment4. The most prominent examples are domestic servants as family status and the south region.
3
Manifested through an unconditional odds ratio futher from unity than its respective conditional odds ratio.
4
LOGISTIC MODEL - 1999 Does Not Contribute to Social Security
OCCUPIED
Sample : Occupied population in the private sector
Odds Ratio
Estimate t-statistic PRED Condicional Not Condic. Prop Standard error Total Pop. (%) Gender Female -0.0004 -0.44 0.5004 0.9996 1.3353 0.66 0.0019 38.50
Family Status Spouse 0.2674 243.09 ** 0.5669 1.3066 1.7838 0.69 0.0025 20.74
Son/Daugther -0.0089 -8.90 ** 0.4983 0.9911 1.6360 0.67 0.0023 25.95
Other relatives -0.0296 -16.44 ** 0.4931 0.9708 1.3978 0.64 0.0063 3.67
Aggregated members 0.2323 46.46 ** 0.5583 1.2615 1.5024 0.65 0.0178 0.42
Pensioner -0.0668 -8.79 ** 0.4838 0.9354 0.4669 0.37 0.0300 0.15
Domestic servant -0.4789 -129.43 ** 0.3830 0.6195 1.3750 0.63 0.0131 0.69
Age Less than 15 years 1.6734 408.15 ** 0.8423 5.3303 29.1580 0.98 0.0005 5.37
15 to 20 years 0.2878 169.29 ** 0.5719 1.3335 1.7864 0.72 0.0031 11.82
20 to 25 years -0.1421 -94.73 ** 0.4650 0.8675 0.8313 0.54 0.0036 13.16
25 to 30 years -0.1460 -104.29 ** 0.4640 0.8642 0.7743 0.52 0.0037 12.45
30 to 35 years -0.1130 -80.71 ** 0.4723 0.8932 0.8054 0.53 0.0037 12.43
35 to 40 years -0.1078 -77.00 ** 0.4735 0.8978 0.8165 0.54 0.0038 11.55
40 to 45 years -0.0463 -30.87 ** 0.4889 0.9548 0.8858 0.56 0.0042 9.71
50 to 55 years 0.1143 67.24 ** 0.5290 1.1211 1.3498 0.66 0.0050 5.72
55 to 60 years 0.1892 94.60 ** 0.5476 1.2083 1.7442 0.71 0.0054 4.13
60 to 65 years 0.4906 196.24 ** 0.6207 1.6333 2.7060 0.79 0.0053 2.72
65 to 70 years 0.9734 286.29 ** 0.7262 2.6469 4.6895 0.87 0.0047 1.77
More than 70 years 1.2514 284.41 ** 0.7779 3.4952 8.2908 0.92 0.0031 1.60
Years of Schooling 0 years 1.0698 594.33 ** 0.7449 2.9148 16.2073 0.86 0.0018 13.19
0 to 4 years 0.9486 592.88 ** 0.7212 2.5821 10.4473 0.80 0.0020 18.02
4 to 8 years 0.8023 573.07 ** 0.6909 2.2307 5.1431 0.66 0.0021 32.87
8 to 12 years 0.3573 274.85 ** 0.5888 1.4295 2.0770 0.44 0.0024 28.43
Sector of Activity Agriculture 1.3277 948.36 ** 0.7908 3.7724 14.5258 0.90 0.0010 25.84
Constuction 1.6709 1,193.50 ** 0.8419 5.3170 4.1568 0.72 0.0039 7.10
Public Sector 0.4483 213.48 ** 0.6107 1.5656 0.9399 0.36 0.0076 2.43
Service 0.7482 831.33 ** 0.6792 2.1132 1.9534 0.54 0.0018 50.01
Populacion Density Rural 0.4149 345.75 ** 0.6027 1.5142 7.9461 0.86 0.0013 25.94
Urban 0.1583 226.14 ** 0.5400 1.1715 1.8452 0.59 0.0020 46.36
Region Center 0.5196 433.00 ** 0.6275 1.6814 2.3092 0.69 0.0033 7.73
Northeast 0.7135 792.78 ** 0.6716 2.0411 4.9057 0.82 0.0014 28.60
North 1.0400 577.78 ** 0.7392 2.8292 3.1858 0.75 0.0044 3.44
South -0.1037 -115.22 ** 0.4746 0.9015 1.2978 0.55 0.0030 17.22
Quintile 1º 2.9608 1,644.89 ** 0.9509 19.3134 65.7065 0.96 0.0004 21.80
2º 1.6492 1,374.33 ** 0.8390 5.2028 11.5622 0.83 0.0016 20.84
3º 0.4901 445.55 ** 0.6206 1.6325 2.7961 0.53 0.0030 18.07
4º 0.2772 277.20 ** 0.5693 1.3194 1.7642 0.42 0.0028 21.16
DF Value Value/DF
Number of observations : 137665 ; Log Likelihood : ; Pearson Chi-Square : 28000 14671448 517
i)Statistically different from zero: *90% **95%.
iii) Omitted dummies:male, head, 45-50 years of age, more than 12 years of schooling, industry, metropolitan, Southeast and 5º quintile.
Univariate Analysis %
Does not contribute 39,489,843 62.0
Contribute 24,252,466 38.0
Table 3
c. Where social security evasion is most likely to occur?
We use as a geographical unities meso-regions of states. We answer this spatial
question in two steps, ploting maps for the conditional and the unconditional effects. The
unconditional comes directly from the evasion rate found in the private sector of each
region. While the conditional analysis plots the dummies for each mesoregion once the
other variables are taken into analysis in a regression similar to the ones presented above.
LOGISTIC MODEL - 1985 Does Not Contribute to Social Security
OCCUPIED
Sample : Occupied population in the private sector
Odds Ratio
Estimate t-statistic PRED Condicional Not Condic. Prop Standard error Total Pop. (%) Gender Female -0.0869 -72.42 ** 0.4790 0.9168 1.2385 0.56 0.0018 33.41
Family Status Spouse 0.6642 442.80 ** 0.6609 1.9429 1.7492 0.57 0.0027 14.58
Son/Daugther 0.2008 154.46 ** 0.5507 1.2224 2.5224 0.65 0.0018 31.67
Other relatives 0.1342 61.00 ** 0.5342 1.1436 1.5501 0.54 0.0055 3.60
Aggregated members -0.0224 -3.61 ** 0.4951 0.9778 1.9207 0.59 0.0155 0.45
Pensioner -0.1378 -20.57 ** 0.4663 0.8713 0.4200 0.24 0.0132 0.36
Domestic servant 0.2564 73.26 ** 0.5645 1.2923 4.5193 0.77 0.0058 1.36
Age Less than 15 years 1.5736 491.75 ** 0.8287 4.8240 18.0679 0.94 0.0009 7.56
15 to 20 years 0.7559 359.95 ** 0.6811 2.1295 2.4605 0.70 0.0024 14.86
20 to 25 years 0.2161 113.74 ** 0.5545 1.2412 0.9332 0.47 0.0027 15.40
25 to 30 years 0.1235 65.00 ** 0.5316 1.1315 0.7233 0.40 0.0028 13.70
30 to 35 years 0.0425 22.37 ** 0.5113 1.0434 0.7051 0.40 0.0029 12.03
35 to 40 years 0.0314 15.70 ** 0.5086 1.0319 0.7888 0.42 0.0033 10.05
40 to 45 years -0.0635 -31.75 ** 0.4849 0.9385 0.8393 0.44 0.0037 8.07
50 to 55 years -0.0407 -17.70 ** 0.4906 0.9601 1.1397 0.52 0.0050 4.74
55 to 60 years -0.0461 -17.73 ** 0.4892 0.9549 1.3505 0.56 0.0058 3.38
60 to 65 years 0.1446 46.65 ** 0.5368 1.1556 1.8867 0.64 0.0071 2.09
65 to 70 years 0.5212 115.82 ** 0.6281 1.6840 3.2827 0.75 0.0083 0.98
More than 70 years 0.2787 52.58 ** 0.5699 1.3214 3.7688 0.78 0.0090 0.73
Years of Schooling 0 years 1.5226 634.42 ** 0.8213 4.5841 45.0600 0.83 0.0014 19.13
0 to 4 years 1.2126 551.18 ** 0.7713 3.3622 21.5914 0.70 0.0020 21.12
4 to 8 years 0.8465 403.10 ** 0.7004 2.3315 9.5450 0.51 0.0019 32.40
8 to 12 years 0.2489 118.52 ** 0.5626 1.2826 2.9014 0.24 0.0017 19.73
Sector of Activity Agriculture 2.7018 1,688.63 ** 0.9373 14.9065 30.5146 0.93 0.0006 26.91
Constuction 1.1389 711.81 ** 0.7580 3.1233 2.4069 0.51 0.0043 5.78
Public Sector -0.8648 -480.44 ** 0.2969 0.4211 0.3216 0.12 0.0013 10.69
Service 0.7749 704.45 ** 0.6852 2.1704 2.0364 0.47 0.0016 39.62
Populacion Density Rural 0.5826 416.14 ** 0.6423 1.7907 14.6025 0.86 0.0010 28.82
Urban 0.1099 109.90 ** 0.5282 1.1162 1.9817 0.46 0.0018 40.17
Region Center 1.0046 528.74 ** 0.7325 2.7308 3.6886 0.80 0.0023 9.32
Northeast 0.1404 108.00 ** 0.5358 1.1507 0.4439 0.32 0.0025 23.40
North 0.4011 250.69 ** 0.5996 1.4935 0.5311 0.36 0.0036 9.66
South 0.3917 261.13 ** 0.5974 1.4795 1.3159 0.59 0.0028 12.72
Quintile 1º 3.1520 1,576.00 ** 0.9591 23.3828 112.6416 0.96 0.0004 21.87
2º 1.3087 872.47 ** 0.7878 3.7014 11.4644 0.69 0.0020 20.99
3º 0.7646 546.14 ** 0.6830 2.1481 4.9643 0.49 0.0023 20.66
4º 0.1550 110.71 ** 0.5394 1.1677 1.7791 0.25 0.0019 18.28
DF Value Value/DF
Number of observations : 207577 ; Log Likelihood : -20216866.35 ; Pearson Chi-Square : 37000 14761378 398
i)Statistically different from zero: *90% **95%.
iii) Omitted dummies:male, head, 45-50 years of age, more than 12 years of schooling, industry, metropolitan, Southeast and 5º quintile.
Univariate Analysis %
Does not contribute 28,327,397 52.8 Contribute 25,300,605 47.2
ODDS Ratio - Does not contribute to Social Security No Information
0 - 0.999 1
1.001 - 6.089 6.089 - 14.169 14.169 - 37.656 37.656 - 252.46
Does not Contribute to Social Security
not Conditional Odds Ratio
Occupied Population in the Restricted Private Sector
Map 2
ODDS Ratio - Does not contribute to Social Security No Information
0 - 0.783 0.783 - 0.999 1
1.001 - 2.662 2.662 - 7.815 7.815 - 43.41
Does not Contribute to Social Security
Conditional Odds Ratio
Occupied Population in the Restricted Private Sector
We move now from the more straight-forward social security perspective into a
working class perspective.Before we do that, it is interesting to note how these perspectives
overlap. The rate of evasion from social security found among employees with no card is
95% and among the self-employed 85%.
a. How big is the informal sector?
According to PNAD 99, there are 71 million occupied individuals which
corresponds to 44.7% of the total population. When restricting the analysis to active age
individuals (AAI - 15 to 65 years of age) this statistics reaches 64.4%. The working class
structure of the AAI population reveals that 23% are employees with card , 11% are public
servants and 4.1% are employers. The remainder 62% can be roughly refered in most
classifications as the informal sector: 23.4% are self employed, 11.2% are unpaid
employees, 11.1% private sector employees with no card, 7.6% domestic servants and
6.5% agricultural workers.
Table 4
WORKER PROFILE - 1999
TOTAL POPULATION BRAZIL
A CLASS Total
Population
AAI (15 to 65 years)
Occupied (10 years or
more)
AAI (15 to 65 years)
Total 158,662,823 102,878,434 70,951,418 14,900,793 Working Class Unemployed 7,553,547 7,231,978 - 811,914 Inactive 50,282,242 29,376,391 - 4,483,748 Employees (w/card) 16,368,307 16,278,484 16,365,261 2,907,779 Employees (no card) 7,711,263 7,357,919 7,711,002 860,920 Self - Employed 16,472,857 15,393,123 16,472,014 1,935,804 Employer 2,875,523 2,708,257 2,874,681 1,048,833 Public Servant 7,790,303 7,697,738 7,788,645 1,741,881 Unpaid 9,957,871 534 9,957,029 -Agricultural worker 4,513,077 4,304,947 4,512,543 98,471 Domestic worker 5,267,071 5,061,841 5,265,666 414,891 Unknow 1,109 1,109 1,109
Table 5
b. What is the size of earnings and schooling differentials?
Earnings differentials between formal and informal sectors are quite high 83%
between employees with card compared with those without card and 284% of employers as
compared to the self-employed. Average completed years schooling differences found are
high but tipically do not explain all earnings differences. When compared to the whole AAI
population relative earnings and schooling differentials of the so-called informal workers
are: -2.3% and -19% for the self employed, minus infinity (naturally) and -39% for unpaid
employees, -29.9% and 1.67% for private employees without card, - 62% and -30% for
domestic servants and - 64% and -57% for agricultural workers.
WORKER PROFILE - 1999
TOTAL POPULATION (% COMPOSITION) BRAZIL
A CLASS
Total Population
AAI (15 to 65 years)
Occupied (10 years or
more)
AAI (15 to 65 years)
Total 100.00 100.00 100.00 100.00
Working Class Unemployed 4.76 7.03 - 5.45
Inactive 31.69 28.55 - 30.09
Employees (w/card) 10.32 15.82 23.07 19.51
Employees (no card) 4.86 7.15 10.87 5.78
Self - Employed 10.38 14.96 23.22 12.99
Employer 1.81 2.63 4.05 7.04
Public Servant 4.91 7.48 10.98 11.69
Unpaid 6.28 0.00 14.03
-Agricultural worker 2.84 4.18 6.36 0.66
Domestic worker 3.32 4.92 7.42 2.78
Unknow 0.00 0.00 0.00
Table 7
WORKER PROFILE - 1999
EARNINGS
BRAZIL
A CLASS
Total Population
AAI (15 to 65 years)
Occupied (10 years or
more)
AAI (15 to 65 years)
Total 190.75 287.45 429.44 670.69
Working Class Unemployed - - -
-Inactive - - -
-Employees (w/card) 567.26 566.48 567.28 992.32
Employees (no card) 310.69 317.70 310.69 641.38
Self - Employed 425.57 438.02 425.58 1,020.68
Employer 1,633.46 1,620.92 1,632.98 2,268.44
Public Servant 703.92 704.63 703.95 1,241.43
Unpaid - - -
-Agricultural worker 192.33 196.57 192.33 677.88
Domestic worker 166.60 169.42 166.59 233.45
Unknow - - -
-Source: PNAD - IBGE Elaboration : CPS\IBRE\FGV
WORKER PROFILE - 1999
RELATIVE EARNINGS
BRAZIL
A CLASS Total
Population
AAI (15 to 65 years)
Occupied (10 years or
more)
AAI (15 to 65 years)
Total 100.00 100.00 100.00 100.00 Working Class Unemployed - - -
-Inactive - - - -Employees (w/card) 297.38 197.07 132.10 147.96 Employees (no card) 162.88 110.52 72.35 95.63 Self - Employed 223.10 152.38 99.10 152.18 Employer 856.34 563.90 380.26 338.22 Public Servant 369.03 245.13 163.92 185.10 Unpaid - - - -Agricultural worker 100.83 68.38 44.79 101.07 Domestic worker 87.34 58.94 38.79 34.81
Unknow - - -
Table 8
WORKER PROFILE - 1999
AVERAGE COMPLETED YEARS OF SCHOOLING BRAZIL
AAI (15 to 65 years) Self - Employed Employees (no card) Agricultural Worker Domestic Servant Unpaid Total 6.94 5.78 7.27 3.08 5.02 4.35
Gender Male 6.597 5.29 6.51 3.04 4.29 4.86
Female 7.27 6.98 9.17 3.44 5.08 4.08
Family Status Head 6.42 5.20 6.22 2.62 4.34 3.86
Spouse 6.70 6.84 8.15 2.98 4.68 3.71
Son/Daugther 8.03 7.19 8.24 4.26 6.70 5.40
Other relatives 6.39 5.82 6.76 3.34 5.44 3.53
Aggregated members 6.95 6.47 7.21 2.27 6.86 4.63
Pensioner 10.06 12.55 7.23 3.15 4.90 7.91
Domestic servant 5.24 - - - 5.24
-Domestic servant relative 5.87 - - - 6.93
-Age Less than 15 years 5.61 4.71 5.70 3.94 4.94 4.36
15 to 20 years 7.42 6.19 7.70 4.57 6.23 5.50
20 to 25 years 8.19 6.46 8.27 3.75 6.63 5.70
25 to 30 years 7.80 6.72 7.38 3.50 5.53 4.95
30 to 35 years 7.56 6.80 6.85 3.18 4.93 4.37
35 to 40 years 7.19 6.46 6.84 2.65 4.57 4.22
40 to 45 years 6.88 5.83 6.86 2.55 4.33 3.73
45 to 50 years 6.42 5.50 6.25 1.83 3.62 3.27
50 to 55 years 5.33 4.65 6.25 1.65 3.00 2.62
55 to 60 years 4.64 3.74 5.28 1.25 2.61 2.29
60 to 65 years 3.76 3.08 5.10 1.15 2.29 2.31
Years of Schooling 0 years - - - - -
-0 to 4 years 2.25 2.19 2.28 2.17 2.32 2.17
4 to 8 years 5.02 4.82 5.23 4.71 4.95 4.81
8 to 12 years 9.67 9.63 9.59 8.99 9.07 9.33
More than 12 years 21.24 21.57 21.88 35.94 82.31 27.59
Race Indigenous 5.52 3.84 7.24 2.64 3.90 1.89
White 8.07 7.01 8.27 3.89 5.60 5.38
Black 5.50 4.31 6.08 2.52 4.56 3.38
Asian 10.72 9.74 13.46 4.39 4.70 8.11
Immigration Status Less than 4 years 7.23 6.81 7.13 3.41 5.12 5.79
5 to 9 years 7.12 6.44 7.58 3.83 4.79 5.70
More than 10 years 6.57 5.69 6.55 2.85 4.56 4.25
No immigrant 7.14 5.69 7.57 3.01 5.52 4.24
Sector of Activity Agriculture 3.25 2.71 - 3.01 - 3.52
Industry 7.37 4.55 6.54 2.89 - 5.68
Constuction 4.94 4.62 4.81 - - 5.69
Public Sector 11.40 10.01 9.63 5.73 - 13.49
Service 8.02 7.31 8.08 - 5.02 7.58
Employment Tenure Up to 1 year 6.71 7.00 7.37 3.13 5.16 5.64
1 to 3 years 7.58 6.68 7.46 3.59 5.46 5.39
3 to 5 years 7.54 6.62 7.19 3.41 5.26 4.75
More than 5 years 6.81 4.97 6.67 2.63 4.05 3.62
Populacion Density Rural 3.98 2.96 5.65 2.74 4.27 3.47
Urban 7.19 6.13 7.07 3.55 5.19 5.83
Metropolitan 8.32 7.93 8.01 5.32 5.04 6.89
Region Center 6.72 5.98 6.86 3.44 4.97 4.89
Northeast 5.24 3.73 6.07 1.89 3.94 3.14
North 6.86 5.40 6.68 3.07 5.14 4.76
Southeast 7.85 7.33 7.92 3.54 5.39 5.27
WORKER PROFILE - 1999
RELATIVE AVERAGE COMPLETED YEARS OF SCHOOLING BRAZIL
AAI (15 to 65 years) Self - Employed Employees (no card) Agricultural Worker Domestic Servant Unpaid Total 100.00 100.00 100.00 100.00 100.00 100.00
Gender Male 95.04 91.65 89.59 98.45 85.43 111.74
Female 104.68 120.92 126.14 111.59 101.04 93.91
Family Status Head 92.45 90.04 85.57 84.86 86.29 88.83
Spouse 96.55 118.47 112.05 96.70 93.17 85.27
Son/Daugther 115.69 124.55 113.32 138.13 133.39 124.05
Other relatives 92.09 100.79 92.93 108.39 108.20 81.18
Aggregated members 100.07 112.03 99.20 73.73 136.59 106.54
Pensioner 144.98 217.32 99.47 102.04 97.54 181.97
Domestic servant 75.53 0.00 0.00 0.00 104.36 0.00
Domestic servant relative 84.52 0.00 0.00 0.00 137.98 0.00
Age Less than 15 years 80.78 81.58 78.41 127.93 98.33 100.33
15 to 20 years 106.91 107.16 105.84 148.39 124.06 126.48
20 to 25 years 117.92 111.91 113.81 121.61 131.88 131.06
25 to 30 years 112.41 116.38 101.57 113.68 110.07 113.88
30 to 35 years 108.89 117.76 94.18 103.02 98.09 100.43
35 to 40 years 103.53 111.86 94.12 86.09 91.03 97.00
40 to 45 years 99.12 100.89 94.31 82.67 86.10 85.69
45 to 50 years 92.51 95.17 85.89 59.42 72.13 75.22
50 to 55 years 76.78 80.49 86.00 53.43 59.65 60.21
55 to 60 years 66.90 64.71 72.58 40.59 52.01 52.57
60 to 65 years 54.15 53.26 70.15 37.39 45.48 53.07
Years of Schooling 0 years 0.00 0.00 0.00 0.00 0.00 0.00
0 to 4 years 32.38 37.96 31.37 70.25 46.08 49.92
4 to 8 years 72.33 83.42 71.96 152.79 98.56 110.55
8 to 12 years 139.34 166.73 131.95 291.75 180.54 214.56
More than 12 years 305.98 373.43 300.97 1165.95 1638.20 634.32
Race Indigenous 79.48 66.44 99.54 85.74 77.60 43.41
White 116.27 121.41 113.73 126.07 111.36 123.72
Black 79.17 74.57 83.65 81.58 90.73 77.72
Asian 154.44 168.56 185.11 142.47 93.56 186.52
Immigration Status Less than 4 years 104.22 117.94 98.07 110.60 101.84 133.05
5 to 9 years 102.55 111.50 104.21 124.37 95.41 131.13
More than 10 years 94.61 98.45 90.03 92.29 90.68 97.80
No immigrant 102.85 98.50 104.08 97.76 109.89 97.41
Sector of Activity Agriculture 46.76 46.94 0.00 97.78 0.00 80.90
Industry 106.16 78.73 89.95 93.62 0.00 130.55
Constuction 71.15 80.03 66.17 0.00 0.00 130.79
Public Sector 164.21 173.34 132.44 185.72 0.00 310.13
Service 115.60 126.54 111.07 0.00 100.00 174.19
Employment Tenure Up to 1 year 96.60 121.26 101.37 101.46 102.69 129.75
1 to 3 years 109.21 115.63 102.61 116.40 108.76 123.95
3 to 5 years 108.65 114.59 98.86 110.63 104.74 109.12
More than 5 years 98.17 86.12 91.77 85.24 80.64 83.27
Populacion Density Rural 57.39 51.28 77.67 88.77 84.91 79.87
Urban 103.52 106.10 97.18 115.30 103.35 134.14
Metropolitan 119.90 137.24 110.13 172.60 100.40 158.38
Region Center 96.82 103.56 94.38 111.66 98.85 112.53
Northeast 75.44 64.56 83.55 61.35 78.42 72.28
North 98.81 93.54 91.84 99.57 102.28 109.43
Southeast 113.14 126.88 108.91 114.84 107.32 121.22
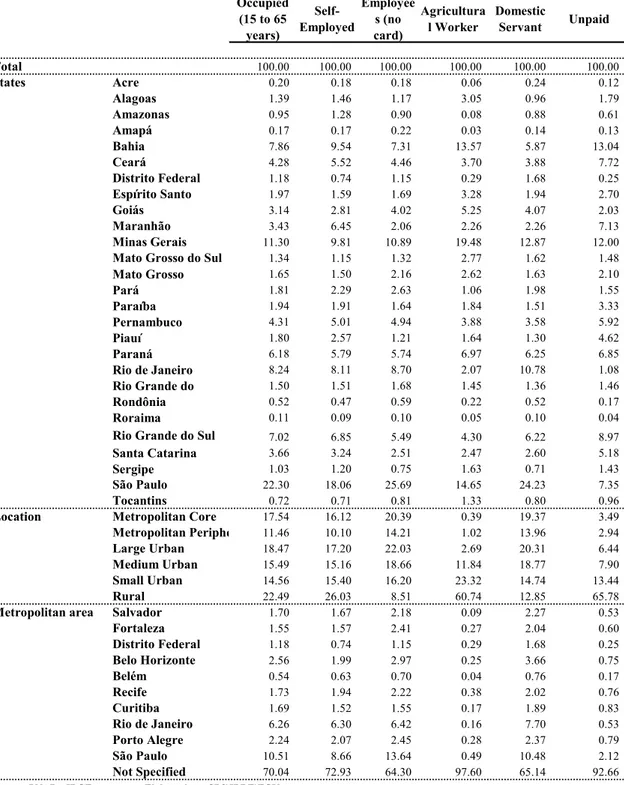
c. Where are informal workers located?
We present below tables with the spatial distribution of the absolute number and the
vertical composition of the population occupied in the informal sector. The geographical
attributes used are states, city sizes and metropolitan areas. When we use city size we see
that the share of informal sector jobs excedes occupied population shares in rural areas
(31.6% and 24.55, respecively) and small cities (15.1%, 14.6%). The opposite occurs in
larger cities: medium cities (14.2%, 15.2%), larger non metropolitan cities (15.7%, 17.8%),
WORKER PROFILE - 1999 POPULATION
BRAZIL
Occupied (15 to 65 years) Self-Employed Employees (no card) Agricultural Worker Domestic Servant Unpaid
Total 66,242,712 15,393,123 7,357,919 4,304,947 5,061,841 7,435,826
States Acre 130,083 27,449 13,072 2,614 12,090 8,823
Alagoas 922,185 224,037 86,343 131,505 48,537 133,189
Amazonas 626,166 197,410 66,212 3,590 44,664 45,068
Amapá 113,574 26,560 16,075 1,400 7,338 9,780
Bahia 5,205,136 1,467,835 537,679 584,220 297,168 969,488
Ceará 2,838,054 849,979 327,891 159,142 196,349 573,804
Distrito Federal 784,129 113,388 84,769 12,439 84,987 18,455
Espírito Santo 1,304,907 244,822 124,182 141,349 98,443 200,404
Goiás 2,080,279 433,269 295,906 226,071 206,206 150,602
Maranhão 2,272,764 993,468 151,564 97,209 114,506 530,498
Minas Gerais 7,484,522 1,510,048 801,065 838,392 651,414 891,972
Mato Grosso do Sul 889,163 176,480 97,409 119,261 81,972 110,249
Mato Grosso 1,093,220 231,023 159,234 112,613 82,689 155,835
Pará 1,196,127 352,349 193,285 45,473 100,416 115,399
Paraíba 1,285,170 293,324 120,956 79,126 76,606 247,459
Pernambuco 2,854,387 770,893 363,139 166,871 180,981 440,194
Piauí 1,190,479 395,459 88,902 70,511 65,909 343,862
Paraná 4,091,849 891,926 422,646 300,069 316,294 509,325
Rio de Janeiro 5,457,978 1,248,683 640,421 89,189 545,508 80,165
Rio Grande do Norte 993,579 232,514 123,656 62,554 68,967 108,863
Rondônia 346,901 72,344 43,054 9,529 26,113 12,703
Roraima 75,147 13,293 7,422 2,165 5,259 3,094
Rio Grande do Sul 4,650,086 1,054,088 403,759 185,213 314,992 666,641
Santa Catarina 2,421,899 498,463 184,377 106,437 131,447 385,036
Sergipe 682,681 183,985 55,162 70,156 36,033 106,499
São Paulo 14,772,568 2,780,618 1,890,126 630,472 1,226,533 546,844
Tocantins 479,679 109,416 59,613 57,377 40,420 71,575
Location Metropolitan Core 11,618,139 2,480,607 1,500,112 16,916 980,609 259,652
Metropolitan Periphery 7,589,520 1,554,577 1,045,608 44,047 706,395 218,748
Large Urban 12,235,211 2,647,877 1,620,919 115,938 1,028,083 478,783
Medium Urban 10,258,949 2,332,866 1,372,796 509,560 950,126 587,473
Small Urban 9,641,977 2,371,027 1,192,149 1,003,757 746,031 999,650
Rural 14,898,916 4,006,169 626,335 2,614,729 650,597 4,891,520
Metropolitan area Salvador 1,125,645 257,115 160,659 3,895 114,713 39,597
Fortaleza 1,025,693 240,912 177,293 11,613 103,124 44,628
Distrito Federal 784,129 113,388 84,769 12,439 84,987 18,455
Belo Horizonte 1,698,146 305,719 218,655 10,627 185,256 55,679
Belém 356,212 97,110 51,747 1,524 38,326 12,979
Recife 1,142,839 298,876 163,634 16,368 102,479 56,689
Curitiba 1,121,395 234,406 113,806 7,308 95,539 61,862
Rio de Janeiro 4,145,395 969,039 472,711 6,744 389,517 39,351
Porto Alegre 1,485,436 317,978 180,103 11,944 120,213 59,079
São Paulo 6,961,320 1,332,489 1,003,382 21,046 530,298 157,417
Not Specified 46,396,502 11,226,091 4,731,160 4,201,439 3,297,389 6,890,090
Table 11
WORKER PROFILE - 1999 POPULATION ( % COMPOSITION )
BRAZIL
Occupied (15 to 65 years) Self-Employed Employee s (no card) Agricultura l Worker Domestic Servant Unpaid
Total 100.00 100.00 100.00 100.00 100.00 100.00
States Acre 0.20 0.18 0.18 0.06 0.24 0.12
Alagoas 1.39 1.46 1.17 3.05 0.96 1.79
Amazonas 0.95 1.28 0.90 0.08 0.88 0.61
Amapá 0.17 0.17 0.22 0.03 0.14 0.13
Bahia 7.86 9.54 7.31 13.57 5.87 13.04
Ceará 4.28 5.52 4.46 3.70 3.88 7.72
Distrito Federal 1.18 0.74 1.15 0.29 1.68 0.25
Espírito Santo 1.97 1.59 1.69 3.28 1.94 2.70
Goiás 3.14 2.81 4.02 5.25 4.07 2.03
Maranhão 3.43 6.45 2.06 2.26 2.26 7.13
Minas Gerais 11.30 9.81 10.89 19.48 12.87 12.00
Mato Grosso do Sul 1.34 1.15 1.32 2.77 1.62 1.48
Mato Grosso 1.65 1.50 2.16 2.62 1.63 2.10
Pará 1.81 2.29 2.63 1.06 1.98 1.55
Paraíba 1.94 1.91 1.64 1.84 1.51 3.33
Pernambuco 4.31 5.01 4.94 3.88 3.58 5.92
Piauí 1.80 2.57 1.21 1.64 1.30 4.62
Paraná 6.18 5.79 5.74 6.97 6.25 6.85
Rio de Janeiro 8.24 8.11 8.70 2.07 10.78 1.08
Rio Grande do 1.50 1.51 1.68 1.45 1.36 1.46
Rondônia 0.52 0.47 0.59 0.22 0.52 0.17
Roraima 0.11 0.09 0.10 0.05 0.10 0.04
Rio Grande do Sul 7.02 6.85 5.49 4.30 6.22 8.97
Santa Catarina 3.66 3.24 2.51 2.47 2.60 5.18
Sergipe 1.03 1.20 0.75 1.63 0.71 1.43
São Paulo 22.30 18.06 25.69 14.65 24.23 7.35
Tocantins 0.72 0.71 0.81 1.33 0.80 0.96
Location Metropolitan Core 17.54 16.12 20.39 0.39 19.37 3.49
Metropolitan Periphe 11.46 10.10 14.21 1.02 13.96 2.94
Large Urban 18.47 17.20 22.03 2.69 20.31 6.44
Medium Urban 15.49 15.16 18.66 11.84 18.77 7.90
Small Urban 14.56 15.40 16.20 23.32 14.74 13.44
Rural 22.49 26.03 8.51 60.74 12.85 65.78
Metropolitan area Salvador 1.70 1.67 2.18 0.09 2.27 0.53
Fortaleza 1.55 1.57 2.41 0.27 2.04 0.60
Distrito Federal 1.18 0.74 1.15 0.29 1.68 0.25
Belo Horizonte 2.56 1.99 2.97 0.25 3.66 0.75
Belém 0.54 0.63 0.70 0.04 0.76 0.17
Recife 1.73 1.94 2.22 0.38 2.02 0.76
Curitiba 1.69 1.52 1.55 0.17 1.89 0.83
Rio de Janeiro 6.26 6.30 6.42 0.16 7.70 0.53
Porto Alegre 2.24 2.07 2.45 0.28 2.37 0.79
São Paulo 10.51 8.66 13.64 0.49 10.48 2.12
Not Specified 70.04 72.93 64.30 97.60 65.14 92.66
d. Are the poor more informal?
Graphs below presents correlations between labor markets outcomes using
mesoregions values calculated from PNAD as the basic unit of observtion. present clear
evidence on the inverse relationship between per capita family income and informality rates
(captured here by adding employees without card, self-employed and unpaid workers
share). There is also a negative relationship between informality rates and unemployment
rates. In general, the data is consistent with the idea that unemployment is a luxury bad
while informality is a basic bad.
Graph 1 Graph 2
3. Dynamics of the informal sector
This section attempts to generate and organize stylized facts of self-employment and
activities dynamics in Brazil. The final purpose is to help the design of policies to assist
micro-entrepreneurial activities in Brazil. The main questions pursued are: i) what is
relative importance among the self-employed of subsistence activities versus those
activities with growth and capital accumulation potential? ii) what are the main
determinants of micro-entrepreneurial success? iii) what are the main constraints on poor
entrepreneurs activities? iv) what is the degree of risk associated with micro-entrepreneurial
activities in Brazil and how to design policies to cope with this risk?
Our main tool of analysis are transitional data constructed from household surveys.
The longitudinal information covers three transition horizons: 1 month, 12 months and
5-Per Capita Family Income from All Sources Unemployment Rate
Vs. Informality Rate Vs. Informality Rate
(Data in Logs) (Data in Logs)
Coeficient : -1.2756 t-statistic : -17.42 R2 : 0.6921 Coeficient : -0.3334 t-statistic : -9.919 R2 : 0.4216
-4.75 -4.5 -4.25 -4 -3.75 -3.5 -3.25 -3 -2.75 -2.5 -2.25 -2 -1.75
-1.5 -1.25 -1 -.75 -.5 -.25
-1. 6 -1.5 -1.4 -1.3 -1.2 -1.1 -1 -.9 -.8 -.7 -.6 -.5 -. 4 -. 3 -.2