Methylmercury in
fi
sh species used in preparing
sashimi
: A case study
in Brazil
Esther Lima de Paiva
a,*, Raquel Fernanda Milani
a, B
arbara Sia Boer
a,
K
esia Diego Quintaes
b, Marcelo Antonio Morgano
aaInstitute of Food Technology (ITAL), PO Box 139, 13070-178, Campinas, SP, Brazil
bNutrition School, Federal University of Ouro Preto (UFOP), 35400-000, Ouro Preto, MG, Brazil
a r t i c l e
i n f o
Article history:
Received 11 March 2017 Received in revised form 17 April 2017
Accepted 19 April 2017 Available online 20 April 2017
Keywords: Sashimi
Needlefish Health risk Methylmercury
Target hazard quotient (THQ)
a b s t r a c t
The objective of this work was to determine the organic and total mercury contents in twelvefish species used in preparingsashimiin Japanese restaurants and estimate the exposure to organic mercury due to the consumption of this food. The mercury species were quantified by atomic absorption with thermal decomposition and amalgamation. Total mercury was analyzed directly, whereas organic mercury was quantified after extraction with toluene in an acid medium using a microwave assisted system. Nee-dlefish and tuna showed the highest levels of mercury species and salmon and mullet the lowest levels. The mean ratios between MeHgþ/total Hg were 93% and 87% for sandperch and octopus, respectively, indicating that the most toxic form (organic Hg) predominates in these species. Exposure to methyl-mercury was estimated based on the PTWI and the results showed that the ingestion of 2 portions of needlefish and tuna exceeded the values established by 100%.
©2017 Elsevier Ltd. All rights reserved.
1. Introduction
Fish consumption has grown exponentially throughout the world in a search for healthier foods and improved quality of life. In a human diet they are one of the best sources of high-quality protein and of other nutrients such as selenium, antioxidants and essential fatty acids of the
u
3 series (Costa et al., 2015; Galimberti et al., 2016).Recent surveys have shown that dishes based on rawfish are more and more accessible in common and specialized restaurants, buffets and sushi bars. However, the ingestion offish and derived products is considered to be the main source of mercury for human exposure (Barone et al., 2015; Costa et al., 2015). The consumption of raw fish such as sashimi can significantly influence the final concentration of ingested mercury, thus, is important to obtaining data concerning the ingestion and exposure to the species of mercury present in culinary dishes based on raw fish (Migueis, Santos, Saraiva,&Esteves, 2015).
The predominant organic mercury form found infish is meth-ylmercury (MeHgþ), which is highly toxic, and can show the
potential to bioaccumulation throughout the food chain (Eisler, 2000). Exposure to MeHgþ
can cause adverse effects on the ner-vous system and also compromise brain development in fetuses. The compound is also able to cross the placental barrier and establish itself in the blood cells, nerve endings and muscle tissues of fetuses. In 2001 the Food and Drug Administration (FDA) issued an alert destined for pregnant and/or breastfeeding women to reduce their consumption offish such as swordfish, needlefish and dogfish, which, due to their mercury contents, could compromise the development of normal cognition in fetuses and children (FDA, 2001a). In 2002 the FDA recommended that the alert was extended to the consumption of tuna (CAC, 2015).
Toxic metal contaminants such as mercury can be classified as carcinogenic or non-carcinogenic. Recently studies on contamina-tion by toxic metals have intensified and different methods to evaluate the potential health risk have been proposed. Evaluation of the Target Hazard Quotient (THQ) has been applied to risk evalu-ation studies (Wang, Sato, Xing,&Tao, 2005), providing indications
of the risk associated with exposure to a non-carcinogenic contaminant, with qualitative information concerning an adverse effect. This method was applied with success byChien et al. (2002)
in a study concerning the contaminants arsenic, cadmium, copper and zinc in oyster samples collected in the coastal region of Taiwan, and was also applied in the present study.
*Corresponding author.
E-mail address:[email protected](E.L. de Paiva).
Contents lists available atScienceDirect
Food Control
j o u r n a l h o m e p a g e : w w w . e l s e v i e r . c o m / l o c a t e / f o o d c o n t
A quantitative method frequently used to evaluate the risk arising from exposure to contamination from the consumption of mercury species is based on the calculation of the Provisional Tolerable Weekly Ingestion (PTWI). In 2000 the value established by JECFA for the general population was 3.3
m
g kg 1b.w. (bodyweight), making provisions for developing children and fetuses since they are more sensitive to MeHgþ(WHO, 2000). Subsequently the value for PTWI was reduced to 1.6
m
g kg 1b.w., this value beingconsidered safe for the health of the population (WHO, 2004). For quantification, the analytical methods most used to deter-mine MeHgþuse liquid or gas chromatographic techniques coupled to highly sensitive and selective detectors such as atomic absorp-tion spectrometry (AAS) (Martorell et al., 2011), atomic fl uores-cence spectrometry (AFS), atomic emission detection spectrometry (Kuballa, Leonhardt, Schoeberl,&Lachenmeier, 2009) and
induc-tively coupled plasma mass spectrometry (ICP-MS) (Pastorelli et al., 2012). Thermal decomposition and amalgamation atomic absorp-tion spectrometry (TDA AAS) has been used to quantify the total mercury content (Morgano, Milani,&Perrone, 2015).
Thus the objectives of the present work were: i) determine the organic and total mercury contents using the TDA AAS technique in twelvefish species used in the preparation ofsashimi; ii) determine the organic mercury: total mercury ratio in the differentfish spe-cies; iii) estimate the risk of exposure to MeHgþby consuming
fish, using qualitative (THQ) and quantitative (PTWI) methods.
2. Materials and methods
2.1. Samples
A total of 50 small portions of rawfilletedfish commercialized as sashimi, prepared using the 12 different species of fish most commonly used to elaborate this dish in Japanese restaurants located in the southeastern region of Brazil (City of Campinas, State of S~ao Paulo) were acquired. The species studied were: tuna (Thunnus thynnus, n ¼5), salmon (Salmo salar, n¼ 5), octopus (Octopus vulgaris, n¼5), mullet(Mugil platanus, n¼5), black an-chovy(Ruvettus pretiosus, n¼5), barracuda (Boulengerella maculata n¼5), amberjack(Seriola lalandi, n¼2), goldenfish(Coryphaena hippurus, n¼3),and some species of whitefish such as sea bass (Centropomus sp., n¼5), needlefish(Strongylura marina, n¼3), swordfish(Trichiurus lepturus, n¼4)and sandperch(Pseudopercis numida, n¼3).Fig. 1shows the probable origin of thefish species evaluated in the present study.
The origin of most of the species was in the southeastern and southern regions of the Atlantic coast, especially in the states of Rio de Janeiro, Rio Grande do Sul, S~ao Paulo, Santa Catarina and Espírito Santo. The states of Maranh~ao and Amazonas on the northern coast, contributed with the mullet, sea bass and barracudafish, and the origin of the salmon was exclusively from the Pacific coastline, Chile being the main representative.
The samples were ground separately according to species, using a domestic processor to obtain a homogenous mass, and stored frozen ( 18C) until analyzed. The mean weight obtained experi-mentally for thesashimi portions was 100 g, corresponding to 4 units (fillets) offish. The mean standard size of the slices was 2.5 cm wide, 4 cm long and 0.5 cm thick. The total and organic mercury were determined in triplicate.
2.2. Reagents and standards
Only analytical grade reagents were used in this study. The water (18.2 M
U
cm) was purified by reverse osmosis (Gehaka, S~aoPaulo, Brazil) and the nitric acid in a sub-boiling distiller (Dis-tillacid, Berghof, Eningen, Germany). Toluene (Synth, Diadema,
Brazil) and a 30% HCl solution (Merck, Darmstadt, Germany) were used for the extractions carried out by microwaves. A 2.5% L -cysteine solution (Sigma, Steinheim, Germany) was prepared to stabilize the organic mercury species. The analytical curves were constructed using certified 1.000 mg L 1standard mercury solu-tions (Fluka, Sigma Aldrich, Steinheim, Germany) together with a 0.5% HNO3solution (v/v).
2.3. Instrumentation
The total and organic mercury contents in thesashimisamples were quantified by TDA AAS using a direct mercury analyzer (DMA-80, Dual Cell, Milestone, Sorisole, Italy). The samples were sub-mitted to an initial heating step and subsequent determination of the mercury in an amalgamator containing gold.
2.4. Determination of total mercury and extraction of organic mercury (MeHg)
2.4.1. Determination of total mercury
The instrumental conditions used to determine total mercury (tHg) by TDA AAS were established based on the study developed byMorgano et al. (2015): drying at 200C for 60s; decomposition at 600C for 180s, desorption at 850C and detection at 253.7 nm. The homogenized samples were weighed into nickel recipients (60e100 mg for thefish species) for the subsequent determination
of tHg.
2.4.2. Extraction of organic mercury (MeHg)
Organic mercury (MeHgþ) was determined using a closed microwave-assisted extraction system as described byPaiva et al. (2016): 1 g of sample was weighed into a Teflon PFA recipient fol-lowed by the addition of 8 mL toluene pa, 1 mL of demineralized
water and 0.75 mL of a 30% HCl solution (v/v). The analytical con-ditions of the microwave extractor were: 1000 W power applied; (A) heating ramp to 110C in 10 min; (B) temperature constant at 110C for 5 min.
After extraction, a 4 mL aliquot of the organic phase was transferred to a centrifuge tube containing 2 mL of a 2.5%L-cysteine solution (m/v) and the mixture centrifuged at 3500 rpm for 6 min. A 100 mg portion of theL-cysteine phase was weighed into a quartz recipient and the mercury content determined in a DMA-80 analyzer. The optimized instrumental conditions for the determi-nation of organic mercury were: drying of sample at 120C for 60s; decomposition at 300C for 180s; desorption at 850C for 12s; and the absorbance determined at 253.7 nm. The detection ranges for the two cells of the equipment were: 0.5e20
m
g kg 1 and20e1000
m
g kg 1.2.5. Estimation of methylmercury exposure
Two parameters were considered to evaluate the potential risk of exposure to methylmercury: the Target Hazard Quotient (THQ) (Chien et al., 2002) and the Provisional Tolerable Weekly Ingestion (PTWI) (MeHgþ
¼1.6
m
g kg 1bw) (CAC, 2015).The methodology used to estimate THQ is described byUS EPA (2007a), as from which calculations were carried out to evaluate the risk considering the following equation described byChien et al. (2002). This index indicates the ratio between exposure and the reference dose and includes not only intake of metals but other significant data, as exposure frequency and duration, meal size, body weight and the oral reference dose. The equa-tion is expressed as follows:
THQ¼ EfEdIrC
RfDoBWAT10
3 (1)
where Ef is the exposure frequency (365 days/year); Ed is the duration of exposure (71 years for men and 78.6 years for women according to data of the Brazilian Institute of Geography and Sta-tistics) (IBGE, 2013); Ir is thefish ingestion rate (g/person/day); C is the MeHgþconcentration in the
fish (
m
g kg 1); Rf Do is the oralreference dose (mg/kg/day); BW is the body weight for adults (60 kg) and children (15 kg); AT is the mean exposure time to non-carcinogenic contaminants (365 days/year x years of exposure: 71 and 78.6 years for men and women, respectively); and 10 3is the unit conversion factor (Wang et al., 2005).
A THQ<1 signifies that the level of exposure is less than that of the reference dose. It is thus presumed that the daily exposure to this level does not cause any negative effects to the health throughout the entire life of a human population (Barone et al., 2015). THQ values between 1 and 5 indicate that the consumers are already exposed to risks which could cause damage to the health, whilst THQ values above 5 denote a significant potential for risk to the health due to contaminant exposure (Wang et al., 2005).
The estimated exposure to organic mercury as a function of PTWI was calculated as follows:
Estimated methylmercury exposure¼[MeHgþ] x (portion/body weight); where [MeHgþ] (mean and interval of concentration,
m
gkg 1); portions of 100 g and 20 g ofsashimiwere considered for adults of 60 kg and children of 15 kg, respectively. Hence the esti-mated exposure to MeHgþis given in
m
g kg 1bw 1.The maximum tolerable number of portions per week for adults and children was indicated by values above 100% for PTWI.
% PTWI¼100(Estimated exposure to methylmercury)/(MeHgþ
PTWI); (2)
where MeHgþPTWI¼1.6
m
g kg 1bw 1(CAC, 2015).2.6. Statistical analysis
The mean results were evaluated for significance using one-way analysis of variance (one-way ANOVA) and Tukey’s test, using XLSTAT software (Addinsoft, France).
3. Results and discussion
3.1. Analytical characteristics
The figures showing the accuracy, precision, linearity of the analytical curves, detection limits and quantification limits were evaluated according to INMETRO (2011). The accuracy of the methods used to determine total and organic mercury was verified using certified reference materials for total (fish proteine NCR
DORM-4) and organic (fish protein e NCR DORM-4 and oyster
tissueeNIST SRM 1566b) mercury, the recovery values obtained
being: 97± 14% for total mercury (DORM-4) and 94± 6% and 111± 2% for methylmercury (DORM-4 and NIST SRM 1566b). The precision of the method was evaluated by the coefficient of varia-tion (16 analytical repetivaria-tions) obtaining values of 5.5% and 9.0%, respectively for total and organic mercury. The analytical curves for the determination of mercury presented linearity in the ranges from 0.5 to 20
m
g kg 1and from 20 to 1000m
g kg 1(R>0.999). The limits of detection (LOD) and of quantification (LOQ) for organic and total mercury were: LOD (3s)¼2.0 and 0.40m
g kg 1; LOQ(10s)¼6.6 and 1.4
m
g kg 1, respectively;“s”being the value of thestandard deviation for the concentrations of ten repetitions.
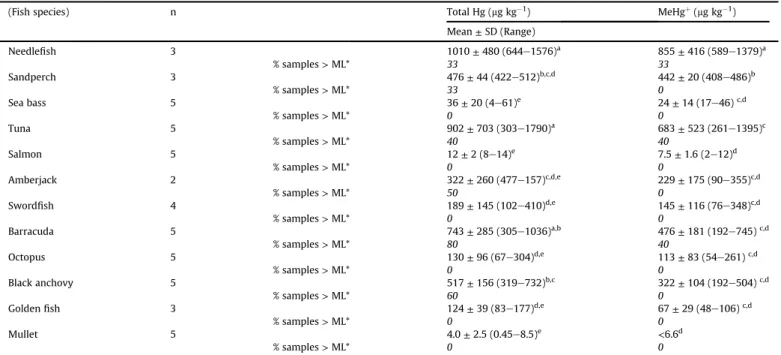
3.2. Results obtained for total mercury and methylmercury in sashimi
Table 1shows the results obtained for tHg and MeHgþ in the differentfish species used in the preparation ofsashimi. Different concentrations of total and organic mercury were found amongst the 12fish species studied. The species that presented the highest mean contents of tHg and MeHgþ
were: needlefish (1010
m
g kg 1and 855
m
g kg 1); tuna (902m
g kg 1and 683m
g kg 1); barracuda(743
m
g kg 1 and 476m
g kg 1) and anchovy (517m
g kg 1 and322
m
g kg 1), respectively.The contents obtained for total and organic mercury in the differentfish species were in the following order: needlefish>tuna
>barracuda> anchovy>sandperch>amberjack>swordfish>
octopus > goldenfish > sea bass >salmon > mullet. Statistical analysis was performed between mercury and methylmercury levels in thefish species in order to verify significant difference among them. The fish species needlefish and tuna were those presenting the greatest contents of total mercury. Regarding methylmercury, high amounts were observed for needlefish, sandperch and tuna. Those mentioned mercury levels presented significant difference from othersfish species (Table 1).
species predominate, is less polluted and has a lower concentration of methylating bacteria.
The World Health Organization (CAC, 2015) established maximum limits for MeHgþof 1 mg kg 1for predatory
fish and 0.5 mg kg 1for non-predatory
fish. In the present study, the species needlefish and tuna presented values varying from 589 to 1379
m
g kg 1and 261e1395m
g kg 1, respectively, contents abovethe established levels. The MeHgþ
levels observed could be asso-ciated with the characteristics of these fish (predatory fish), showing a greater tendency to accumulate mercury.
For the non-predatory species such as barracuda and black an-chovy, MeHgþcontents above the maximum limit established by the CODEX committee for Food Contaminants (CAC, 2015) of 0.5 mg kg 1 were found, with intervals between 192 and 745
m
g kg 1and 192 and 504m
g kg 1, respectively. Fish species suchas sandperch, amberjack and swordfish showed MeHgþ values below the maximum permitted limit, and even lower values were observed for MeHgþamongst the samples of sea bass, salmon and mullet, with respective mean values of 29
m
g kg 1, 7m
g kg 1andnot detected. For the species mullet, total mercury contents varying between 0.45 and 8.5
m
g kg 1were found and the MeHgþlevels,were below the quantification limit of the method (6.6
m
g kg 1).To evaluate the proportion of organic mercury present in the
fish species used in the elaboration ofsashimi, the ratios (%) be-tween the organic and total mercury contents were calculated, and the results are presented in Fig. 2. The sashimi elaborated with sandperch showed the highest MeHgþ/tHg ratio with a value of 93%, and thesashimisamples made with octopus and needlefish also showed elevated MeHgþ/tHg ratios of 87% and 85%, respec-tively. With respect to the octopussashimi, the result obtained in
Table 1
Total and MeHgþ
levels (mg kg 1) observed in sashimifish species.
(Fish species) n Total Hg (mg kg 1) MeHgþ(mg kg 1)
Mean±SD (Range)
Needlefish 3 1010±480 (644e1576)a 855±416 (589e1379)a
% samples>ML* 33 33
Sandperch 3 476±44 (422e512)b,c,d 442±20 (408e486)b
% samples>ML* 33 0
Sea bass 5 36±20 (4e61)e 24±14 (17e46)c,d
% samples>ML* 0 0
Tuna 5 902±703 (303e1790)a 683±523 (261e1395)c
% samples>ML* 40 40
Salmon 5 12±2 (8e14)e 7.5±1.6 (2e12)d
% samples>ML* 0 0
Amberjack 2 322±260 (477e157)c,d,e 229±175 (90e355)c,d
% samples>ML* 50 0
Swordfish 4 189±145 (102e410)d,e 145±116 (76e348)c,d
% samples>ML* 0 0
Barracuda 5 743±285 (305e1036)a,b 476±181 (192e745)c,d
% samples>ML* 80 40
Octopus 5 130±96 (67e304)d,e 113±83 (54e261)c,d
% samples>ML* 0 0
Black anchovy 5 517±156 (319e732)b,c 322±104 (192e504)c,d
% samples>ML* 60 0
Goldenfish 3 124±39 (83e177)d,e 67±29 (48e106)c,d
% samples>ML* 0 0
Mullet 5 4.0±2.5 (0.45e8.5)e <6.6d
% samples>ML* 0 0
*Samples above establish maximum limit (ML) by Brazilian legislation (RDC 42/ANVISA, 2013): 0.5mg kg 1of total Hg forfish and 1.0mg kg 1for predatoryfish. The same
levels were established for MeHgþ
, according to CODEX (CAC, 2015).
Values followed by different letters on the same column differ significantly by the Tukey test (p0.05).
Needle
fish
Sandperch Sea bass Tuna
Salmon
Amberjack Sword
fish
Barracuda Octopus
Black anchovyGolden
fish
0 20 40 60 80 100 120
Organic Hg Inorganic Hg
Hg
(%
)
the present study was comparable with that observed by
Raimundo, Carlos Vale, Canario, Vasco Branco, and Moura (2010), who found values varying between 70 and 99%. With respect to the tuna sashimi, Storelli, Stuffler, and Marcotrigiano (2002) found values for the MeHgþ/tHg ratio of between 77 and 100%, whilst Burger et al. (2013)found mean values of 90%. A value of 77% was found in the present work, in agreement with the values found by
Storelli et al. (2002).
According to the literature data the comparison of total and organic Hg is presented inTable 2. Torres-Escribano, Calatayud, et al. (2010) and Torres-Escribano, Velez, and Montoro (2010)
found higher values for the MeHgþ/tHg ratio (89%) in sword
fish sashimithan those found in the present study (77%), and for an-chovy,Martorell et al. (2011)found an MeHgþ/tHg ratio of 93%, as against 64% found in the present study. For goldenfishsashimia value of 54% was observed in the present study, but to the best of the authors’knowledge, studies found in the literature with this
fish species only reported the data for tHg. For salmonsashimia value for the MeHgþ
/tHg ratio of 63% was found in the present study, inferior to those reported in the liter-ature: Chung, Kwong, Tang, Xiao, and Ho (2008)found a mean value of 74%;Costa et al. (2015)observed a valor of 82%; and the group ofMartorell et al. (2011)found a mean proportion of 100%. For amberjacksashimia higher MeHgþcontent was found in the present study as compared to data available in the literature (71% for the MeHgþ/tHg ratio), whereasGibi
car et al. (2009)reported a value of 61%. The mulletsashimipresented MeHgþcontents below
the quantification limit of the method (6.6
m
g kg 1), and hence theMeHgþ/tHg ratio for this species could not be represented inFig. 2. However,Chung et al. (2008)obtained a mean ratio of 64%.
According to Forsyth, Casey, Dabeka, and McKenzie (2004), factors related to the origin of the fish, location where fished, environmental conditions and anthropogenic activities could be associated with the availability of mercury in the environment, and consequently different proportions between the mercury species can be observed in thefish.
The MeHgþ and total mercury levels observed in the present study were in agreement with those of other authors:Forsyth et al. (2004)found MeHgþlevels varying from 61 to 1303
m
g kg 1in tunasamples coming from Canada; Storelli’s group (2002) evaluated different tuna species (Thunnus alalunga) and(Thunnus thynnus) obtained from the Adriatic and Ionian seas, and obtained mean values of 430
m
g kg 1for MeHgþ; whereas samples of tunasashimicollected from the New Jersey region (USA) presented mean values of 442
m
g kg 1for the organic mercury species (Burger, Gochfeld, Jeitner, Donio,&Pittfield, 2013).Hosseini, Mohammad, Nabavi, and Parsa (2013)studied preda-tory species of needlefish from the Persian Gulf and reported total mercury contents of 50e710
m
g kg 1,whereas in the present studythe results varied from 644 to 1576
m
g kg 1for total mercury andfrom 589 to 1379
m
g kg 1for MeHgþ.In general the values obtained in the present study for the total Hg and MeHgþcontents of sword
fish were similar to those found in studies carried out in otherfishing areas: values between 638 and
Table 2
Comparison of total and organic Hg results for differentfish species used forsashimidishes (mean values or range and literature reference).
Fish specie n Total Hg (mg kg 1) MeHgþ(mg kg 1) Literature reference
Mean or (Range) Mean or (Range)
Swordfish 9 (638e3845) (486e1492) Forsyth et al., 2004
27 (170e1720) (160e1530) Torres-Escribano, Calatayud, et al., 2010;
Torres-Escribano, Velez, et al., 2010
6 (1025e1700) e Cortes&Fortt, 2007
10 529 e Pastorelli et al., 2012
11 540 e Olmedo et al., 2013
4 (102e410) (76e348) Present study
Tuna 8 (77e2121) (61e1303) Forsyth et al., 2004
33 491 442 Burger et al., 2013
5 840 800 Storelli et al., 2002
5 (303e1790) (261e1395) Present study
Salmon 3 34 25 Chung et al., 2008
25 28 23 Costa et al., 2015
24 10 10 Martorell et al., 2011
5 12 7,5 Present study
Amberjack 200 301 184 Gibicar et al., 2009
2 322 230 Present study
Needlefish 3 (50e710) e Hosseini et al., 2013
3 (644e1576) (601e1336) Present study
Sandperch 1 454 e Morgano et al., 2014
3 476 442 Present study
Sea bass 4 1700 e Farias et al., 2005
5 36 29 Present study
Barracuda 7 (303e2129) e Bastos et al., 2008
5 (305e1036) (192e745) Present study
Octopus 12 (130e760) (110e750) Raimundo et al., 2010
1 443 e Bonsignore et al., 2013
5 20 e Galimberti et al., 2016
5 (67e304) (54e261) Present study
Black anchovy 24 140 130 Martorell et al., 2011
5 517 332 Present study
Goldenfish 20 (26e90) e Sellanes et al., 2002
385 (12e550) e Adams, 2009
57 (10e490) e Cai et al., 2007
3 (83e177) (48e106) Present study
Mullet 3 14 9 Chung et al., 2008
3845
m
g kg 1were found byForsyth et al. (2004)for total mercuryand from 486 to 1492
m
g kg 1for MeHgþin samples acquired inCanadian markets; the group ofTorres-Escribano, Calatayud, et al. (2010) and Torres-Escribano, Velez, et al. (2010), who studied swordfish acquired from the Spanish coast obtained total mercury contents varying from 170 to 1720
m
g kg 1 and MeHgþcontentsfrom 160 to 1530
m
g kg 1;Cortes and Fortt (2007)observed meanlevels of 1362
m
g kg 1for total mercury in samples obtained on theChilean coast, whereasPastorelli et al. (2012)and Olmedo et al. (2013)found mean contents of 529
m
g kg 1and 540m
g kg 1forfish from Italy and Spain, respectively.
With respect to the species barracuda, similar concentrations of total mercury were reported byBastos, Rebelo, Fonseca, Almeida, and Malm (2008) in a study carried out in the Amazon basin, with values varying from 303 to 2129
m
g kg 1. For the speciesan-chovy,Martorell et al. (2011)found contents of total and organic mercury of 140
m
g kg 1and 130m
g kg 1, values below those foundin the present work of 517
m
g kg 1and 322m
g kg 1, respectively. Kuballa, Moellers, Schoeberl, and Lachenmeier (2011)in their study to assess methylmercury infish and seafood from the southwestern German market verified close values to those of this work for the anchovy, with the oHg/tHg ratio obtained of 53%. Distinct values for concentration can be attributed to differentfishing areas, deter-mined geographically by the FAOfishing areas. According to this division, thefish samples used in the present work come from the Southeast Atlantic, whereas those in the study ofMartorell et al. (2011)were from the Northeast Atlantic.Although there is not a large volume of data available in the literature concerning the sandperch,Morgano, Rabonato, Milani, Miyagusku, and Quintaes (2014)analyzed the total mercury con-tent in samples from the southeast coast of Brazil, obtaining mean values of 454
m
g kg 1. In the present study the total mercury andMeHgþcontents were determined in 3 samples ofsashimiof this
fish and the mean contents obtained were 476
m
g kg 1 and442
m
g kg 1, respectively.To the best of the authors’knowledge, there is little data avail-able in the literature with respect to the presence of MeHgþin octopus. In the study carried out byRaimundo et al. (2010) to determine the mercury species in octopus from the Portuguese coast, significant levels of total mercury (130e760
m
g kg 1) andMeHgþ (110
e750
m
g kg 1) were encountered.Bonsignore et al. (2013) found medium values of 443m
g kg 1 of total mercury,whereasGalimberti et al. (2016)found 20
m
g kg 1 for the samespecies of mercury in the south and north regions of Italy, respectively.
The sea bass samples analyzed in the present study presented low values of total mercury and MeHgþ, namely 36
m
g kg 1and29
m
g kg 1, respectively. On the other hand,Farias, Azevedo, Favaro, and Braga (2005) observed high levels of total mercury (1700m
g kg 1, on average) in samplesfished in the Bay of Santos,Brazil, but since this fish is not predatory, the elevated mercury content could be related principally to the localization of the es-tuary, just below the industrial complex of Cubat~ao, which is a direct, primary receptor of contaminated effluents.
With respect to samples with low Hg contents such as the goldenfish, values of 26 and 90
m
g kg 1 of total mercury werefound bySellanes et al. (2002)in samples collected on the Rio de Janeiro State coast, Brazil.Adams (2009)reported total mercury levels of between 12 and 550
m
g kg 1in samples from the southeastcoast of the USA, whereasCai, Rooker, Gill, and Turner (2007) ob-tained minimum values of 10
m
g kg 1 and maximum values of490
m
g kg 1infish from the northern region of the Gulf of Mexico.In the present study, the golden fish samples collected in the southeast of Brazil presented total mercury and MeHgþ
contents varying from 83 to 177
m
g kg 1 and from 48 to 106m
g kg 1,respectively.
The species mullet presented the lowest concentration of total mercury.Chung et al. (2008)found mean values of 14
m
g kg 1fortotal mercury and 9
m
g kg 1 for MeHgþ in mullet samplescommercialized in China, and in the present study, the mean value obtained for total Hg was 3.9
m
g kg 1and the levels for MeHgþwerebelow the quantification limit of the method (LOD¼6.6
m
g kg 1).Since this species is small, the low Hg contents found could be associated with the correlation existing between the mercury concentration and size of thefish.
Therefore, in the present study, for thefirst time the concen-tration of total mercury and MeHgþwere evaluated in 12 different sashimi samples from different Brazilian regions. Batista, Souza, Souza, and Barbosa (2011)also developed a regional study about arsenic speciation in Brazilian rice.
3.3. Evaluation of the potential risk related to the ingestion of MeHgþ
On considering the metal contents in marine organisms versus human consumption one of the most important aspects to be evaluated is their toxicity. With this objective in mind, different approaches to the estimation of health risks from the consumption of mercury have been proposed. In the food area, the approach most used has been the quantitative comparison with the PTWI values, which represent the amount of the substance that can be ingested during a lifetime without significant risks to the health, and which was defined by a mixed FAO/WHO committee of experts in food additives (JECFA) (WHO, 2008). One approach that has been used in environmental studies to evaluate the potential risk has been the determination of the target hazard quotient (THQ) (USEPA, 2014). This factor consists of a qualitative risk index that compares the levels of ingestion of a contaminant with a standard dose of the reference.
3.3.1. Target Hazard Quotient
The THQ value proposed byUSEPA (2014)is an integrated risk index by comparing the ingestion amount of a pollutant with a standard reference dose and has been widely used in the risk assessment of metals in contaminatedfish (Wang et al., 2005). THQ
<1 signifies that the level of exposure is lower than the reference
dose, which assumes that a daily exposure at this level is not likely to cause any negative health effects during a lifetime in a human population.
Thus, the evaluation exposure risk to MeHgþ
was also carried out as a function of the THQ value, which expresses the ratio be-tween exposure to the contaminant and its respective daily refer-ence dose (DRD). The value used for the DRD of MeHgþ
was 0.1
m
g kg 1day 1(USEPA, 2007a).Fig. 3shows the results obtainedfor THQ using Equation(1)for eachfish species used in thesashimis studied.
The results showed that 42% of thefish samples analyzed had THQ5, that is, they were above the maximum limit for danger, indicating a high risk of the exposure to contamination by the consumption of some of thefish species. Of these, needlefish and tuna stood out with elevated THQ values, followed by sandperch, barracuda and anchovy. Fish of the species amberjack, swordfish, octopus and goldenfish (33% of the samples) presented 1<THQ<5,
denoting a significant risk associated with the consumption of thesefish species. THQ values<1 were only obtained for salmon and sea bass, indicating no potential risk of contamination associ-ated with the MeHgþcontents present in thesesashimis.
species (MeHgþ). The analysis of the target hazard quotient also showed that 10 of the 12fish species used in thesashimisevaluated in this study had THQ values>1.Barone et al. (2015), working with
fish samples from different regions of the Mediterranean Sea, observed THQ values of from 0.74 to 0.8 for mercury in tuna and swordfish, respectively. Although these THQ values were lower than those obtained in the present study, they were still close to 1 (minimum exposure limit).
The results obtained for THQ for thesashimisamples provided evidence of the need to promote consumer consciousness with respect to the ingestion of somefish species andfish-based dishes.
3.3.2. Estimate of the exposition to methylmercury: evaluation of the consumption of sashimi and calculation of the PTWI value
The estimate of the exposure to MeHgþfrom the consumption ofsashimifrom differentfish species was calculated considering the mean weight of asashimi portion determined experimentally as 100 g for adults and estimated as 20 g for children. The calculations were done using PTWI values for MeHgþ
of 1.6
m
g kg 1, consideringthe weight of an adult as 60 kg and that of a child (2e6 years old) as
15 kg, as recommended byFAO/WHO (2011). With the objective of
comparing the values obtained with the PTWI established for MeHgþ, it was considered that this was the main organic mercury species present in the differentfish species evaluated.
Table 3shows the mean MeHgþcontent present in each of the
fish species used to elaborate thesashimis, the value for the % of the PTWI reached by adults and children considering the consumption of onesashimiportion, and the number ofsashimiportions neces-sary to reach 100% of the PTWI for MeHgþ.
The analysis of the values estimated for ingestion showed that somefish species had expressive MeHgþcontents in the portion considered, and consequently contributed significantly to the calculation of the PTWI. Of these,sashimis elaborated with nee-dlefish and tuna presented 86 and 68
m
g kg 1of MeHgþ,respec-tively. The consumption of just 1.1 and 1.4 weekly portions of sashimi made from these fish for adults, or 1.4 and 1.7 weekly portions for children, exceeded the PTWI value established for MeHgþ(1.6
m
g kg 1bw) by 100%.Fish such as sandperch, barracuda and anchovy also presented significant concentrations of the organic mercury species, where the mean consumption of three weekly portions exceeded the value of the PTWI established for MeHgþ for both adults and
THQ <1→ minor health risk ; THQ 1-5→ concerning level; THQ >5→ major health risk
Fig. 3.The estimated target hazard quotient of MeHgþin
fish species used in sashimi preparation.
Table 3
Estimated exposure to MeHgþ
from sashimi consumption portions considering 100% of PTWI, adults of 60 kg and children of 15 kg.
Fish species used inSashimi Adults Children
MeHgþ
(mg kg 1)a % PTWI Sashimiportions to
achieve 100% of PTWI
MeHgþ
(mg kg 1)b % PTWI Sashimiportions to achieve
100% of PTWI
Needlefish 86 89 1.0 17 71 1.4
Sandperch 44 46 2.0 9.0 37 3.0
Sea bass 3.0 0 33 0.6 2.4 41
Tuna 68 71 1.4 13.6 57 1.7
Salmon 0.7 0.7 140 0.14 0.5 175
Amberjack 23 24 4.0 4.6 19 5.2
Swordfish 14 15 6.6 3.0 12 8
Barracuda 48 49.5 2.0 9.5 39 2.5
Octopus 11 12 8.5 2.2 9.4 10.6
Black anchovy 33 34.6 3.0 6.6 27 3.7
Goldenfish 6.7 7 14.2 1.3 5.6 18
Mullet ND<6.6 ND<6.6 e ND<6.6 ND<6.6 e
children by 100%. Infish with smaller MeHgþlevels such as golden
fish, sea bass and salmon, the number of portions necessary to exceed the ingestion limits established were 14.2, 33 and 140 for adults, and 17.8, 41 and 175 for children, in this order, indicating that the consumption of these sashimis presented no potential health risk even when ingested with greater frequency and amounts.
The choice of the fish species used in the elaboration of sashimishould be made with care for those groups of the popu-lation more vulnerable to the toxic effects of the contaminant mercury, such as children and pregnant and/or gestating women. Due to their greater susceptibility to contamination by MeHgþ, the EFSA (European Food Safety Authority) recommends that this category includes a wide variety offish in their diet, and controls the consumption of predatoryfish such as tuna and needlefish (EFSA, 2004a). The results of the present study showed that the sashimis containing the species mullet, salmon, sea bass and golden fish were those presenting the lowest amounts of this contaminant.
In the study carried out byAfonso et al. (2015)involvingfish from the Portuguese coast, it was observed that the monthly con-sumption of 160 g of rawfish (tuna) was associated with a 3%e5%
probability of exceeding the maximum limits established for MeHgþ. According toGrandjean et al. (2010)the organic mercury contents present in fish species are greatly influenced by the distinct environmental conditions such as a contaminated marine habitat and the presence of methylating bacteria.
4. Conclusions
The study showed that thesashimissamples made from nee-dlefish and tuna possessed greater amounts of total and organic mercury, whilst those made from mullet, salmon, sea bass and goldenfish presented the lowest levels. The ratio MeHgþ/tHg was high for all thefish species used in the elaboration ofsashimi, with values above 54%, the highest ratios being obtained for thesashimis from sandperch (93%) and octopus (87%), indicating a predomi-nance of the more toxic mercury form (MeHgþ
). With respect to the estimate of exposure to MeHgþfrom the consumption ofsashimi made using the target hazard quotient (THQ), it was shown that 42% of thefish species presented THQ values5 (among tuna and needlefish) indicating they were above the maximum limit for the danger of exposure. Regarding comparison with values of the provisional tolerable weekly ingestion (PTWI), it was confirmed that the ingestion of 2sashimiportions (100 g) of needlefish or tuna exceeded the maximum values established for adults and children by 100%, whereas for mullet and salmon the contribution to the PTWI was insignificant. Therefore, the qualitative risk assessment index (THQ) and quantitative parameter of comparison (PTWI) confirms a high exposure contamination to some analyzed fish species.
The results presented highlighted the importance of evaluating the exposure to MeHgþ from the ingestion ofsashimi. Frequent consumers (>once a week) should check on the variety offish in the
diet in order to make a conscious choice, especially in the case of consumers belonging to groups at risk such as pregnant women, lactating mothers and children.
Acknowledgements:
The authors acknowledge the financial support from FAPE-SP (process 2012/50667-9) and CNPq (process 442025/2014-9), E. L Paiva acknowledge the fellowship from CAPES (process 23038. 001012/2015-14) and B. S Boer acknowledge the fellowship from CNPq/PIBIC (process 442025/2014-9).
References
Adams, D. H. (2009). Consistently low mercury concentrations in dolphinfish, Coryphaena hippurus, an oceanic pelagic predator.Environmental Research, 109, 697e701.
Afonso, C., Costa, S., Cardoso, C., Bandarra, N. M., Batista, I., Coelho, I., et al. (2015). Evaluation of the risk/benefit associated to the consumption of raw and cooked farmed meagre based on the bioaccessibility of selenium, eicosapentaenoic acid and docosahexaenoic acid, total mercury, and methylmercury determined by an in vitro digestion model.Food Chemistry, 170, 249e256.
Barone, G., Storelli, A., Garofalo, R., Busco, V. P., Nicoletta Cristiana Quaglia, N. P., Centrone, G., et al. (2015). Assessment of mercury and cadmium via seafood consumption in Italy: Estimated dietary intake (EWI) and target hazard quo-tient (THQ).Food Additives and Contaminants, 32, 1277e1286.
Bastos, W. R., Rebelo, M. F., Fonseca, M. F., Almeida, R., & Malm, O. (2008).
A description of mercury infishes from the Madeira River Basin(Vol. 38, pp. 431e438). Brazil: Amazon.
Batista, B. L., Souza, J. M. O., De Souza, S. S., & Barbosa, F. (2011). Speciation of arsenic in rice and estimation of daily intake of different arsenic species by Brazilians through rice consumption.Journal of Hazardous Materials, 191, 342e348. Bonsignore, M. D., Manta, S., Oliveri, E., Sprovieri, M., Basilone, G., Bonanno, A., et al.
(2013). Mercury infishes from Augusta Bay (southern Italy): Risk assessment and health implication.Food and Chemical Toxicology, 56, 184e194.
Burger, J., Gochfeld, M., Jeitner, C., Donio, M., & Pittfield, T. (2013). Sushi con-sumption rates and mercury levels in sushi: Ethnic and demographic differ-ences in exposure.Journal of Risk Research, 16, 1057e1075.
CAC - Codex Alimentarius Commission. (2015).Discussion paper on maximum levels for methylmercury infish. 9 th Session New Delhi, India, 16 e 20 Marchhttp//ftp. fao.org/codex/Meetings/cccf/cccf9/cf09_13e.pdf(Accessed 08 June 2016). Cai, Y., Rooker, J. R., Gill, G. A., & Turner, J. P. (2007). Bioaccumulation of mercury in
pelagicfishes from the northern Gulf of Mexico.Canadian Journal of Fisheries and Aquatic Sciences, 64, 458e469.
Chien, L. C., Hung, T. C., Choang, K. Y., Yeh, C. Y., Meng, P. J., Shieh, M. J., et al. (2002). Daily intake of TBT, Cu, Zn, Cd and as forfishermen in Taiwan.Science of The Total Environment, 285, 177e185.
Chung, S. W. C., Kwong, K. P., Tang, A. S. P., Xiao, Y., & Ho, P. Y. Y. (2008). Mercury and methylmercury levels in the main tradedfish species in Hong Kong.Food Ad-ditives and Contaminants, 1, 106e113.
Cortes, S., & Fortt, A. (2007). Mercury contents in Chileanfish and estimated intake levels.Food Additives and Contaminants, 24, 955e959.
Costa, S., Afonso, C., Cardoso, C., Batista, I., Chaveiro, N., Nunes, M. L., et al. (2015). Fatty acids, mercury, and methylmercury bioaccessibility in salmon (Salmo salar) using an in vitro model: Effect of culinary treatment.Food Chemistry, 185, 268e276.
EFSA (European Food Safety Authority). (2004a). Opinion of the Scientific Panel of Contaminants in the food chain on a request from the commission related to mercury and methylmercury in food.EFSA Journal, 34, 1e14.
Eisler, R. (2000).Mercury, in handbook of chemical risk Assessment: Health hazard to human, plants and animals(Vol. 1, pp. 313e409). Boca Raton, FL: Lewis Pub-lishers. Metals.
FAO/WHO. (2011).Report of the joint expert consultation on the risks and benefits of
fish consumption. Rome: FAO Fishery and Aquaculture Report.
Farias, L. A., Azevedo, J. S., Favaro, D. I. T., & Braga, E. S. (2005).Evaluation of mercury, selenium and methylmercury infish consumed by Santos Bay communities, S~ao Paulo, Brazil. Santos, SP, Brazil: INAC.
FDA (Food and Drug Administration). (2001a).FDA consumer advisory.http://www. cfsan.fda.gov/Bdms/hgpdftoc.html(Accessed 13 June 2016).
Forsyth, D. S., Casey, V., Dabeka, R. W., & McKenzie, A. (2004). Methylmercury levels in predatoryfish species marketed in Canada.Food Additives and Contaminants, 21, 849e856.
Galimberti, C., Corti, I., Cressoni, M., Moretti, V. M., Menotta, S., Galli, U., et al. (2016). Evaluation of mercury, cadmium and lead levels infish andfishery products imported by air in North Italy from extra-European Union Countries.Food Control, 60, 329e337.
Gibicar, D., Horvat, M., Logar, M., Fajon, V., Falnoga, I., Ferrara, R., et al. (2009). Human exposure to mercury in the vicinity of chlor-alkali plant.Environmental Research, 109, 355e367.
Grandjean, P., Satoh, H., Murata, K., & Etoh, K. (2010). Adverse effects of methyl-mercury: Environmental health research implications. Environmental Health Perspectives, 118, 1137e1145.
Hosseini, M., Mohammad, S., Nabavi, B., & Parsa, Y. (2013). Bioaccumulation of trace mercury in trophic levels of benthic, benthopelagic, pelagicfish species, and sea birds from Arvand river, Iran.Biological Trace Element Research, 156, 175e180. IBGE (Instituto Brasileiro de Geografia e Estatística). (2013).Expectativa de vida.
http://teen.ibge.gov.br/noticias-teen/7827-expectativa-de-vida (Acessed 11 June 2016).
INMETRO. (2011). Orientaç~ao Sobre Validaç~ao de Metodos Analíticos. Instituto Nacional de Metrologia, Normalizaçao e Qualidade Industrial. DOQ-CGCRE-008.~ Rev.: 04, 1e20.
Kuballa, T., Leonhardt, E., Schoeberl, K., & Lachenmeier, D. W. (2009). Determination of methylmercury infish and seafood using optimized digestion and derivati-zation followed by gas chromatography with atomic emission detection. Eu-ropean Food Research and Technology, 228(3), 425e431.
methylmercury infish and seafood from the southwestern German market.
European Food Research and Technology, 232(4), 737e742.
Martorell, I., Perello, G., Martí-Cid, R., Llobet, J. M., Castell, V., & Domingo, J. L. (2011). Human exposure to arsenic, cadmium, mercury, and lead from foods in Cata-lonia, Spain: Temporal trend.Biological Trace Element Research, 142, 309e322. Migueis, S., Santos, C., Saraiva, C., & Esteves, A. (2015). Evaluation of ready to eat
sashimi in northern Portugal restaurants.Food Control, 47, 32e36.
Morgano, M. A., Milani, R. F., & Perrone, A. M. (2015). Determination of total mer-cury in sushi samples employing direct mermer-cury analyzer. Food Analytical Methods, 8, 2301e2307.
Morgano, M. A., Rabonato, L. C., Milani, R. F., Miyagusku, L., & Quintaes, K. D. (2014). As, Cd, Cr, Pb and Hg in seafood species used for sashimi and evaluation of dietary exposure.Food Control, 36, 24e29.
Olmedo, P., Pla, A., Hernandez, A. F., Barbier, F., Ayouni, L., & Gil, F. (2013). Deter-mination of toxic elements (mercury, cadmium, lead, tin and arsenic) infish and shellfish samples. Risk assessment for the consumers.Environment Inter-national, 59, 63e72.
Paiva, E. L., Alves, J. C., Milani, R. F., Boer, S. B., Quintaes, K. D., & Morgano, M. A. (2016). Sushi commercialized in Brazil: Organic Hg levels and exposure intake evaluation.Food Control, 69, 115e123.
Pastorelli, A. A., Baldini, M., Stacchini, P., Baldini, G., Morelli, S., Sagratella, E., et al. (2012). Human exposure to lead, cadmium and mercury through fish and seafood product consumption in Italy: A pilot evaluation.Food Additives and Contaminants, 299, 1e9.
Raimundo, J., Carlos Vale, C., Canario, J., Vasco Branco, V., & Moura, I. (2010). Re-lations between mercury, methylmercury and selenium in tissues of Octopus vulgaris from the Portuguese Coast.Environmental Pollution, 158, 2091e2100. Sellanes, A. G., Marsico, E. T., Santos, N. N., Sao Clemente, S. C., Oliveira, G. A., et al.~
(2002). Mercury in marinefish.Acta Scientiae Veterinariae, 30, 107e112.
Storelli, M. M., Stuffler, R. G., & Marcotrigiano, G. O. (2002). Total and methylmer-cury residues in tuna-fish from the Mediterranean Sea.Food Additives and Contaminants, 19, 715e720.
Torres-Escribano, S., Calatayud, M., Ruiz, A., De La Flor, M. T., Devesa, V., Velez, D., et al. (2010). The effect of cooking on mercury bioaccessible contents of pred-atoryfish.Toxicology Letters, 196, 310.
Torres-Escribano, S., Velez, D., & Montoro, R. (2010). Mercury and methylmercury bioaccessibility in swordfish.Food Additives and Contaminants, 27, 327e337.
USEPA - United States Environmental Protection Agency. (2014).Risk-based
con-centrations table[Internet]. [cited 2014 Oct 3]http://www.epa.gov/reg3hwmd/ risk/human/index.htm(Accessed 16 May 2016).
USEPA (United States Environmental Protection Agency). (2007a).Risk-based con-centration table. Philadelphia PA. Washington, DC: United States Environmental Protection Agency.https://cfpub.epa.gov/ncea/iris/iris_documents/documents/ subst/0073.htm(Accessed 10 May 2016).
Wang, X. L., Sato, T., Xing, B. S., & Tao, S. (2005). Health risks of heavy metals to the general public in Tianjin, China via consumption of vegetables andfish.Science of the Total Environment, 1, 28e37.
WHO (World Health Organization). (2000).Safety evaluation of certain food additives and contaminants. WHO Food additives series 44. Lead.http://www.who.int/ipcs/ publications/ehc/ehc_numerical/en(Accessed 09 June 2016).
WHO (World Health Organization). (2004).Safety evaluation of certain food additives and contaminants, WHO. Food Additive Series: 52. Geneva: International Pro-gramme on Chemical Safety, WHO.
WHO (World Health Organization). (2008).Guidance for identifying populations at risk from mercury exposure. Geneva (Switzerland): UNEP Chemicals Branch and
WHO Department of Food Safety, Zoonoses and Foodborne Diseases.http://