A Work Project, presented as part of the requirements for the Award of a Masters
Degree in Management NOVA
–
School of Business and Economics.
CSR practices and Labor
Retention
How can these variables be related?
Claúdia Sofia Dias Costa
#1113
6th January 2013
A Project carried out on the Management course, with the supervision of:
ABSTRACT
Companies offer volunteering activities and training & development for several reasons
but mainly because it is an investment that can have a great impact in one variable with
major importance within every company: labor retention, once socially responsible
companies are likely viewed as better companies to work with and which value more
their employees and their interests and values.
Using survey information collected from 100 business professionals, this exploratory
study proposed that the investment in both company-sponsored volunteering and
training & development will have a positive impact in affective commitment and
organizational identification that as last result will reduce the employees’ turnover
intentions and consequently there will be a higher retention rate of employees in the
company. This is crucial for companies nowadays because it is a competitive advantage
which makes them stand out from others, once these socially responsible companies are
able to keep their employees trained and with values aligned with the ones that
characterize the company, getting positive outcomes from the investment they are
making in human capital.
Using a sample of 65 employees from different industries and roles within the company,
results indicated that these CSR measures have a statistically significant impact on
INTRODUCTION
During the past years, firms have come under increasing pressure to follow socially
responsible behaviors from several stakeholder groups including shareholders,
employees, investors and consumers and they are realizing that having a socially
responsible corporate image is actually a valuable strategic asset.
Nonetheless, besides several studies have shown that firms that perform socially
responsible activities enjoy benefits such as customer satisfaction and favorable
customer evaluations (Luo and Bhattacharya, 2006), the effectiveness of corporate
social responsibility (CSR) activities on internal stakeholders has remained neglected
(Larson et al., 2008).
According to social identity theory corporate social performance may be expected to
contribute positively to the attraction, retention and motivation of employees because
they are likely to identify strongly with positive organizational values (Peterson, 2004).
Earlier work has emphasized the strong relationships that exist between organizational
commitment, labor retention and a variety of work attitudes (Meyer et al., 2002).
Resource based theory suggests that sustained competitive advantage is based on the
attraction, accumulation, and retention of resources that are valuable, difficult to
substitute and hard to imitate (Hart, 1995). The workers
’ retention
may, therefore, be
seen as central to the maintenance of firm-specific advantages.
This study contributes to literature since it is a study that considers specifically
company-sponsored volunteering and training & development as specific CSR practices
that impact on labor retention. Additionally, it gives a deeper insight regarding the
Although earlier work has explored the relationship between CSR and external and
internal stakeholder management few studies have investigated the impact of
volunteering and training in labor retention.
Hence, firstly, this study demonstrates the impact of a specific external CSR practice
(company-sponsored volunteering) which has not been the focus of several previous
studies, giving a different view regarding the relation between CSR policies and
commitment and retention within a company. This activity is classified as an external
CSR practice since it has a more direct impact on external stakeholders albeit
employees are also influenced through the mechanism and relationship between this
type of activities and their feelings towards the company they work for. This mechanism
will be explained in detail and hypothesis will be tested in order to achieve findings and
get important conclusions to Human Resources’ field.
Second, the study evaluates the contribution o
f CSR to employees’ retention in the
context of a model that also includes aspects of internal CSR (training & development).
These two variables together reflect both the ethical position of the organization and the
corporate investments in the labor force.
Several companies have realized that in order to stay competitive, they must manage the
identification that their stakeholders and especially their employees have with the
company (Cardador and Pratt, 2006). As a result, the approach of this study enables us
to investigate the returns, in terms of affective commitment and employee-company
identification, to two different forms of socially responsible behavior, from which we
might reasonably infer payoffs in terms of labor retention and thereby establish a
mechanism by which CSR can deliver strategic benefits by understanding the
In the last years, studies were carried out regarding the impact of CSR activities in
f
irm’s perception by its consumers but
companies are also worried about high employee
turnover, employee absenteeism and employee low motivation. The use of corporate
social responsibility to build strong employee relationship with corporations and to tie
internal stakeholders to their company has been suggested by researchers on employee
behavior and CSR given that committed employees are considered as critical success
factor for any organization (Ali et. al, 2010).
To develop tight relationships with employees, organizations are using corporation
social responsibility as a strategic tool. Corporate social responsibility is being utilized
by leading organizations to establish good association not only with external
stakeholders but also internal stakeholders, specifically employees.
This study addresses this gap by analyzing the influence of corporate social
responsibility on employee commitment and retention rate, a crucial factor for the
success of any company. The following research questions are central to this study:
1. How employees perceive CSR activities conducted by corporations?
2. What influence CSR activities has on employee turnover intentions?
3. How training & development and employee-sponsored volunteering affect
employee
s’
retention rate?
The analysis is carried out in five sections. The study starts with a theoretical
background and a literature review as the basis for the model built to find the
relationship between CSR activities and labor retention which draws on social identity
theory and self-categorization theory. This relationship is discussed in the next section
specification are then discussed. The results of the analysis are presented and the
implications are then discussed in the conclusion.
LITERATURE REVIEW
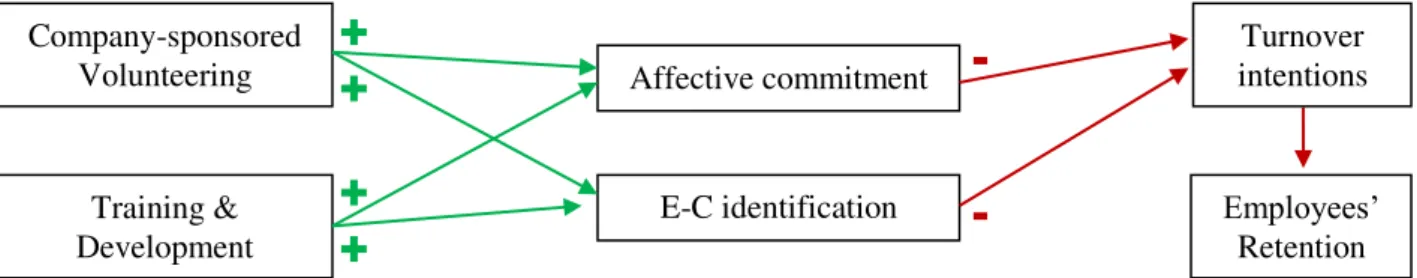
The conceptual model tested in the current study is presented in Figure 1. This model
investigates the influence of both company-sponsored volunteering and training &
development on E-C identification. It is expected that both CSR initiatives has an
influence on E-C identification through affective commitment. It is also predictable that
E-C commitment has a negative impact on turnover intentions which lastly, will impacts
negatively o
n employees’ retention.
Figure 1: Conceptual Model
External and internal CSR
On one hand, company-sponsored volunteering is a CSR practice that will affect
stakeholders external to the company, being classified as an external CSR practice.
The justification for studying employer-sponsored volunteerism stems from
observations that enhanced beneficial organizational commitment results for firms.
Specifically, by increasing organizational commitment, it is believed firms reduce
absenteeism and turnover intentions and become more attractive to applicant pools
(Brenner 2010).
Sponsored volunteerism impels employers to communicate the values shared with its
employees which in turn result in a more committe
d workforce that drives the firm’
s
Company-sponsored
Volunteering
Training &
Development
Affective commitment
E-C identification
Turnover
intentions
Employees’
Retention
+
+
+
+
-
competitive advantage. It is important, then, to understand how CSR through
employer-sponsored volunteerism leads to greater organizational commitment among employees
if these employees are directly r
esponsible for creating the firm’
s competitive
advantage. Empirical results suggest that employee participation in CSR activities and
their participation in planning CSR activities directly improve their sense of belonging
and increase organizatio
nal commitment. Also, employees’
perceptions that outsiders
have a favorable view of the company enhanced their sense of belonging, thus indirectly
boosting organizational commitment (Lee and Kim, 2010).
On the other hand, training & development activities are primarily implemented within
a company in order to improve employees’ skills that as last
result will also have a
positive impact in the bottom line of the company. Hence, the last is classified as an
internal CSR practice.
The purpose of this study is to understand if these two variables, as complements of one
another, have a positive impact in the retention rate, being this variable crucial in what
concerns human capital.
E-C identification and affective commitment
Given the centrality of commitment to long-term relationships between firms and their
employees, it has been a much studied concept (Brammer et al., 2007). This study focus
on affective commitment
defined as ‘‘an emotional attachment to, identification with,
and involvement in the organization’’ (Allen and Meyer, 1990).
Affective commitment is one specific form of organizational commitment, which has
been considered the most beneficial in enhancing organizational effectiveness. This
form of commitment emphasizes an individual’s identification and involvement in the
attachment, identification with and involvement in the organization. This would explain
why these employees are less likely to engage in withdrawal behavior and more likely
to accept change.
Consistent and strong correlations have been found between work experience variables
and effective commitment across a number of studies. For instance, affective
commitment has been positively correlated with job challenge, degree of autonomy, and
variety of skills used by the employees in different samples of employees (Colarelli et
al, 1987; Dunham et al, 1994).
Turnover intentions and Retention rate
In today’s employment market, competition for employees who are talented, creative,
and driven to satisfy customers is fierce. Thus, a company’s s
uccess hinges on their
ability to attract, motivate and retain a talented pool of employees. Evidence is
increasing that a company’s corporate social responsibility (CSR) activities is a
legitimate, compelling and increasingly important way to attract and retain good
employees, decreasing turnover intentions since employees feel stronger ties with the
company.
Therefore, by decreasing turnover intentions of its employees it is expected that
retention rate within a company that invest in volunteering activities for its employees
and training & development has a higher retention rate, keeping talented employees
with specific know-how that gives higher value to the company.
The influence of CSR practices in the retention rate through affective commitment
and E-C identification
Researchers have adopted social identity theory and self-categorization theory to
In the Social Identity Theory, a person has not
one, “personal self”, but rather several
selves that correspond to widening circles of group membership. Different social
contexts may trigger an individual to think, feel and act on basis of his personal, family
or national “level of self”
. Apart from th
e “level of self”, an individual has multiple
“social identities”. Social identity is the individual’s self
-concept derived from
perceived membership of social groups (Hogg & Vaughan, 2002). In other words, it is
an individual-based perception of what defi
nes the “us” associated with any
internalized
group membership
.
Social Identity Theory asserts that group membership creates self-categorization and
enhancement in ways that favor the in-group at the expense of the out-group. After
being categorized of a group membership, individuals seek to achieve positive
self-esteem by positively differentiating their in-group from a comparison out-group on
some valued dimension.
Self-categorization theory describes how the cognitive process of categorization, when
applied to oneself, creates a sense of identification with the social category or group and
produces the array of behaviors that we associate with group membership: conformity,
stereotyping, ethnocentrism, and so forth.
Ashforth and Mael (1989) described organizational identification as a process of
self-categorization. People categorize themselves with an organization to which they feel a
sense of belonging and self-definition. The categorization occurs through corporate
associations in which attractive associations lead to stronger employee-company
identification (Brown et al., 2006).
When a company is perceived as socially desirable, employees are likely to believe that
2007). Thus, employees can perceive themselves as whole, integrated people (Berger et
al., 2006).
HYPOTHESIS DEVELOPMENT
Given the literature regarding these variables and the relationship that can be drawn
among them, the following hypotheses are proposed:
Hypothesis 1: Company-sponsored volunteering increases affective commitment as well
as E-C identification
Association of employees’ organizational commitment and employer sponsored
volunteerism (intra-organizational volunteerism) - shared values between the
organization and its employees have a central role in the development of organizational
commitment.
Turker (2009) reports a link between CSR and organizational commitment which occurs
to the extent that socially responsible activities by the organization, including employers
encouraging employee volun
teerism, enhance the individual’
s perception of the
organization, thereby enhancing the social identity of the employee as a member of the
organization. Turker suggests that social identity theory (SIT) provides an explanation
for the link between CSR and organizational commitment. SIT suggests that individuals
tend to define themselves in terms of the groups to which they belong. Further,
identifying with a group provides a basis for defining self.
External CSR encompasses philanthropy and community contributions and also reflects
the way in which the firm interacts with the physical environment and its ethical stance
towards consumers and other external stakeholders (Carroll, 1979). Since CSR is
concerned with those actions that exceed the legal minimum, corporate contributions in
their opinions of external CSR on internal and external information sources including
the media and their personal experience within the company (Maignan and Ferrell,
2001). Recent corporate experience in the oil and pharmaceuticals industries has
emphasized the negative consequences for corporate reputation that may flow from
inappropriate behavior towards the environment or consumers (Peterson, 2004). At the
same time recent studies have shown positive relationships between corporate
reputation and philanthropy and corporate involvement in social causes and reputation
(Hess et al., 2002). Since social identity theory suggests that employees will be proud to
identify with organizations that have a positive external reputation (Maignan and
Ferrell, 2001) a positive relationship is expected between organizational commitment
and external CSR.
Additionally, Brammer et al. (2007) report gender differences in employee responses to
employer CSR activities. As a result, the impact of employer sponsored volunteerism on
organizational commitment may vary across employment sectors and within
organizat
ion’
s workforces.
Hypothesis 2: Training & Development increases affective commitment as well as E-C
identification
Training may benefit the individual and/or the organization; it may be specific to the
requirements of the organization or may encompass transferable skills that can be used
by the individual in different organizational settings. Since training benefits the
individual as well as the organization, and is subject to free rider effects by other
organizations (Hoque, 2003), corporate participation in training may be seen as both an
investment and as a socially responsible activity. A positive relationship may be
benefits that flow to the individual and because employees are expected to identify with
organizations that pursue socially responsible actions. Earlier studies provide general
support for a positive relationship between affective commitment and corporate
investment in training (Meyer et al., 2002)
Hypothesis 3: Affective commitment has a negative impact in turnover intentions
Several studies were already conducted to examine the correlations between
commitment and turnover intentions and they found all the three components of
commitment were correlated negatively with turnover intention being the strongest
correlation affective commitment, followed by normative and continuance commitment.
Hypothesis 4: E-C identification has a negative impact in turnover intentions
Although there are few studies researching the relation between these two variables, the
same way studies conclude that organizational commitment is negatively related with
turnover intentions, company identification is also expected to have a negative
relationship with turnover intention.
Once employees feel related with the company they work for and their needs are
fulfilled, studies reveal there is a positive impact in job satisfaction and employees are
willing to spend their life in the same company, not having in mind the idea of changing
their job. Hence, turnover intentions will decrease as long as employees feel identified
with the company and the values the company shares with its stakeholders.
Hypothesis 5: Company-sponsored volunteering and Training & Development impact
positively employees
’ retention
rate by decreasing turnover intentions
It is expected to find a positive relationship between both CSR practices and labor
job, feeling satisfied with the way its career is developing and with the company he
works for, the retention rate should be high within the specific company.
Nevertheless, the findings regarding the relation between these variables is one of the
main contributions of this study since there is several studies concluding about the
relation between CSR practices and commitment but few studies addressing this
question and relation between CSR practices, turnover intentions and retention rate.
Hence, this will be the last hypothesis tested in this study which will lead to the main
conclusion regarding the research question: How CSR practices can be related with
retention rate?.
METHODOLOGY
Sample and data collection
The data used in this study are derived from an employee attitude survey from several
employees. Firms included in this study were selected on the basis of two criteria:
companies engaging in social activities, with a consistent CSR strategy and that run
employees’ volunteering programs were considered. Additionally,
firms included in this
study are from different sectors in order to have a more heterogeneous population that
will allow drawing stronger conclusions.
A total of 133 questionnaires were sent to managers in charge of CSR initiatives of the
companies and distributed among the employees being 65 out of the 133 completed and
used in this study.
Variables and Measures
The variables employed in this study are constructed entirely from the employee attitude
survey. Some are simple demographic controls, while others are constructs built from
variable and then describes the independent variables. In order to measure all constructs
it was used 5-point Likert-type scales (1 = strongly disagree to 5 = strongly agree). All
of the measures used are shown in the Appendix 2.
Company-sponsored volunteering is defined as volunteering activities promoted by a
company with the aim of its employees to participate in it as it was a normal paid work
day. Hence, the company is supporting these activities in order to give an opportunity to
its employees to contribute with/to something they self-characterized with and in the
same way affect positively external stakeholders. We measured this variable using three
items regarding motivation, participation and promotion of this practice (e.g
. “
My
company promotes several volunteering activities in which the employees are
incentivized to participate.”).
Training & Development is measured by 8 statements related with social and technical
skills’ promotion and a favorable work environment (e.g.
“
We sponsor company social
events for employees to get to know one another.
”)
We measured affective commitment using three items adopted from
Morgan and Hunt’s
(1994) relationship commitment, which evaluates the intention to maintain the
relationship (e.g., ‘‘I am very committed to my company’’). One item borrowed from
Gundlach et al. (1995) was also used to measure this construct (e.g., ‘‘
I would be very
happy to spend the rest of my career with this organization.
’’). This commitment
assesses the intentions to make a future investment.
Employee
–
company identification was measured with previously developed items
reflecting the ‘‘cognitive link’’ (Dutton et al., 1994, p. 242) between
the employee and
the company. Three items, the statements ‘‘
personal meaning
’’ ‘‘
my own
’’, and ‘‘part
Turnover intentions are measured by 4 statements which
evaluate the employees’
intentions in changing their current job or remaining on it for a long time (e.g. “
I would
rathe
r work at another organization.”; “
I intend to stay for a very long time at this
organization.
”).
To proceed with the analysis this 5 variables were created using the statistical software
SPSS. Next, it was performed a reliability test to check if the variables were reliable so
that conclusions could be taken from its analysis. Afterwards, the Pearson Correlation
values were computed to check the correlation of the chosen independent variables with
TI. Then, a one-way ANOVA was computed to verify if there were differences between
employees who participate in volunteering. Finally, different regressions were
computed to examine if the proposed hypothesis could be confirmed.
RESULTS
After gathering all the collected data and creating the variables mentioned above, a
reliability analysis was performed to check the internal consistency of the responses. A
variable is reliable if the Cronbach’s
Alpha is higher than 0.7. As seen in Table no. 1, all
the variables tested are reliable since the coefficient of Cronbach’s Alpha is always
higher than 0.7 for every variable.
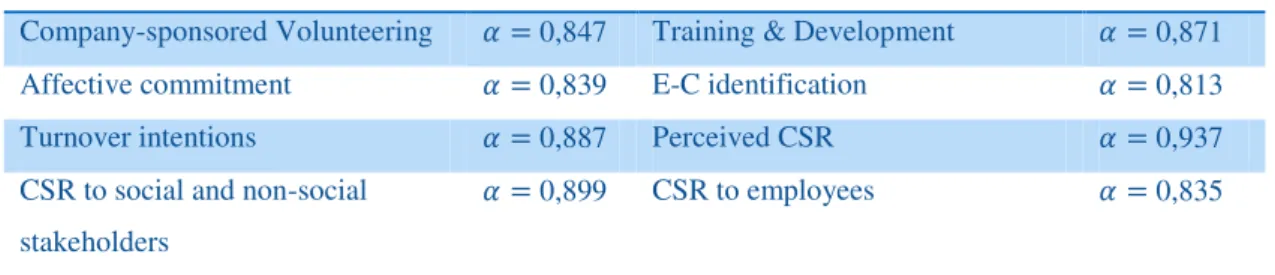
Reliability Analysis –Cronbach’s Alpha
Company-sponsored Volunteering 0,847 Training & Development 0,871 Affective commitment 0,839 E-C identification 0,813 Turnover intentions 0,887 Perceived CSR 0,937 CSR to social and non-social
stakeholders
0,899 CSR to employees 0,835
Table no. 1: Reliability analysis –Cronbach’s Alpha.
The next step was to calculate if there was any correlation between the variables this
so, the next test was to perform the correlation between company-sponsored
volunteering (CSV) and affective commitment (AC) and E-C identification (EC-ID) in
order to test for Hypothesis 1. The same test was performed for training & development
(T_D) in order to test Hypothesis 2 (Table no.2). To conclude about turnover intentions
and labor retention we performed the correlation test between Turnover intention (TI)
and CSV, T_D, AC and EC-ID (Table no. 3). Furthermore, additional variables were
created in order to control for some results the test may have since the impact that the
independent variables have in the dependent variable TI can be different if the company
has a strong CSR policy and weather these measures are perceived as sincere or not by
its employees. Hence, the correlation between TI and three new variables (CSR to social
and non-social stakeholders, CSR to employees and Perceived CSR) was tested. The
correlation tests gave a Pearson Correlation coefficient that allows us to infer about the
existence and direction of the relationship between those
variables. If the Pearson’s
coefficient is close to 1, it can be said that there is a strong relationship between two
variables. If it is close to 0, there is a weak relationship. Furthermore, if the coefficient
is positive, both variables will react in the same direction. If the coefficient is negative,
they will react in opposite directions.
Correlation analysis with AC and EC_ID (at =0.01): H1 and H2
Affective commitment E-C identification
Company-sponsored Volunteering 0,630 0,556
Training & Development 0,472 0,503
Table no. 2: Correlation analysis with AC and EC_ID at a 0.01 level of significance.
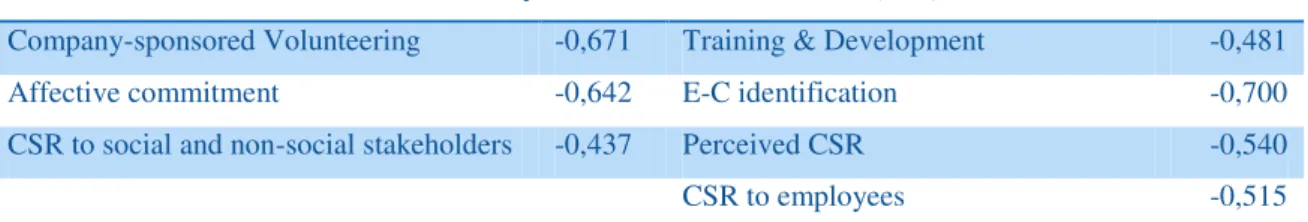
Correlation analysis with TI (at =0.01): H3, H4, H5
Company-sponsored Volunteering -0,671 Training & Development -0,481
Affective commitment -0,642 E-C identification -0,700
CSR to social and non-social stakeholders -0,437 Perceived CSR -0,540
CSR to employees -0,515
As it can be seen in Table no. 2, company-sponsored volunteering has a positive
relationship with both affective commitment and E-C identification, as it was initially
expected. The same results were gotten for the variable training & development, with
the expected positive relationship between these variable and both affective
commitment and E-C identification.
The variables that had the highest correlation coefficients with TI were
company-sponsored volunteering, affective commitment and E-C identification. Therefore, these
variables are the ones which most affect turnover intentions within a company.
Conversely, the variable with the lowest correlation was training & development. As a
result, this last variable is the one that relates less with turnover intentions of employees.
All correlation values are statistical significant for
.
As a result, it can be concluded that hypotheses 1 and 2 that were previously presented
are true since CSV and T_D proved to have a positive correlation with the AC and
EC-ID variables and, as a result they move in the same direction as affective commitment
and E-C identification does.
For the other three hypotheses, the conclusion is that the hypothesis is also confirmed
since there a negative correlation between TI and affective commitment, E-C
identification, company-sponsored volunteering and training & development, meaning
that these variables have a positive impact in labor retention. However, we observe that
training & development has a weaker relationship.
The next step was to compare means between different groups, through an One-Way
ANOVA. Another interesting aspect that can be studied in this research is the
differences that may exist in between employees who participate in activities and the
of both groups were compared. The results provided suggested that there is significant
difference between these two groups: the mean for people who participate in CSR
activities is lower 4.0476 units when compared to employees who do not participate.
This suggests that the perception about CSR greatly differs between both groups, being
the ones who participate in such activities less likely to have turnover intentions.
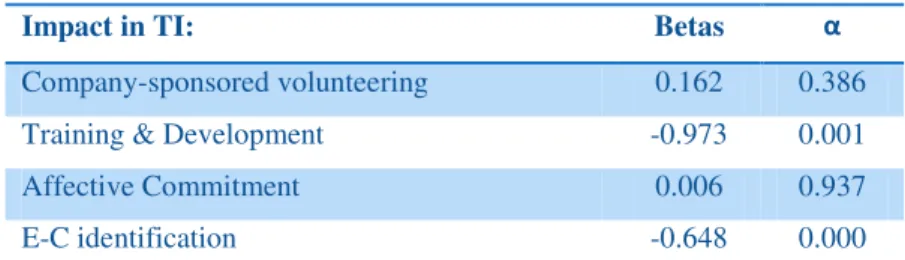
After analyzing the correlations, regressions had to be made to check the impact of all
the variables in turnover intentions. Therefore, company-sponsored volunteering,
training & development, affective commitment and E-C identification were chosen as
the independent variables in the regression which are expected to explain turnover
intentions (dependent variable). The impact of these variables over TI (table no. 3) is
presented next:
When CSV increases by one unit, Turnover intentions increases by 0.162 units.
When T_D increases by one unit, Turnover intentions decreases by 0.973 units.
When AC increases by one unit, Turnover intentions increases by 0.006 units.
When EC_ID increases by one unit, Turnover intentions decreases by 0.648 units.
Impact in TI: Betas α
Company-sponsored volunteering 0.162 0.386
Training & Development -0.973 0.001
Affective Commitment 0.006 0.937
E-C identification -0.648 0.000
Table no. 3: Outputs from the regressions of CSV, T_D, AC and EC_ID (independent variables)
on TI (treated as dependent variable).
Since R
2describes how well a regression fits a set of data, i.e how well the independent
variables explain the dependent one (turnover intentions) one can say the variables that
were chosen in this study explain 58,4% of turnover intentions (adjusted R
2= 0.584)
and the regression as a whole is statistically significant at a 1% level of significance
However, analyzing the significance levels individually, there are two variables which
are not statistically significant at a 10% level of significance (assuming this level given
the small size of the sample). Both training & development and affective commitment
show an impact with the opposite direction that was expected, meaning that when the
value of these variables increases, turnover intentions increases as well. This goes
against the hypothesis 3 and 5 (regarding T&D) but since both are not statistically
significant there will be no conclusions about its impact on turnover intentions and labor
retention.
The hypothesis 4 is confirmed since the impact of E-C identification has a strongly
negative impact on turnover intentions, as expected.
Regarding company-sponsored volunteering there is a negative impact on turnover
intentions which allow us to conclude that the investment on this CSR practice has a
positive payoff for companies once it increase labor retention. This confirms what was
expected from hypothesis 5 (regarding Company-sponsored volunteering).
To conclude about hypothesis 1 and 2 another 2 regressions were conducted being the
dependent variables now AC and EC_ID and the independent variables CSV and T_D.
The results are shown in the table below (Table no. 4 and Table no.5)
Impact in AC: Betas α
Company-sponsored volunteering 0.778 0.000
Training & Development 0.105 0.215
Table no. 4: Outputs from the regressions of CSV and T_D (independent variables)
on AC (treated as dependent variable).
Impact in EC_ID: Betas α
Company-sponsored volunteering 0.356 0.003
Training & Development 0.114 0.039
Table no. 4: Outputs from the regressions of CSV and T_D (independent variables)
According with the results we can confirm the hypothesis 1 and 2, i.e
company-sponsored volunteering and training & development have a positive impact on affective
commitment and E-C identification, although the variable training & development does
not show a strong statically significance.
CONCLUSIONS
It is an important study in the context that it provides management insight about
employee’s behavior regarding CSR. The study found highly significant positive
relationship between CSR and affective commitment, company identification and
employee retention rate.
These findings are very meaningful for decision makers and researchers. It depicts that
organizations can enhance their employee organizational commitment through
involving themselves in social activities for instance, identifying needs of the
community and fulfilling them, working for better environment or involving in
employee welfare. All these activities significantly and positively influences employee
commitment with organizations and boosts retention rate within a company.
With many global companies investing millions of dollars in CSR initiatives, it has
never been more worthwhile to assess returns with employees and optimize the return
on such investment, especially when one considers the impact of this stakeholder group
on competitive advantage. This research suggests that successful CSR strategies need to
be based on a clearly articulated and contingent input-output perspective, bring
employees closer to such strategies, satisfy key and varying employee needs, encourage
employee identification, and be co-created in partnership with employees. Specifically,
CSR is most effective when employees play the role of the actual enactor of CSR
they are not viewed as disingenuous for overly “marketing”
CSR to employees as well
as maintain control and focus in the value co-creation process. In essence, CSR is a
complex strategic endeavor that demands considerable attention and commitment by the
company in order for it to pay back. However, if done right, it can yield rich dividends
as an effective internal marketing instrument.
This study provides important information to decision makers involved in designing
employee related policies for uplifting their moral and motivate them to remain loyal,
committed with their organization and work hard for the uplifting of organization. It
also provides useful reference for future researcher on this topic.
Future Research
This research had some limitations which can be overcome by future research on this
topic. By studying these two CSR practices and its impact for different nationalities,
interesting and important results should be taken for the Human Resources’ field,
specifically in what concerns labor retention within companies.
Additionally, this future researcher may also study the impact of these CSR practices
across different industries in order to evaluate the impact that the investment in CSR
activities has given a specific industry. This would allow inferring conclusions
regarding the reasonability of an investment in CSR, since it could be not a profitable
choice for some companies in specific industries.
Therefore, a broader and larger sample size and differences between nationalities and
companies should be taken into consideration in order to get more reliable results and
take strong conclusions that can be put in practice by managers and HR departments in
APPENDIXES
Appendix 1: Variables and Measures
Variable Measure
Company-sponsored
Volunteering
1. My company promotes several volunteering activities in which the employees are incentivized to participate.
2. My colleagues and I have the opportunity to participate and suggest several volunteering activities we identify with.
3. My company is related with several organizations to which I can contribute
with because volunteering activities are promoted.
Training &
Development
1. We provide multiple career path opportunities for employees to move across
multiple functional areas of the company.
2. We provide training focused on team-building and teamwork skills training.
3. We sponsor company social events for employees to get to know one another.
4. We offer an orientation program that trains employees on the history and
processes of the organization.
5. We use job rotation to expand the skills of employees.
6. We have a mentoring system to help develop these employees.
7. Performance appraisals are used primarily to set goals for personal
development.
8. Performance appraisals are used to plan skill development and training for
future advancement within the company.
Affective
Commitment
1. I would be very happy to spend the rest of my career with this organization.
2. I really feel as if this organization's problems are my own.
3. I do not feel 'emotionally attached' to this organization. (R)
4. I do not feel like 'part of the family' at my organization. (R)
5. I do not feel part of this organization. (R)
6. This organization has a great deal of personal meaning for me.
E-C Identification
1. I am part of my organization
2. I feel a strong belonging feeling for my company.
3. I feel strong ties with my organization.
Turnover intentions
1. Since I started to work in this organization, I have thought of changing jobs.
2. If things happen as I wish, I believe that in three years I will still be working in
this organization. (R)
3. I would rather work at another organization.
REFERENCES
Ali, K.U. Rehman, S.I. Ali, J. Yousaf and M. Zia. (2010) Corporate social
responsibility influences employees commitment and organizational performance.
African Journal of Business Management
.
Alin S., Georgiana G. and Mihai R. (2011) “
The Impact of Corporate Social
Responsibi
lity on Employees”,
International Conference on Information and
Finance IPEDR vol.21
Allen, N.J., and J. P. Meyer (1990). “The measurement and antecedents of affective,
continuance, and normative commitment in organizations”.
Journal of Occupational
Psychology
Ashforth, B.E. and Mael, F. (1989) ‘Social Identity Theory and the Organization’,
Academy of Management Review
Berger, I. E., P. H. Cunningham and M. E. Drumwright: 2006, ‘Identity,
Identification, and Relationship Through Social Al
liances’, Journal of the Academy
of Marketing Science
Bhattacharya C., Sem S., Korschun, D. (2007), “Corporate social responsibility as
an internal marketing strategy”
Brammer, S. and Millington, A. (2005) Corporate Reputation and Philanthropy: An
Empirical Analysis, Journal of Business Ethics
Brenner, B.K. (2010). “In
stituting Employee Volunteer Programs as Part of
Employee Benefit Plans Yields Tangible Business Benefits”.
Journal of Financial
Service Professionals
, January
Brown, T. J., P. A. Dacin, M. G. Pratt and D. A. Whetten: 2006, ‘Identity, Intended
Image, Construed Image, and Reputation: An Interdisciplinary Framework and
Suggested Terminology’, Journal of the Academy of Marketing Science
Cardador, M. T. and M. G. Pratt: 2006, ‘Identification Management and Its Bases:
Bridging Management and Marketing Perspectives Through a Focus on Affiliation
Dimensions’, Journal of the Academy of Marketing Science
Carroll, A.B. (1979) ‘A Three Dimensional Conceptual Model of Corporate
Performance’, Academy of Management Review
Dunham, R. B., J. A. Grube and M. B. Castaneda: 19
94, ‘Organizational
Commitment: The Utility of an Integrated Definition’, Journal of Applied
Psychology
Dutton, J.E., Dukerich, J.M. and Harquail, C.V. (1994) ‘Organizational Images and
Member Identification’, Administrative Science Quarterly
Duygu T.,
(2009), “How Corporate Social Responsibility Influences Organizational
Commitment”, Journal of Business Ethics
Grant, R. (2001), “The resource
-based theory of competitive advantage: implications
for strategy formulation”
Hae-Ryong K., Moonkyu L., Hyoung-Tark L., Na-
Min K. (2010), “Corporate Social
Responsibility and Employee
–Company Identification”, Journal of Business Ethics
Hart, S.L. (1995) ‘A Natural Resource Based View of the Firm’, Academy of
Hess, D., N. Rogovsky, and T.W. Dunfee (2
002). “The Next Wave of Corporate
Community Involvement; Corporate Social Initiatives”.
California Management
Review.
Vol. 44, Issue 2, Winter pp. 110-125.
Hogg, M. and D.J. Terry (2000). “Social Identity and Self
-Categorization Processes
in Organizational
Processes in Organizational Contexts”.
Academy of Management
Review
.
Hoque, K. (2003) ‘All in All, its Just Another Plaque on the Wall: The Incidence
and Impact of the Investors in People Standard’, Journal of Management Studies
H.R. Kim, M. Lee, H.T. Lee and N.M. Kim. (2010) Corporate Social Responsibility
and Employee
–
Company Identification.
Journal of Business Ethics
.
Imran A., Kashif R., Syed Ali., Jamil Y. and Maria Z. (2010), “Corporate social
responsibility influences, employee commitment and organ
izational performance”,
African Journal of Business Management Vol. 4(12), pp. 2796-2801
Larson, B. V., K. E. Flaherty, A. R. Zablah, T. J. Brown and J. L. Wiener: 2008,
‘Linking Cause
-Related Marketing to Sales Force Responses and Performance in a
Direct
Selling Context’, Journal of the Academy of Marketing Science
Luo, X. and C. B. Bhattacharya: 2006, ‘Corporate Social Responsibility, Customer
Satisfaction, and Market Value’, Journal of Marketing
Maignan, I
. and Ferrell, O.C. (2001) ‘Corporate Citizenship
as a Marketing
Instrument’, European Journal of Marketing
Madison, T., Worth S. and Royalty K. (2012) “
C
orporate Social Responsibility,
Organizational Commitment, and Employer- Sponsored Volunteerism
”,
International
Marin, L. and S. Ruiz: 2007, '
‘‘I Need You Too!’’ Corporate Identity Attractiveness
for Consumers and the Role of Social Responsibility', Journal of Business Ethics
Meyer, J.P., Stanley, D.J., Herscovitch, L. and Topolnytsky, L.
(2002) ‘Affective,
Continuance, and Normative Commitment to the Organization: A Meta-Analysis of
Antecedents, Correlates, and Consequences’, Journal of Vocational Behavior
Pablo R., Daniel A. (2008), “Do Employees Care About CSR Programs? A
Typology of Emp
loyees According to their Attitudes”, Journal of Business Ethics
Peterson, D.K. (2004). The Relationship between Perceptions of Corporate
Citizenship and Organizational Commitment, Business Society
P. Kotler and N. Lee. (2005)
Corporate social responsibility: doing the most good
for your company and your cause.
Hoboken: John Wiley
Rodica Z. (2011) “Employees’ Expectations from CSR: The Case of Master
Students”,
3rd International Conference on Advanced Management Science IPEDR
vol.19
Sean V., Gary F. (2008),
“Ethics Programs, Perceived Corporate Social
Responsibility and Job Satisfaction”, Journal of Business Ethics
Stephen B., Andrew M. and Bruce R.
(2007) “The contribution of corporate social
responsibility to organizational Commitment”, Int.
J. of Human Resource
Management
Stuart L. H. (1995) "A Natural-Resource-
Based View of the Firm”,
The Academy of
Management Review
, Vol. 20, No. 4, pp. 986-1014.
NOVA SCHOOL OF BUSINESS AND ECONOMICS
Additional Appendixes
Work Project Fall Semester 2013/2014
Cláudia Sofia Dias Costa
#1113
Contents
NEW FILE.
DATASET NAME DataSet2 WINDOW=FRONT.
DATASET CLOSE DataSet0.
GET
FILE='C:\Users\HP\AppData\Local\Temp\Rar$DIa0.585\Questionrio__Tese.sav'.
DATASET NAME DataSet3 WINDOW=FRONT.
COMPUTE CSV=Q1_2.0+Q1_16+Q1_10.1.
EXECUTE.
COMPUTE T_D=Q1_1.0+Q1_4.0+Q1_6.0+Q1_7.0+Q1_9.0+Q1_10.0+Q1_7.1+Q1_13.1.
EXECUTE.
DATASET CLOSE DataSet2.
RECODE Q1_3.0 (1=5) (2=4) (3=3) (4=5) (5=1) INTO Q1_3.0_inv.
VARIABLE LABELS Q1_3.0_inv 'Q1_3.0_inv'.
EXECUTE.
RECODE Q1_12.0 Q1_2.1 (1=5) (2=4) (3=3) (4=5) (5=1) INTO Q1_12.0_inv Q1_2.
1_inv.
VARIABLE LABELS Q1_12.0_inv 'Q1_12.0_inv' /Q1_2.1_inv 'Q1_2.1_inv'.
EXECUTE.
DATASET ACTIVATE DataSet3.
SAVE OUTFILE='C:\Users\HP\AppData\Local\Temp\Rar$DIa0.585\Questionrio__Tes
e.sav'
/COMPRESSED.
SAVE OUTFILE='C:\Users\HP\Desktop\Questionrio__Tese.sav'
/COMPRESSED.
COMPUTE AC=Q1_3.0+Q1_12.0+Q1_5.0.
EXECUTE.
COMPUTE AC=Q1_3.0_inv+Q1_5.0+Q1_12.0_inv.
EXECUTE.
COMPUTE EC_ID=Q1_11.0+Q1_13.0+Q1_2.1_inv+Q1_4.1+Q1_5.1+Q1_15.
EXECUTE.
DATASET ACTIVATE DataSet3.
SAVE OUTFILE='C:\Users\HP\Desktop\Questionrio__Tese.sav'
/COMPRESSED.
COMPUTE AC=Q1_5.0+Q1_11.0+Q1_12.0+Q1_4.1+Q1_3.0_inv+Q1_2.1_inv.
EXECUTE.
COMPUTE AC=Q1_5.0+Q1_11.0+Q1_12.0_inv+Q1_4.1+Q1_3.0_inv+Q1_2.1_inv.
EXECUTE.
COMPUTE EC_ID=Q1_13.0+Q1_5.1+Q1_15.
EXECUTE.
COMPUTE TI=Q1_1.1+Q1_3.1+Q1_12.1+Q1_14.0.
EXECUTE.
EXECUTE.
COMPUTE CSR_STAK=Q1_1+Q1_2+Q1_3++Q1_4+Q1_5+Q1_6.
EXECUTE.
COMPUTE CSR_EMP=Q1_7+Q1_8+Q1_9+Q1_10+Q1_11+Q1_12+Q1_13.
EXECUTE.
SORT CASES BY AC (A).
FREQUENCIES VARIABLES=AC
/STATISTICS=RANGE MINIMUM MAXIMUM STDDEV MEAN MEDIAN
/FORMAT=LIMIT(50)
/ORDER=ANALYSIS.
Frequencies
[DataSet3] C:\Users\HP\Desktop\Questionrio__Tese.sav
Statistics
AC
N Valid
Missing
Mean
Median
Std. Deviation
Range
Minimum
Maximum
65
0
24,7231
26,0000
4,22976
18,00
12,00
30,00 AC
AC
Frequency Percent Valid Percent
Cumulative Percent
Valid 12,00
15,00
17,00
18,00
19,00
21,00
22,00
23,00
24,00
25,00
26,00
27,00
28,00
29,00
30,00
Total
1 1,5 1,5 1,5
1 1,5 1,5 3,1
1 1,5 1,5 4,6
7 10,8 10,8 15,4
2 3,1 3,1 18,5
1 1,5 1,5 20,0
3 4,6 4,6 24,6
5 7,7 7,7 32,3
4 6,2 6,2 38,5
5 7,7 7,7 46,2
4 6,2 6,2 52,3
10 15,4 15,4 67,7
9 13,8 13,8 81,5
10 15,4 15,4 96,9
2 3,1 3,1 100,0
65 100,0 100,0
COMPUTE AC=Q1_3.0_inv+Q1_12.0_inv+Q1_2.1_inv+Q1_4.1+Q1_11.0+Q1_5.0.
EXECUTE.
COMPUTE AC=Q1_3.0_inv+Q1_12.0_inv+Q1_2.1_inv+Q1_4.1+Q1_11.0+Q1_5.0.
EXECUTE.
RELIABILITY
/VARIABLES=CSV T_D EC_ID TI P_CSR CSR_STAK CSR_EMP AC
/SCALE('ALL VARIABLES') ALL
/MODEL=ALPHA
/STATISTICS=DESCRIPTIVE CORR
/SUMMARY=MEANS.
Reliability
[DataSet3] C:\Users\HP\Desktop\Questionrio__Tese.sav
Scale: ALL VARIABLES
Case Processing Summary
N %
Cases Valid
Excludeda
Total
65 100,0
0 ,0
65 100,0
Listwise deletion based on all variables in the procedure. a.
Reliability Statistics
Cronbach's Alpha
Cronbach's Alpha Based
on Standardized
Items N of Items
,879 ,890 8
Item Statistics
Mean Std. Deviation N
CSV
T_D
EC_ID
TI
P_CSR
CSR_STAK
CSR_EMP
AC
10,8462 2,93806 65
27,0615 6,13361 65
11,9846 2,63090 65
12,3385 1,84795 65
11,2462 2,82860 65
23,2154 5,14020 65
26,0462 5,20646 65
Inter-Item Correlation Matrix
CSV T_D EC_ID TI P_CSR CSR_STAK CSR_EMP
CSV
T_D
EC_ID
TI
P_CSR
CSR_STAK
CSR_EMP
AC
1,000 ,594 ,556 ,249 ,730 ,614 ,602
,594 1,000 ,503 ,158 ,567 ,411 ,658
,556 ,503 1,000 ,085 ,523 ,562 ,603
,249 ,158 ,085 1,000 ,169 ,204 ,044
,730 ,567 ,523 ,169 1,000 ,730 ,727
,614 ,411 ,562 ,204 ,730 1,000 ,731
,602 ,658 ,603 ,044 ,727 ,731 1,000
,630 ,472 ,880 ,168 ,607 ,665 ,668
Inter-Item Correlation Matrix
AC CSV
T_D
EC_ID
TI
P_CSR
CSR_STAK
CSR_EMP
AC
,630
,472
,880
,168
,607
,665
,668
1,000
Summary Item Statistics
Mean Minimum Maximum Range
Maximum /
Minimum Variance N of Items
Item Means 18,433 10,846 27,062 16,215 2,495 54,683 8
RELIABILITY
/VARIABLES=Q1_11.1 Q1_9.1 Q1_6.1
/SCALE('Perceived_Sincerity') ALL
/MODEL=ALPHA
/STATISTICS=DESCRIPTIVE CORR
/SUMMARY=MEANS.
Reliability
[DataSet3] C:\Users\HP\Desktop\Questionrio__Tese.sav
Scale: Perceived_Sincerity
Case Processing Summary
N %
Cases Valid
Excludeda
Total
65 100,0
0 ,0
65 100,0
Listwise deletion based on all variables in the procedure. a.
Reliability Statistics
Cronbach's Alpha
Cronbach's Alpha Based
on Standardized
Items N of Items
,937 ,937 3
Item Statistics
Mean Std. Deviation N
Diga até que ponto concorda com as seguintes frases acerca de diversos aspectos relacionados com o s...-Eu acredito que a minha
organização se preocupa verdadeiramente com assuntos sociais.
Diga até que ponto concorda com as seguintes frases acerca de diversos aspectos relacionados com o s...-A minha organização é sincera quando comunica sobre responsabilidade social.
Diga até que ponto concorda com as seguintes frases acerca de diversos aspectos relacionados com o s...-A informação dada pela minha organização a respeito de responsabilidade social e sincera.
3,75 ,919 65
3,80 1,064 65
Inter-Item Correlation Matrix
Diga até que ponto concorda com as seguintes frases acerca de diversos aspectos relacionados com o s...-Eu acredito que a
minha organiza&cce dil;ão se preocupa verdadeirame nte com assuntos sociais.
Diga até que ponto concorda com as seguintes frases acerca de diversos aspectos relacionados
com o s...-A minha organiza&cce dil;ão é sincera quando comunica sobre responsabilid ade social.
Diga até que ponto concorda com as seguintes frases acerca de diversos aspectos relacionados
com o s...-A informa&ccedi l;ão dada pela minha organiza&cce dil;ão a respeito de responsabilid
ade social e sincera. Diga até que ponto concorda com as seguintes
frases acerca de diversos aspectos relacionados com o s...-Eu acredito que a minha
organização se preocupa verdadeiramente com assuntos sociais.
Diga até que ponto concorda com as seguintes frases acerca de diversos aspectos relacionados com o s...-A minha organização é sincera quando comunica sobre responsabilidade social.
Diga até que ponto concorda com as seguintes frases acerca de diversos aspectos relacionados com o s...-A informação dada pela minha organização a respeito de responsabilidade social e sincera.
1,000 ,844 ,756
,844 1,000 ,898
,756 ,898 1,000
Summary Item Statistics
Mean Minimum Maximum Range
Maximum /
Minimum Variance N of Items
Item Means 3,749 3,692 3,800 ,108 1,029 ,003 3
Descriptive Statistics
Mean Std. Deviation N
CSR_STAK
AC
23,2154 5,14020 65
24,7231 4,22976 65
Correlations
CSR_STAK AC
CSR_STAK Pearson Correlation
Sig. (2-tailed)
N
AC Pearson Correlation
Sig. (2-tailed)
N
1 ,665**
,000
65 65
,665** 1
,000
65 65
Correlation is significant at the 0.01 level (2-tailed). **.
CORRELATIONS
/VARIABLES=AC CSV
/PRINT=TWOTAIL NOSIG
/STATISTICS DESCRIPTIVES
/MISSING=PAIRWISE.
Correlations
[DataSet3] C:\Users\HP\Desktop\Questionrio__Tese.sav
Descriptive Statistics
Mean Std. Deviation N
AC
CSV
24,7231 4,22976 65
10,8462 2,93806 65
Correlations
AC CSV
AC Pearson Correlation
Sig. (2-tailed)
N
CSV Pearson Correlation
Sig. (2-tailed)
N
1 ,630**
,000
65 65
,630** 1
,000
65 65
Correlation is significant at the 0.01 level (2-tailed). **.
CORRELATIONS
Correlations
[DataSet3] C:\Users\HP\Desktop\Questionrio__Tese.sav
Descriptive Statistics
Mean Std. Deviation N
AC
T_D
24,7231 4,22976 65
27,0615 6,13361 65
Correlations
AC T_D
AC Pearson Correlation
Sig. (2-tailed)
N
T_D Pearson Correlation
Sig. (2-tailed)
N
1 ,472**
,000
65 65
,472** 1
,000
65 65
Correlation is significant at the 0.01 level (2-tailed). **.
CORRELATIONS
/VARIABLES=AC TI
/PRINT=TWOTAIL NOSIG
/STATISTICS DESCRIPTIVES
/MISSING=PAIRWISE.
Correlations
[DataSet3] C:\Users\HP\Desktop\Questionrio__Tese.sav
Descriptive Statistics
Mean Std. Deviation N
AC
TI
24,7231 4,22976 65
12,3385 1,84795 65
Correlations
AC TI
AC Pearson Correlation
Sig. (2-tailed)
N
TI Pearson Correlation
Sig. (2-tailed)
N
1 ,168
,181
65 65
,168 1
,181
65 65
CORRELATIONS
/VARIABLES=EC_ID CSV
/PRINT=TWOTAIL NOSIG
/STATISTICS DESCRIPTIVES
/MISSING=PAIRWISE.
Correlations
[DataSet3] C:\Users\HP\Desktop\Questionrio__Tese.sav
Descriptive Statistics
Mean Std. Deviation N
EC_ID
CSV
11,9846 2,63090 65
10,8462 2,93806 65
Correlations
EC_ID CSV
EC_ID Pearson Correlation
Sig. (2-tailed)
N
CSV Pearson Correlation
Sig. (2-tailed)
N
1 ,556**
,000
65 65
,556** 1
,000
65 65
Correlation is significant at the 0.01 level (2-tailed). **.
CORRELATIONS
/VARIABLES=EC_ID T_D
/PRINT=TWOTAIL NOSIG
/STATISTICS DESCRIPTIVES
/MISSING=PAIRWISE.
Correlations
[DataSet3] C:\Users\HP\Desktop\Questionrio__Tese.sav
Descriptive Statistics
Mean Std. Deviation N
EC_ID
T_D
11,9846 2,63090 65
Correlations
EC_ID T_D
EC_ID Pearson Correlation
Sig. (2-tailed)
N
T_D Pearson Correlation
Sig. (2-tailed)
N
1 ,503**
,000
65 65
,503** 1
,000
65 65
Correlation is significant at the 0.01 level (2-tailed). **.
CORRELATIONS
/VARIABLES=EC_ID TI
/PRINT=TWOTAIL NOSIG
/STATISTICS DESCRIPTIVES
/MISSING=PAIRWISE.
Correlations
[DataSet3] C:\Users\HP\Desktop\Questionrio__Tese.sav
Descriptive Statistics
Mean Std. Deviation N
EC_ID
TI
11,9846 2,63090 65
12,3385 1,84795 65
Correlations
EC_ID TI
EC_ID Pearson Correlation
Sig. (2-tailed)
N
TI Pearson Correlation
Sig. (2-tailed)
N
1 ,085
,503
65 65
,085 1
,503
65 65
CORRELATIONS
/VARIABLES=TI CSV
/PRINT=TWOTAIL NOSIG
/STATISTICS DESCRIPTIVES
/MISSING=PAIRWISE.
Correlations
[DataSet3] C:\Users\HP\Desktop\Questionrio__Tese.sav
Descriptive Statistics
Mean Std. Deviation N
TI
CSV
12,3385 1,84795 65
10,8462 2,93806 65
Correlations
TI CSV
TI Pearson Correlation
Sig. (2-tailed)
N
CSV Pearson Correlation
Sig. (2-tailed)
N
1 ,249*
,046
65 65
,249* 1
,046
65 65
Correlation is significant at the 0.05 level (2-tailed). *.
CORRELATIONS
/VARIABLES=TI T_D
/PRINT=TWOTAIL NOSIG
/STATISTICS DESCRIPTIVES
/MISSING=PAIRWISE.
Correlations
[DataSet3] C:\Users\HP\Desktop\Questionrio__Tese.sav
Descriptive Statistics
Mean Std. Deviation N
TI
T_D
12,3385 1,84795 65
27,0615 6,13361 65
Correlations
TI T_D
TI Pearson Correlation
Sig. (2-tailed)
N
T_D Pearson Correlation
Sig. (2-tailed)
N
1 ,158
,209
65 65
,158 1
,209
65 65
ONEWAY CSV BY Q4
/STATISTICS DESCRIPTIVES
/MISSING ANALYSIS
/POSTHOC=LSD T3 ALPHA(0.05).
[DataSet3] C:\Users\HP\Desktop\Questionrio__Tese.sav
Warnings
Post hoc tests are not performed for CSV because there are fewer than three groups.
Descriptives
CSV
N Mean Std. Deviation Std. Error
95% Confidence Interval for Mean
Lower Bound Upper Bound
Masculino
Feminino
Total
33 11,0606 2,88248 ,50178 10,0385 12,0827
31 10,6129 3,07330 ,55198 9,4856 11,7402
64 10,8438 2,96122 ,37015 10,1041 11,5834
CSV
Descriptives
CSV
Minimum Maximum
Masculino
Feminino
Total
3,00 15,00
5,00 15,00
3,00 15,00
CSV
ANOVA
CSV
Sum of
Squares df Mean Square F Sig.
Between Groups
Within Groups
Total
3,204 1 3,204 ,362 ,550
549,234 62 8,859
552,438 63
CSV
ONEWAY T_D BY Q4
/STATISTICS DESCRIPTIVES
/MISSING ANALYSIS
/POSTHOC=LSD T3 ALPHA(0.05).
Oneway
[DataSet3] C:\Users\HP\Desktop\Questionrio__Tese.sav
Warnings
Post hoc tests are not performed for T_D because there are fewer than three groups.
Descriptives
T_D
N Mean Std. Deviation Std. Error
95% Confidence Interval for Mean
Lower Bound Upper Bound
Masculino
Feminino
Total
33 26,9091 6,55441 1,14098 24,5850 29,2332
31 27,1935 5,86185 1,05282 25,0434 29,3437
64 27,0469 6,18095 ,77262 25,5029 28,5908
T_D
Descriptives
T_D
Minimum Maximum
Masculino
Feminino
Total
11,00 37,00
12,00 39,00
11,00 39,00
T_D
ANOVA
T_D
Sum of
Squares df Mean Square F Sig.
Between Groups
Within Groups
Total
1,293 1 1,293 ,033 ,856
2405,566 62 38,799
2406,859 63
T_D
REGRESSION
/DESCRIPTIVES MEAN STDDEV CORR SIG N
/MISSING LISTWISE
/STATISTICS COEFF OUTS R ANOVA CHANGE
/CRITERIA=PIN(.05) POUT(.10)
/NOORIGIN
/DEPENDENT TI
/METHOD=ENTER AC EC_ID CSV T_D.
Regression
[DataSet3] C:\Users\HP\Desktop\Questionrio__Tese.sav
Descriptive Statistics
Mean Std. Deviation N
TI
AC
EC_ID
CSV
T_D
12,3385 1,84795 65
24,7231 4,22976 65
11,9846 2,63090 65
10,8462 2,93806 65