Global J. Environ. Sci. Manage., 1 (1): 63-70, Winter 2015
Optimizing the production of Polyphosphate
from
Acinetobacter towneri
*J. Aravind; T. Saranya; P. Kanmani
Department of Biotechnology, Kumaraguru College of Technology, Coimbatore – 641049, India
ABSTRACT:
Inorganic polyphosphates (PolyP) are linear polymers of few to several hundred orthophosphate residues, linked by energy-rich phosphoanhydride bonds. Four isolates had been screened from soil sample. By MALDI-TOF analysis, they were identified as Bacillius cereus, Acinetobacter towneri, B. megaterium and B. cereus. The production of PolyP in four isolates was studied in phosphate uptake medium and sulfur deficient medium at pH 7. These organisms had shown significant production of PolyP after 22h of incubation. PolyP was extracted from the cells using alkaline lysis method. Among those isolates, Acinetobacter towneri was found to have high (24.57% w/w as P) accumulation of PolyP in sulfur deficient medium. The media optimization for sulfur deficiency was carried out using Response surface methodology (RSM). It was proven that increase in phosphate level in the presence of glucose, under sulfur limiting condition, enhanced the phosphate accumulation by Acinetobacter towneri and these condition can be simulated for the effective removal of phosphate from wastewater sources.Keywords: Polyphosphates, Biopolymer, MALDI-TOF, Sulfur deficient medium, Plackett-Burman, Neisser stain Global J. Environ. Sci. Manage., 1 (1): 63-70, Winter 2015
DOI: 10.7508/gjesm.2015.01.006
*Corresponding Author Email: [email protected] Tel.: +91 422 266 9401; Fax: +91 422 266 9401 INTRODUCTION
Polyphosphate (polyP) appears to have always been an easy and rich source of energy from prehistoric times to today. It is one of the most widely distributed natural biopolymers, having been detected in many bacteria, fungi, yeasts, plants and animals (Dawes and Senior, 1973; Kulaev and Vagabov, 1983; Kulaev et al., 1999). Polyphosphates are salts or esters of polymeric oxyanions formed from tetrahedral PO4 (phosphate) structural units linked together by sharing oxygen atoms. They are linear, cyclic, cross-linked or branched polymers of orthophosphate residues linked by high-energy phospho-anhydride bonds equivalent to the bonds in ADP and ATP (Kulaev, 1975).
PolyP has been detected in abundance in all the living forms ranging from the prokaryotes to mammals, in the volcanic condensates, plants, and deep oceanic steam vents, indicating that it can be formed spontaneously by simple condensation of orthophosphoric acids under high temperature. They are present in the mammalian cells and sub- cellular
Received 7 October 2014; revised 10 November 2014; accepted 1 December 2014; available online 1 December 2014
organelles like lysosomes, mitochondria, mainly higher in nuclei. PolyP is more abundant in microbes than in plants and animals (Kornberg, 1995).
The microbial synthesis of intracellular polyP is primarily catalyzed by the enzyme polyphosphate kinase through the reversible transfer of the gamma phosphate of ATP to polyp (Geissdorferet al., 1998; Kornberg and Fraley, 2000). PolyP hydrolysis is mediated by exopolyphosphatases (PPX), endopolyphosphatases (Mullan et al., 2002). Polyphosphate accumulating organisms (PAOs) are known as the microorganisms to absorb free phosphate in the environment and assimilate them as intracellular polyphosphate (poly-P) particles. This process was viewed as enhanced biological phosphorus removal (EBPR) in wastewater treatment systems (Bondet al., 1999; Minoet al., 1998; Oehmenet al., 2007).
the ability to store phosphorus as polyphosphates in volutin granules. PolyP accumulation usually takes place under two conditions: PolyP overplus and PolyP luxury uptake. Acinetobacter spp. are able to accumulate more phosphate than is required for cell synthesis; the so-called luxury phosphate uptake. It is the process in which the organism produces PolyP when another nutrient rather than phosphate limits its growth (e.g: sulfur starvation), thereby permitting organism to accumulate excess phosphate reserves that would become highly valuable under future potential of phosphate starvation is called PolyP luxury uptake (Fuhs and Chen, 1975).
Although Acinetobacter sp. and Burkholderia
sp. are found in low numbers, their capacity to accumulate poly-P intracellularly was the highest amongst all the isolates (Khoi and Diep, 2013). PolyP
granules contain “acid-insoluble” polyP with
long-chains and are present in the cytoplasm of various prokaryotes. In bacterial cells, there is also “acid-soluble” polyP with short-chains that can be found
in various cell compartments (on the cell surface, in the perisplasm, and in the plasma membrane) (Kulaev, 1975).
Polyphosphates are capable of forming complexes with other polymers especially proteins, basic polypeptides and nucleic acids. This property is due to a simple interaction between cations and anions. Polyphosphate can be observed under bright-field or
phase-contrast microscopy. Neisser’s stain is used
to observe these granules under bright-field microscope (Serafimet al., 2002). Nuclear magnetic resonance (NMR) has been also recently used to detect polyphosphate granules in wastewater microorganisms (Florentz and Granger, 1983; Suresh
et al., 1984).
PolyP has some basic properties which determine its application in various fields of medicine, agriculture, industry, etc. PolyP can be used as an antibacterial agent in all processed meat, poultry, and fish products (Kulakovskayaet al., 2012). It can also be used as a safe additive to meat processing as it enhances water binding, emulsification, colour retention, and antioxidant capacity. PolyP is used in wastewater treatment by sequestering iron, manganese, and alkaline earth metals such as calcium and magnesium. Calcium PolyP fiber is also used as a scaffold material for tendon tissue engineering in vitro (Sun and Zhao, 2002).
MATERIALS AND METHODS Sampling and organism isolation
Soil sample were serially diluted and it was plated on LeedsAcinetobacter agar (LAM) and incubated at37 °C for 24 hours. Pink coloured colonies appearing on LAM agar plates indicate positive result for screening ofAcinetobacter species (Jawadet al., 1994).
Media
Phosphate uptake medium:
PAOs were cultivated at 30 °C for 22 h in the media contained (g/l): 5g CH3COONa, 0.5g MgSO4.7H2O, 0.18g KNO3, 0.25g KH2PO4, 0.5g peptone, 0.5g yeast extract and 0.5ml trace elements. The trace elements contained (g/l): 1.5g FeCl3.6H2O, 0.15g H3BO3, 0.03g CuSO4.5H2O, 0.18g KI, 0.12g MnCl2.4H2O, 0.06g Na2MoO4.2H2O, 0.12g CoCl2.6H2O and 10g EDTA. The pH of the medium was adjusted to 7.0 (Harold, 1966).
Sulfur deficient medium
PAOs accumulate larger amounts of PolyP in stationary phase sulfur deficient cultures or when inorganic PolyP is added to phosphate starved cells. The medium contained the following composition (g/l): 5g glucose, 0.5g KH2PO4, 1g NH4Cl, 1g NaCl, 0.01g MgCl2, 0.001g Na2SO4, 10g tris-(hydroxyl methyl-methylamine). The pH of the medium was adjusted to 7.0. The cultures were grown at 30 °C for 22 h (Harold, 1966).
Extraction of PolyP
After 22h of incubation, 4ml of cell suspension was harvested and centrifuged.The pellet was resuspended in 0.2N NaOH and kept in shaker at 160rpm for 20h. After 20h of lysis, the sample was again centrifuged. The supernatant was separated into two parts. One for direct orthophosphate assay and another was mixed with equal volume of 1N HCl and kept for hydrolysis in water bath at 100 °C for 10 min. Then it was cooled and orthophosphate assay was carried out. The difference in values of hydrolyzed and unhydrolyzed samples represents the presence of PolyP (Khoi and Diep, 2013).
Orthophosphate assay
Global J. Environ. Sci. Manage., 1 (1): 63-70, Winter 2015
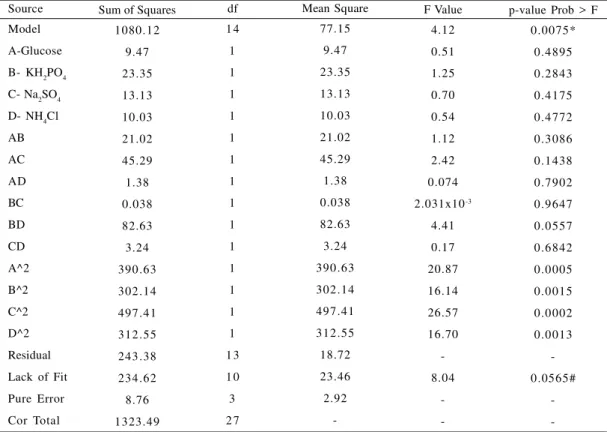
Fig. 2: Production of PolyP from different isolates in sulfur deficient medium
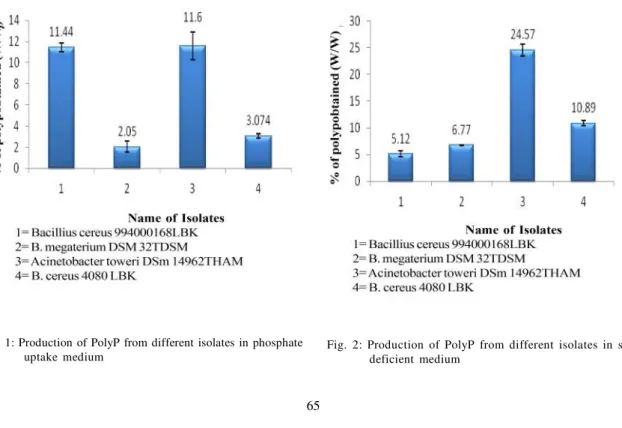
Fig. 1: Production of PolyP from different isolates in phosphate uptake medium
Name of Isolates 1= Bacillius cereus 994000168LBK 2= B. megaterium DSM 32TDSM
3= Acinetobacter toweri DSm 14962THAM 4= B. cereus 4080 LBK
Name of Isolates 1= Bacillius cereus 994000168LBK 2= B. megaterium DSM 32TDSM
3= Acinetobacter toweri DSm 14962THAM 4= B. cereus 4080 LBK
%
of
p
ol
yp
ob
tai
n
e
d
(
W
/W
)
%
of
p
ol
yp
ob
tai
n
e
d
(
W
/W
)
the absorbance was read at 850 nm. Concentrations were calculated from standard curves prepared by assaying KH2PO4 standards (Sahekiet al., 1985).
Medium optimization
Response Surface Methodology
The interactive studies on four significant factors A (Glucose), B (KH2PO4), C (Na2SO4) and D (NH4Cl) on the response (Yield % of PolyP) were determined statistically using RSM (Box-Behnken design) Design Expert software (Trial Version 9.0.1).
A matrix consisting of 28 experiments with 4 replicates at the center point generated by the software was applied for maximizing the yield of PolyP. Production was carried out in 100 ml of sulfur deficient medium (pH 7.0), inoculated with Acinetobacter towneriand incubated at 37 °C for 22h in an orbital shaker. After incubation period, PolyP was extracted using alkaline lysis method.
The quadratic model was analyzed statistically. Analysis of Variance (ANOVA) table including F-test
was used to judge the model’s significance and
regression factor. The second order polynomial equation was expressed in the form of contour and 3D plots.
RESULTS AND DISCUSSION Isolation and Screening
Four different colonies were screened on LAM plates. By MALDI-TOF analysis, they were identified as Bacillius cereus 994000168 LBK, Acinetobacter towneriDSM 14962T HAM, B. megateriumDSM 32T DSM and B. cereus4080 LBK.
The production of PolyP was analyzed in phosphate uptake medium and sulfur deficient medium and
Acinetobacter towneriwas able to produce 11.6 % (w/ w) of polyphosphate under the phosphate uptake medium condition (Fig 1).
Acinetobacter towneri had higher accumulation of PolyP in both the media when compared to other organisms, and the production of PolyP was higher (24.57% as P) in sulfur deficient medium than in phosphate uptake medium (Figs. 1 and 2).
Response Surface Methodology
Run 1 2 3 4 5 6 7 8 9 1 0 1 1 1 2 1 3 1 4 1 5 1 6 1 7 1 8 1 9 2 0 2 1 2 2 2 3 2 4 2 5 2 6 2 7 2 8
Factor 1 A: Glucose* (g)
0.10 1.50 0.80 0.80 0.80 0.10 0.80 1.50 1.50 0.80 0.80 0.80 0.80 0.80 0.10 1.50 0.80 0.10 0.80 1.50 1.50 0.10 0.10 0.80 0.80 0.80 0.80 0.80
Factor 2 B: KH2PO4
#(g) 0.01 0.20 0.11 0.11 0.01 0.11 0.11 0.01 0.11 0.11 0.20 0.01 0.01 0.20 0.11 0.11 0.01 0.11 0.11 0.11 0.11 0.20 0.11 0.20 0.11 0.11 0.11 0.20
Factor 3 C: Na2SO4
^(mg) 5.50 5.50 10.00 5.50 5.50 1.00 1.00 5.50 5.50 5.50 5.50 1.00 10.00 1.00 5.50 5.50 5.50 10.00 5.50 1.00 10.00 5.50 5.50 5.50 1.00 10.00 5.50 10.00
Factor 4 D: NH4Cl
+ (g)
0.17 0.17 0.05 0.17 0.05 0.17 0.05 0.17 0.05 0.17 0.05 0.17 0.17 0.17 0.30 0.30 0.30 0.17 0.17 0.17 0.17 0.17 0.05 0.30 0.30 0.30 0.17 0.17
Response 1 Yield (%)
13.6 17.2 14.17 24.2 18.45 15.27 15.56 15.8 6.38 23.85 5.73 6.5 7.12 5.14 6.34 9.02 8.24 5.03 26.34 5.58 8.8 5.83 6.05 13.7 11.53 6.54 27.41 5.37 Table 1: Experimental design of Box-Behnken
*Glucose high- 1.5g/l low-0.1g/l, #KH2PO4 high-0.2g/l low-0.1 g/l, ^Na2SO4 high-10mg/l low-1mg/l, +NH4Cl high-0.3g/l low-0.05g/l.
design setup is shown in Table 1.
Final equation in terms of coded factors
Yield = 25.45 + 0.89*A -1.40*B – 1.05*C – 0.91*D + 2.29*AB + 3.37*AC + 0.59*AD – 0.097*BC + 4.54*BD – 0.90*CD – 8.07*A2 – 7.10*B2 – 9.10*C2 – 7.22*D2(1)
From equation (1), it has been shown that the combination of media components: glucose-NH2PO4, glucose-Na2SO4and Na2SO4-NH4Cl has positively influencing the productivity, while NH2PO4-Na2SO4 has negatively influenced the productivity of PolyP. Hence these condition can be effectively used by
Acinetobacter towneri for removal of phosphate from phosphate containing effluent effectively
The ANOVA results and diagnostic case studies are given in Table 2. The actual vs. predicted values are depicted in Table 3.
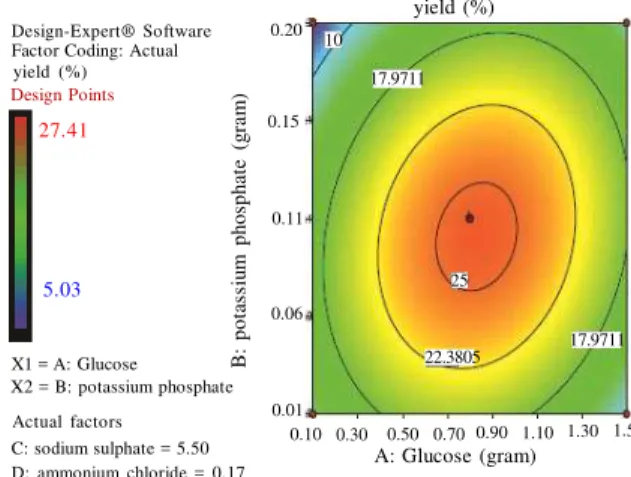
The P value serves as a tool for checking the significance of each of the coefficients and its interaction with other factors. Low values of P<0.05 indicates the significant role of medium components on PolyP production which is further strengthened by their higher F-value obtained statistically. Also A2, B2,
C2 and D2 are significant which also proves the impact
of higher concentrations of these medium components interaction on polyphosphate production.
R2value gives a measure of how much variability in the
Global J. Environ. Sci. Manage., 1 (1): 63-70, Winter 2015
Source
Model
A-Glucose
B- KH2PO4
C- Na2SO4
D- NH4Cl
AB
AC
AD
BC
BD
CD
A^2
B^2
C^2
D^2
Residual
Lack of Fit
Pure Error
Cor Total
df
1 4
1
1
1
1
1
1
1
1
1
1
1
1
1
1
1 3
1 0
3
2 7
Table 2: ANOVA table for RSM quadratic model
parameters and their interactions. This model has R2
value of 0.8161, which implies that it was better predictor up to 81.61%.
Adequate precision measures the signal to noise ratio. A ratio greater than 4 is desirable. In this model, the ratio of 7.096 indicate an adequate signal and this model can be used to navigate the design space.
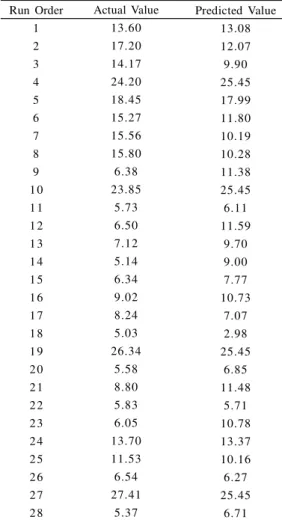
The regression equation is expressed graphically in the form of contour plots which indicate the interaction among independent factors and their influence on yield of PolyP. The contour plots of all the combination of interactions were found to be elliptical. The contour plots were generated by varying the levels of two factors while keeping the third one constant (Figs. 3, 4, 5, 6, 7 and 8).
RSM design yielded a maximum yield of PolyP of 27.41% in trial no.27 and the values of factors were 0.80g glucose, 0.11g KH2PO4, 5.5 mg Na2SO4 and 0.17g NH4Cl. This is a 1.1 fold increase in comparison with the pre-optimization maximum value in sulfur deficient medium.
CONCLUSION
PolyP, inorganic polymers are made up of phosphate residues linked by sharing oxygen atom. They were produced byAcinetobacter under luxuty phosphate uptake conditions. Based on the pre-optimization studies on sulfur deficient medium, it has been found that Acinetobacter towneri has higher production (24.57% w/w as P) of PolyP when compared to other organisms screened. Box-Behnken design applied successfully to obtain maximum productivity of PolyP under sulfur limiting conditions. Based on this design, the optimal values of factors, 0.80g glucose, 0.11g KH2PO4, 5.5g Na2SO4 and 0.17g NH4Cl resulted in 1.1 fold increase in PolyP accumulation in
Acinetobacter towneri. The model was statistically significant based on low P and high F values. It can be concluded that the model can be applied for production of PolyP fromAcinetobacter towneri and can be simulated further for effective phosphates removal from effluents.
Sum of Squares
1080.12
9.47
23.35
13.13
10.03
21.02
45.29
1.38
0.038
82.63
3.24
390 .63
302 .14
497 .41
312 .55
243 .38
234 .62
8.76
1323.49
Mean Square
77.15
9.47
23.35
13.13
10.03
21.02
45.29
1.38
0.038
82.63
3.24
390 .63
302 .14
497 .41
312 .55
18.72
23.46
2.92
-F Value
4.12
0.51
1.25
0.70
0.54
1.12
2.42
0.074
2.031x10⁻³
4.41
0.17
20.87
16.14
26.57
16.70
-8.04
-p-value Prob > F
0.0075*
0.4 895
0.2 843
0.4 175
0.4 772
0.3 086
0.1 438
0.7 902
0.9 647
0.0 557
0.6 842
0.0 005
0.0 015
0.0 002
0.0 013
-0.0565#
D : a m m o ni u m c h lo ri d e ( g ra m )
yield (%)
A: Glucose (gram)
Design-Expert® Software Factor Coding: Actual yield (%) Design Points
5.03 27.41
X1 = A: Glucose X2 = D: ammonium chloride
B: potassium phosphate = 0.11 C: sodium sulphate = 5.50
0.10 0.30 0.50 0.70 0.90 22.3805 25 17.9711 10 17.9711 0.05 0.11 0.17 0.24 0.30
Actual factors
1.10 1.30 1.50
D : a m m o ni u m c h lo ri d e ( g ra m )
yield (%)
B: potassium phosphate (gram)
Design-Expert® Software Factor Coding: Actual yield (%) Design Points
5.03 27.41
X1 = B: potassium phosphate X2 = D: ammonium chloride
A: Glucose = 0.80 C: sodium sulphate = 5.50
0.01 0.06 0.11 0.15 0.20 22.3805 25 17.9711 10 10 0.05 0.11 0.17 0.24 0.30
Actual factors
Fig 3: Contour plot – showing interaction of Glucose and KH2PO4 towards yield
Fig 4: Contour plot-showing interaction of Glucose and Na2SO4 towards yield
Fig 5: Contour plot – showing interaction of Glucose and NH4Cl towards yield
Fig 6: Contour plot – showing interaction of KH2PO4 and Na2SO4 towards yield
Fig 8: Contour plot – showing interaction of Na2SO4 and
NH4Cl towards yield
C : so d ium s ul p h a te ( m il li gr a m )
yield (%)
A: Glucose (gram)
Design-Expert® Software Factor Coding: Actual yield (%) Design Points
5.03 27.41
X1 = A: Glucose X2 = C: sodium sulphate
B: potassium phosphate = 0.11 D: ammonium chloride = 0.17
0.01 0.06 0.11 0.15 0.20 22.3805 25 17.9711 10 10 1.00 2.00 3.00 4.00 5.00 6.00 7.00 8.00 9.00 10.00
Actual factors
D : a m m o ni u m c h lo ri d e ( g ra m )
yield (%)
C: sodium sulphate (milligram)
Design-Expert® Software Factor Coding: Actual yield (%) Design Points
5.03 27.41
X1 = C: sodium sulphate X2 = D: ammonium chloride
A: Glucose = 0.80 B: potassium phosphate = 0.11
0.30 0.24 0.17 0.11 0.05 22.3805 25 17.9711 10 10
1.00 2.00 3.00 4.00 5.00 6.00 7.00 8.00 9.0010.00 Actual factors
B : p o ta ss iu m p hos p ha te ( g ra m )
yield (%)
A: Glucose (gram)
Design-Expert® Software Factor Coding: Actual yield (%) Design Points
5.03 27.41
X1 = A: Glucose X2 = B: potassium phosphate
C: sodium sulphate = 5.50 D: ammonium chloride = 0.17
0.10 0.30 0.50 0.70 0.90 22.3805 25 17.9711 10 17.9711 0.01 0.06 0.11 0.15 0.20
Actual factors
1.10 1.30 1.50
C : so d ium s ul p h a te ( m il li gr a m )
yield (%)
B: potassium phosphate (gram)
Design-Expert® Software Factor Coding: Actual yield (%) Design Points
5.03 27.41
X1 = B: potassium phosphate X2 = C: sodium sulphate
A: Glucose = 0.80 D: ammonium chloride = 0.17
0.01 0.06 0.11 0.15 0.20 22.3805 25 17.9711 10 10 1.00 2.00 3.00 4.00 5.00 6.00 7.00 8.00 9.00 10.00
Actual factors
Fig 7: Contour plot – showing interaction of KH2PO4 and
Global J. Environ. Sci. Manage., 1 (1): 63-70, Winter 2015
Table 3: Actual and predicted values for RSM design
Run Order 1 2 3 4 5 6 7 8 9 1 0 1 1 1 2 1 3 1 4 1 5 1 6 1 7 1 8 1 9 2 0 2 1 2 2 2 3 2 4 2 5 2 6 2 7 2 8
Actual Value 13.60 17.20 14.17 24.20 18.45 15.27 15.56 15.80 6.38 23.85
5.73 6.50 7.12 5.14 6.34 9.02 8.24 5.03 26.34
5.58 8.80 5.83 6.05 13.70 11.53 6.54 27.41
5.37
Predicted Value 13.08 12.07 9.90 25.45 17.99 11.80 10.19 10.28 11.38 25.45 6.11 11.59
9.70 9.00 7.77 10.73
7.07 2.98 25.45
6.85 11.48
5.71 10.78 13.37 10.16 6.27 25.45
6.71
REFERENCES
Auling, G.; Pilz, F.; Busse, H.J.; Karrasch, M.; Streichan, M.; Schon, G., (1991). Analysis of polyphosphate accumulating microflora in phosphorus-eliminating, anaerobic-aerobic activated sludge systems by using diaminopropane as a biomarker for rapid estimation ofAcinetobacter spp.Appl. Environ. Microbiol., (57): 3585-3592 (8 pages). Bond, P.L.; Erhart, R.; Wagner, M.; Keller, J.; Blackall, L.L.,
(1999). Identification of some of the major groups of bacteria in efficient and non-efficient biological phosphorus removal activated sludge systems. Appl. Environ. Microbiol., 65(9): 4077-4088 (11 pages).
Dawes, E.A.; Senior, P.J., (1973). Energy reserve polymers in microorganisms. Adv. Microb. Physiol., (10): 178-203 (26 pages).
Florentz, M.; Granger, P., (1983). Phosphorus-31 nuclear magnetic resonance of activated sludge: Use for the study of the biological removal of phosphates from wastewater. Environ. Technol. Lett., (4): 9-12(4 pages).
Fuhs, G.W.; Chen, M., (1975). Microbial basis of Pi removal in the activated sludge process for the treatment of waste water. Microbial. Ecol., (2): 119-138(20 pages).
Microbial. Ecol., (2): 119-138(20 pages).
Geissdorfer, W.; Ratajczak, A.; Hillen, W., (1998). Transcription ofppk fromAcinetobacter sp. strain ADP1, encoding a putative polyphosphate kinase, is induced by phosphate starvation. Appl. Environ. Microbiol., (64): 896-901(6 pages).
Harold, F.M., (1966). Inorganic polyphosphates in biology: structure, metabolism, and Function Bacteriol. Rev., (30): 772-794(23 pages).
Jawad, A.; Hawkey, P. M.; Heritage, J.; Snelling, A. M., (1994). Descrip t ion of Leed s Aci ne to b ac te r M ed i um, a new selective and differential medium for isolation of clinically import an t Aci ne t ob ac te r spp. , an d c omp ari son wit h
Herellea agar and Holton’s agar. J. Clin. Microbiol., (32): 2353–2358 (6 pages).
Khoi, L.Q.; Diep, C. N., (2013). Isolation and phylogenetic analysis of polyphosphate accumulating organisms in water and sludge of intensive catfish ponds in the Mekong Delta, Vietnam American. J. Life Sci., 1(2): 61-71(11 pages). Kornberg, A., (1995). Inorganic polyphosphate: Towards
making a forgotten polymer Unforgettable. J. Bacteriol., 177(3): 491-496(6 pages).
Kornberg, A.; Fraley, C.D., (2000). Inorganic polyphosphate: a molecular fossil come to life ASM. News, (66): 275-280 (6 pages).
Kulaev, I.S., (1975). Biochemistry of inorganic polyphosphates. Rev. Physiol. Biochem. Pharmacal., (73): 131-158(28 pages).
Kulaev, I.S.; Vagabov, V. M., (1983). Polyphosphate metabolism in microorganisms. Adv. Microbiol. Physiol., (15): 731-738(8 pages).
Kulaev, I.S.; Vagabov, V. M.; Kulakovskaya, T.V., (1999). New aspects of inorganic polyphosphate metabolism and function. J. Biosci. Bioeng., .(88): 111-129(19 pages). Kulakovskaya, T.V.; Vagabov, V. M.; Kulaev, I. S., (2012).
Inorganic polyphosphates in industry, agriculture and medicine: Modern state and outlook. Process Biochem., (47): 1-10(10 pages).
Mino, T.; Van Loosdrecht, M. C. M.; Heijnen, J. J., (1998). Microbiology and biochemistry of the enhanced biological
phosphate removal process. Water Res., (32): 3193–3207
(15 pages).
Mullan, A.; Quinn, J. P.; McGrath, J. W., (2002). Enhanced Phosphate Uptake and Polyphosphate Accumulation in Burkholderia cepaciaGrown under Low-pH Conditions. Microb. Ecol., (44): 69-77(9 pages).
Oehmen, A.; Lemos, P. C.; Carvalho, G.; Yuan, Z.; Keller, J.; Blackall, L. L.; Reis, M. A. M., (2007). Advances in enhanced biological phosphorus removal: from micro to macro scale. Water Res., (41): 2272-2300(29 pages). Saheki, S.; Takeda, A.; Shimazu, T., (1985). Assay of inorganic
phosphate in the mild pH range, suitable for measurement of glycogen phosphorylase activity. Anla. Biochem., (148): 277-281(5 pages).
Serafim, L. S.; Lemos, P. C.; Levantesi, C.; Tandoi, V.; Santos, H.; Reis, M. A. M., (2002). Methods for detection and visualization of intracellular polymers stored by polyphosphate-accumulating microorganisms. J. Microbiol. Met., (51): 1-18(18 pages).
AUTHOR (S) BIOSKETCHES
Aravind, J., Ph.D. Assistant Professor, Faculty of Biotechnology Kumaraguru College of Technology Coimbatore, India. E-mail:[email protected]
Saranya, T.,Kumaraguru College of Technology. E-mail:[email protected]
Kanmani, P.,Kumaraguru College of Technology. E-mail:[email protected]
How to cite this article: (Harvard style)
Aravind, J.; Saranya, T.; Kanmani, P., (2015). Optimization and production of Polyphosphate from Acinetobacter towneri DSM 14962T HAM. Global J. Environ. Sci. Manage., 1 (1): 63-70.
with different processes for biological phosphorus removal FEMS. Microbiol. Ecol., (73), 113-124 (11 pages). Sun, Z.Y.; Zhao, L., (2002). Feasibility of calcium
polyphosphate fiber as scaffold materials for tendon tissue engineering in vitro. Zhongguo Xiu Fu Chong Jian Wai Ke
Za Zhi, (16): 426–428 (3 pages).
Suresh, N.; Warburg, R.; Timmerman, M.; Wells, J.; Coccia, M.; Roberts, M. F.; Halvorson, H. O., (1984). New strategies for the isolation of microorganisms responsible for phosphate accumulation [in] Enhanced Biological
phosphorus Removal from Wastewater”. Proceeding of the