www.nat-hazards-earth-syst-sci.net/14/67/2014/ doi:10.5194/nhess-14-67-2014
© Author(s) 2014. CC Attribution 3.0 License.
Natural Hazards
and Earth System
Sciences
Recent trends in daily temperature extremes over southern
Montenegro (1951–2010)
D. Buri´c1, J. Lukovi´c2, V. Duci´c1, J. Dragojlovi´c3, and M. Doderovi´c4
1Hydrometeorological Service of Montenegro, Podgorica, Montenegro 2University of Belgrade, Faculty of Geography, Belgrade, Serbia
3Faculty of Natural Sciences and Mathematics, Kosovska Mitrovica, Serbia 4Faculty of Philosophy, Nikši´c, Montenegro
Correspondence to:J. Lukovi´c ([email protected])
Received: 28 August 2013 – Published in Nat. Hazards Earth Syst. Sci. Discuss.: 1 October 2013 Revised: – – Accepted: 8 December 2013 – Published: 8 January 2014
Abstract.Montenegro so far has been poorly investigated in
terms of climate extremes. The aim of this paper was to anal-yse the extreme ETCCDI (Expert Team on Climate Change Detection and Indices) temperature indices in the Mediter-ranean region of Montenegro for the period of 1951–2010. Four stations in the coastal area of Montenegro have been analysed: Herceg Novi, Ulcinj, Budva and Bar. Two periods (before 1980 and after 1980) were separately investigated in this study due to a well-known climate shift that occurred in the late 1970s. Seven indices of temperature extremes have been chosen. The trend was analysed using a Mann– Kendall non-parametric test, while the slope was estimated using Sen’s slope estimator. A negative trend has been calcu-lated for cold nights and cold days at almost all stations. The most significant positive trends were obtained for warm con-ditions. The two separately investigated periods have shown contrasting temperature trends.
1 Introduction
There has been considerable interest in the study of temper-ature and precipitation extremes at different scales (Zolina, 2008; Durao et al., 2010; Ceasar et al., 2011) due to their great impact on agriculture, water resources, industry, en-vironment, and society. Since temperature records show an increase in the global mean temperature between 0.4 and 0.8◦C in the last 100 yr (IPCC, 2007), studies of
ex-treme temperature events have raised the interest of the sci-entific community. Many authors have made an effort to
examine extreme temperature trends in the Mediterranean region (Klein Tank and Können, 2003; Kostopoulou and Jones, 2005; Della-Marta et al., 2007; Kuglitsch et al., 2010; Efthymiadis et al., 2011). Most of their results suggest an in-creased frequency and duration of warm events. Warmer con-ditions over the Mediterranean may impact the environment and increase the burden on societies that are currently under economic turmoil. However, due to a non-uniform magni-tude of extreme temperature changes identified over the en-tire Mediterranean basin, many studies focused on particular countries. In Spain, numerous studies (Brunet et al., 2007; Rodriguez-Puebla et al., 2010) assessed trends in tempera-ture extremes, and Brunet et al. (2007) noted larger changes in high temperature extremes than in low temperature ex-tremes over the 20th century. While analysing temperature extreme indices in northeast Spain, El Kenawy et al. (2011) also observed more prevalent changes in hot extremes than in cold extremes. Toreti and Desiato (2008) analysed changes in temperature extremes over Italy and showed a cooling trend until the end of the 1970s followed by a warming trend over the last 25 yr. The most significant results they obtained were related to an increased number of summer days and tropical nights.
Table 1.List of the stations.
Station name WMO Period Latitude Longitude Elevation (N) (E) (m) Budva 13458 1951–2010 42◦17′ 18◦50′ 2.0
Herceg Novi 13455 1951–2010 42◦27′ 18◦31′ 10.0
Bar 13461 1951–2010 42◦06′ 19◦05′ 5.7
Ulcinj 13464 1951–2010 41◦55′ 19◦17′ 3.6
summer season. However, the neighbouring Mediterranean region of Montenegro has been poorly studied with regards to temperature extremes. This highlights the interest for our study, as it is the first one over the investigated area and may contribute to a better understanding of temperature changes in Montenegro.
The structure of the paper is as follows: Sect. 2 provides a description of the study area; Sect. 3 describes station data, indices and methods; Sect. 4 includes a discussion of the re-sults and conclusions are summarized in Sect. 5.
2 Study area
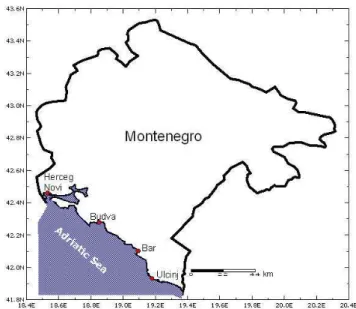
The study area comprises the Mediterranean region of Mon-tenegro, which covers an area of 1500 km2. It is sur-rounded by Orijen Mountain (1895 m), Lov´cen Mountain (1749 m), Sutorman Mountain (1180 m) and Rumija Moun-tain (1595 m). Montenegro has a varied topography with a narrow Adriatic coastline stretching along the southwest-ern part, a Karst region in the central part and high Di-naric Mountains (above 2000 m) in the northern parts. The coastal region is characterized by a typical Mediterranean climate while a moderate continental climate is present in the northern parts of the country. The average annual rain-fall is 2120 mm and the totals in the country generally de-crease from the southwest towards the northeast. The moun-tains in the southwest, receiving above 4000 mm of pre-cipitation, are the wettest part of the Mediterranean region (Duci´c et al., 2012).
3 Data and methodology
3.1 Data
In this paper, a daily temperature time series was used from meteorological stations Ulcinj, Bar, Herceg Novi and Budva (Table 1, Fig. 1) covering the period of 1951–2010. Data was obtained from the Hydro-meteorological Service of Montenegro.
The data were quality controlled for all stations follow-ing standards recommended by WMO (2004). Metadata was analysed regarding relocation and maloperation. The loca-tions of staloca-tions did not change throughout the investigated period and measurements were performed without a break using the same type of instruments. A time series
homo-Fig. 1.Locations of the stations.
geneity is a basic requirement when assessing changes in temperature extremes. Unfortunately, an advanced correc-tion method for a daily temperature time series is not de-veloped yet (Toreti et al., 2010). In this paper, data is care-fully evaluated by applying a Multiple Analysis of Series for Homogenization (MASH v3.02) method. The MASH method was developed in the Hungarian Meteorological Ser-vice (Szentimrey, 1994, 1999, 2003); it is a relative homo-geneity test that does not presume that the reference series are homogeneous (Costa and Soares, 2009). In this study a ver-sion of MASHv3.02 extended for homogenization of daily temperature data has been applied. Portions of the time se-ries with inhomogeneities were excluded from the analysis.
An Expert Team on Climate Change Detection and In-dices (ETCCDI), which is supported by the World Meteoro-logical Organization (WMO) Commission for Climatology, the Joint Commission for Oceanography and Marine Me-teorology (JCOMM) and the Research Program on Climate Variability and Predictability (CLIVAR) developed the list of temperature and precipitation indices used in this study.
In this paper, we selected a set of seven indices of tem-perature extremes (Table 2). Four indices are associated with warm temperature (SU, TR, Tn90p, Tx90p) and three indices with cold temperature (FD, Tx10p, Tn10p). All indices are defined in terms of the numbers of days that exceed either absolute or percentile thresholds.
Table 2.Definitions and abbreviations of the ETCCDI temperature indices used in this study.
Index Definition Units
FD Total number of frost days (days with absolute Tn Days (daily minimum temperature)<0◦C)
SU Number of summer days: Annual count of days when Tx Days (daily maximum temperature)>25◦C
TR Number of tropical nights: Annual count of days when Tn>20◦C Days Tn10p Days with Tn<10th percentile of daily Tn of the base period Days Tx10p Days with Tx<10th percentile of daily Tx of the base period Days Tn90p Days with Tn>90th percentile of daily Tn of the base period Days Tx90p Days with Tx>90th percentile of daily Tx of the base period Days
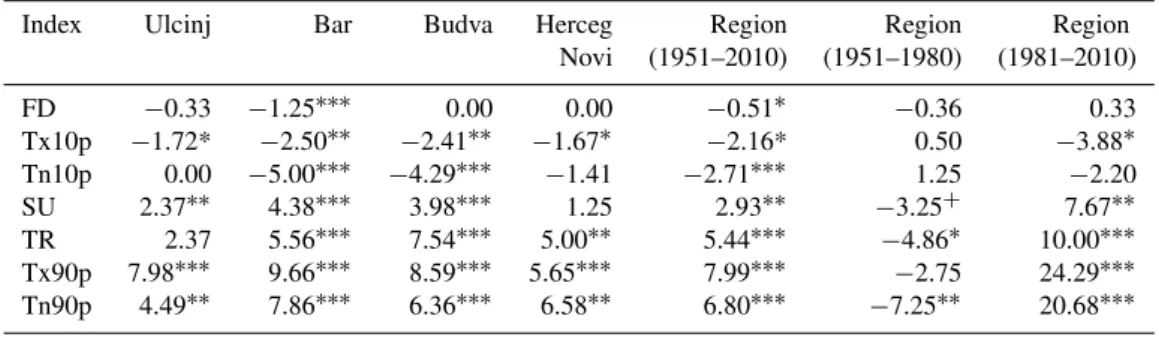
Table 3.Trends in temperature indices in the period 1951–2010 in days per decade (with statistical significance values:∗∗∗0.1 % level,
∗∗1 % level,∗5 % level and+10 % level).
Index Ulcinj Bar Budva Herceg Region Region Region Novi (1951–2010) (1951–1980) (1981–2010)
FD −0.33 −1.25∗∗∗ 0.00 0.00 −0.51∗ −0.36 0.33
Tx10p −1.72* −2.50∗∗ −2.41∗∗ −1.67∗ −2.16* 0.50 −3.88∗
Tn10p 0.00 −5.00∗∗∗ −4.29∗∗∗ −1.41 −2.71∗∗∗ 1.25 −2.20
SU 2.37∗∗ 4.38∗∗∗ 3.98∗∗∗ 1.25 2.93∗∗ −3.25+ 7.67∗∗
TR 2.37 5.56∗∗∗ 7.54∗∗∗ 5.00∗∗ 5.44∗∗∗ −4.86∗ 10.00∗∗∗
Tx90p 7.98∗∗∗ 9.66∗∗∗ 8.59∗∗∗ 5.65∗∗∗ 7.99∗∗∗ −2.75 24.29∗∗∗
Tn90p 4.49∗∗ 7.86∗∗∗ 6.36∗∗∗ 6.58∗∗ 6.80∗∗∗ −7.25∗∗ 20.68∗∗∗
3.2 Methodology
Percentile thresholds are determined empirically from the observed data series in the standard period of 1961–1990. The percentiles are calculated from five-day windows cen-tred on each calendar day to account for the mean annual cycle. A five-day window is chosen to yield a total sample size of 30 yr×5 days=150 data points for each calendar day, which results in a relatively smooth annual cycle of per-centile thresholds. The procedure ensures that extreme tem-perature events can occur with equal probability throughout the year (WMO, 2009).
The statistical significance of the calculated trends of the indices was tested using a Mann–Kendall test. This method has been applied because it is more suitable for non-parametric distributions. The Mann–Kendall test is used for trend analysis in ETCCDI workshops (Zhang et al., 2005). Sen’s (1968) slope estimator was used for estimating trends within the indices. This is a more robust approach for the estimation of trends in indices based on daily data.
4 Results and discussion
Seven temperature indices have been assessed for the coastal region of Montenegro. Stations have been analysed individ-ually and then the trend for the whole region was calculated. All stations indicate statistically significant increases in the
Tn90p index over the period of 1951–2010 showing the most consistent pattern of trends. There has been a temperature in-crease in the whole region as well (Table 3).
A very strong increase is also noted in Tx90p, as all sta-tions indicated significant increases. Percentile-based indices have shown an agreement in sign and significance of trend for stations individually and as a whole region when compared with global results. In coastal Montenegro, the frequency of warm nights and warm days increased while the frequency of cold nights and cold days decreased. Percentile indices are more robust over large areas as they account for local cli-mate effects (Caesar et al., 2011). Cold nights (Tn10p) have shown a negative trend that is significant for Bar, Budva and the whole region in 1951–2010. Similar to this, small and negative trends are calculated for cold days (Tx10p) and are significant for all stations.
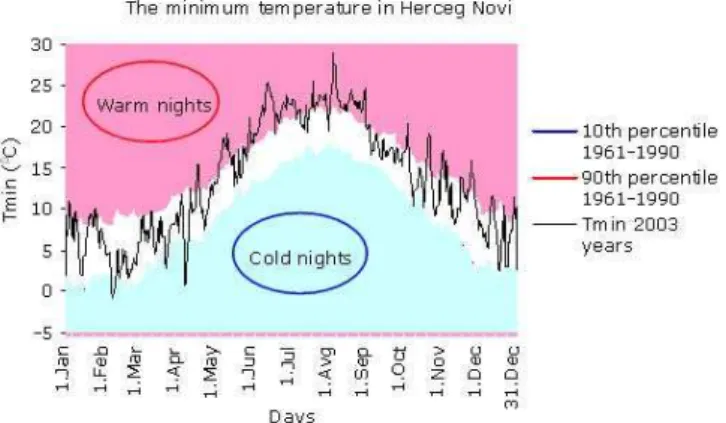
Fig. 2.Tn10p and Tn90p in Herceg Novi in 2003.
Summer days have shown strong statistically significant temperature increases for all stations with the exception of an insignificant trend for the Herceg Novi station. This reveals an increased number of days with a daily maximum tempera-ture above 25◦C over the study area during the warm season.
Tropical nights have also shown strong statistically signif-icant increases at all stations except for Ulcinj, indicating a tendency towards warmer conditions.
According to values of temperature indices, years 2003, 2007 and 2008 were particularly warm. For example, in 2003 in Herceg Novi there were 83 Tx90p, 133 SU, 117 Tn90p, 85 TR, only 17 Tx10p and 10 Tn10p with 1 FD. Figure 2 shows values of Tn10p and Tn90p in Herceg Novi in 2003. As can be seen in the figure, daily minimum temperatures were above the 10th percentile throughout the year. Atypical warmer conditions were detected in the capital city Podgor-ica in 2003, where daily maximum temperatures were 30◦C
and above from 27 May until 1 September (Buri´c et al., 2011). This heat wave was detected over western and cen-tral Europe during the summer of 2003 and is an example of an exceptional recent extreme. That summer was the hottest in instrumental records (IPCC, 2007).
Trends calculated for the Mediterranean part of Montene-gro have generally shown a tendency towards warmer con-ditions. Changes in warm indices are higher than changes in cold indices. Negative trends are calculated for cold nights, but the most significant trends are obtained in terms of warm conditions over the study area. The Bar station had the most pronounced shift with the strongest significance in general. This could be due to several reasons and include the fact that the process of urbanization has extended rapidly in the area over the past few decades, which may lead to urban islands of heat. Results for Ulcinj and Herceg Novi may not indicate the impact of urban heat island. These meteorological stations are located far from the town centre and the trend change for them is showing less significant results when compared to urban stations in Bar and Budva.
However, there has been a statistically significant increase in temperature in Montenegro over the second half of the
Fig. 3.Regional time series for warm nights and warm days (units:
days) in (left) the 1951–1980 period and (right) the 1981–2010 pe-riod. Dashed line indicates Sen’s slope estimator.
20th century (Buri´c, 2011). So far, there is no unique sci-entific opinion regarding the cause of such temperature in-creases. The greenhouse effect is not always responsible for temperature and precipitation variations, especially when in-ternal oscillations may also be a contributing factor (Lukovi´c et al., 2010).
5 Conclusions
In this paper, seven indices have been analysed in order to as-sess temperature extremes in the Mediterranean part of Mon-tenegro. The whole country, to date, has been poorly docu-mented in terms of climate extremes.
Results presented in this paper are in agreement with the global analysis of Alexander et al. (2006). A negative trend has been calculated for cold nights and cold days at almost all stations. The most significant trends are obtained for warm conditions over the investigated area during the period of 1951–2010. This is also in accordance with other regional analyses (Klein Tank et al., 2006).
The trend found in this study can be associated with the positive phase of the North Atlantic Oscillation (NAO) since this pattern is recognized as the main mode of climate vari-ability in the extratropical Northern Hemisphere (e.g. Hur-rell, 1995; Sun et al., 2009; del Río et al., 2011).
However, a separately investigated period of 1951–1980 for the region has shown opposite tendencies and a contrast-ing trend to the period of 1951–2010 as well as 1981–2010. This result is possibly due to a well-known climate shift that occurred in the late 1970s where there was a change in the sign of trend for warm days and warm nights. These two sep-arately investigated periods have shown contrasting temper-ature trends.
Future investigation should take into account other temper-ature indices as well as seasonal scales of the investigation.
Acknowledgements. This study was supported by the Serbian Ministry of Education and Science, under Grants No. III 43007.
Edited by: P. Nastos
Reviewed by: two anonymous referees
References
Alexander, L. V., Zhang, X., Peterson, T. C., Caesar, J., Gleason, B., Klein Tank, A. M. G., Haylock, M., Collins, D., Trewin, B., Rahimzadeh, F., Tagipour, A., Rupa Kumar, K., Revadekar, J., Griffiths, G., Vincent, L., Stephenson, D. B., Burn, J., Aguilar, E., Brunet, M., Taylor, M., New, M., Zhai, P., Rusticucci, M., and Vazquez-Aguirre, J. L.: Global observed changes in daily climate extremes of temperature and precipitation, J. Geophys. Res., 111, D05109, doi:10.1029/2005JD006290, 2006.
Balling, R. C., Michaels, P. J., and Knappenberger, P. C.: Analy-sis of winter and summer warming rates in gridded temperature timeseries, Clim. Res., 9, 175–181, 1998.
Brunet, M., Sigro, J., Jones, P. D., Saladie, O., Aguilar, E., Moberg, A., and Walter, A.: Long- term changes in extreme temperatures and precipitation in Spain, Contribution to Science, 3, 331–342, 2007.
Buri´c, D.: Indices of temperature and precipitation extremes in Pod-gorica 1951–2008, Collection of papers of Institute of Geography “Jovan Cviji´c”, SANU, 61, 31–41, 2011.
Buri´c, D., Duci´c, V., and Lukovi´c, J.: Climate variability in Mon-tenegro in second half of the XX and the beginning of the XXI century, Montenegrin Academy of Sciences and Arts, Podgorica, 2011.
Caesar, J., Alexander, L. V., Trewin, B., Tse-ring, K., Sorany, L., Vuniyayawa, V., Keosavang, N., Shimana, A., Htay, M. M., Kar-macharya, J., Jayasinghearachchi, D. A., Sakkamart, J., Soares, E., Hung, L. T., Thuong, L. T., Hue, C. T., Dung, N. T. T., Hung, P. V., Cuong, H. D., Cuong N. M., and Sirabaha, S.: Changes in temperature and precipitation extremes over the Indo-Pacific region from 1971–2005, Int. J. Climatol., 31, 791–801, 2011. Costa, A. C. and Soares, A.: Homogenization of Climate Data:
Re-view and New Perspectives Using Geostatistics, Math. Geosci., 41, 291–305, 2009.
del Río, S., Herrero, L., Pinto-Gomes, C., and Penas, A.: Spatial analysis of mean temperature trends in Spain over the period 1961–2006, Glob. Planet. Change, 78, 65–75, 2011.
Della-Marta, P. M., Haylock, M. R., Luterbacher, J., and Wanner, H.: Doubled length of western European summer heat waves since 1880, J. Geophys. Res., 112, D15103, doi:10.1029/2007JD008510, 2007.
Duci´c, V., Lukovi´c, J., Buri´c, D., Stanojevi´c, G., and Mustafi´c, S.: Precipitation extremes in the wettest Mediterranean region (Krivošije) and associated atmospheric circulation types, Nat. Hazards Earth Syst. Sci., 12, 687–697, doi:10.5194/nhess-12-687-2012, 2012.
Durao, R., Pereira, M., Costa, M. J., Delgado, A. C., del Barriod, J., and Soares, A.: Spatial–temporal dynamics of precipitation extremes in southern Portugal: a geostatistical assessment study, Int. J. Climatol., 30, 1526–1537, 2010.
Efthymiadis, D., Goodess, C. M., and Jones, P. D.: Trends in Mediterranean gridded temperature extremes and large-scale cir-culation influences, Nat. Hazards Earth Syst. Sci., 11, 2199– 2214, 2011,
http://www.nat-hazards-earth-syst-sci.net/11/2199/2011/. El Kenawy, A. M., López-Moreno, J. I., and Vicente-Serrano, S.
M.: Recent trends in daily temperature extremes over northeast-ern Spain (1960–2006), Nat. Hazards Earth Syst. Sci., 11, 2583– 2603, 2011,
http://www.nat-hazards-earth-syst-sci.net/11/2583/2011/. Frich, P., Alexander, L. V., Della-Marta, P., Gleason, B., Haylock,
M., Klein-Tank, A. M. G., and Peterson, T.: Observed coherent changes in climatic extremes during second half of the twentieth century, Clim. Res., 19, 193–212, doi:10.3354/cr019193, 2002. Gurevich, G., Hadad, Y., Ofir, A., and Ohayon, B.: Statistical
anal-ysis of temperature changes in Israel: an application of change point detection and estimation techniques, Global NEST Journal, 13, 215–228, 2011.
Hurrell, J. W.: Decadal trends in the North-Atlantic Oscillation: regional temperatures and precipitation, Science 269, 676–679, 1995.
Klein Tank, A. M. G. and Kónnen, G. P.: Trends in indices of daily temperature and precipitation extremes in Europe, 1946–99, J. Climate, 16, 3665–3680, 2003.
Klein Tank, A. M. G., Wijngaard, J. B., Können, G. P., Böhm, R., Demarée, G., Gocheva, A., Mileta, M., Pashiardis, S., Hejkr-lik, L., Kern-Hansen, C., Heino, R., Bessemoulin, P., Müller-Westermeier, G., Tzanakou, M., Szalai, S., Pálsdóttir, T., Fitzger-ald, D., Rubin, S., Capaldo, M., Maugeri, M., Leitass, A., Bukan-tis, A., Aberfeld, R., van Engelen, A. F. V., Forland, E., Mietus, M., Coelho, F., Mares, C., Razuvaev, V., Nieplova, E., Cegnar, T., Antonio López, J., Dahlström, B., Moberg, A., Kirchhofer, W., Ceylan, A., Pachaliuk, O.,Alexander, L. V., and Petrovic, P.: Daily dataset of 20th-century surface air temperature and precip-itation series for the European Climate Assessment, Internat. J. Climatol., 22, 1441–1453, 2002.
Klein Tank, A. M. G., Peterson, T. C., Quadir, D. A., Dorji, S., Zou, X., Tang, H., Santhosh, K., Joshi, U. R., Jaswal, A. K., Kolli, R. K., Sikder, A., Deshpande, N. R., Revadekar, J. V., Yeleuova, K., Vandasheva, S., Faleyeva, M., Gomboluudev, P., Budhathoki, K. P., Hussain, A., Afzaal, M., Chandrapala, L., Anvar, H., Aman-murad, D., Asanova, V. S., Jones, P. D., New, M. G., and Spek-torman, T.: Changes in daily temperature and precipitation ex-tremes in central and south Asia, J. Geophys. Res., 111, D16105, doi:10.1029/2005JD006316, 2006.
Kostopoulou, E. and Jones, P. D.: Assessment of climate extremes in the Eastern Mediterranean, Meteorol. Atmos. Phys., 89, 69– 85, 2005.
Kuglitsch, F. G., Toreti, A., Xoplaki, E., Della-Marta, P. M., Zere-fos, C., Türke¸s, M., and Luterbacher, J.: Heat wave changes in the eastern Mediterranean since 1960, Geophys. Res. Lett., 37, L0482, doi:10.1029/2009GL041841, 2010.
Lucie, A. Vincent and Éva Mekis.: Changes in Daily and Extreme Temperature and Precipitation Indices for Canada over the Twen-tieth Century, Atmos.-Oc., 44, 177–193, 2006.
Lukovi´c, J., Manojlovi´c, P., and Mustafi´c. S.: Temperature change in Serbia and NAO, Bulletin of Serbian Geographical Society, tome XC, 1, 123–130, 2010.
Peterson, T. C., Folland, C., Gruza, G., Hogg, W., Mokssit, A., and Plummer, N.: Report on the activities of the Working Group on Climate Change Detection and Related Rapporteurs 1998–2001. World Meteorological Organisation Rep. WMO-TD No. 1071, WCDMP-No. 47, Geneva, Switzerland, 143 pp., 2001.
Rodriguez-Puebla, C., Encinas, A. H., García-Casado, L. A., and Nieto, S.: Trends in warm days and cold nights over the Iberian Peninsula: relationships to large-scale variables, Clim. Change, 100, 667–684, 2009.
Sen, P. K.: Estimates of the regression coefficient based on Kendall’s tau, J. Am. Statis. Assoc., 63, 1379–1389, 1968. Sun, J. Q., Wang, H. J., and Yuan, W.: Role of the tropical
At-lantic sea surface temperature in the decadal change of the sum-mer North Atlantic Oscillation, J. Geophys. Res. Atmos., 114, D20110, doi:10.1029/2009JD012395, 2009.
Szentimrey, T.: Statistical problems connected with the homoge-nization of climatic time series, in: Climate variations in Europe, Proceedings of the European workshop held in Kirkkonummi (Majvik), edited by: Heino, R., Finland, May 1994, Publications of the Academy of Finland, 330–339, 1994.
Szentimrey, T.: Multiple analysis of series for homogenization (MASH), in: Proceedings of the second seminar for homogeniza-tion of surface climatological data, Budapest, Hungary, WMOTD No. 962, WCDMP No. 41, 27–46, 1999.
Szentimrey, T.: Multiple analysis of series for homogenization (MASH); Verification procedure for homogenized time series, in: Fourth seminar for homogenization and quality control in cli-matological databases, Budapest, Hungary, WMO-TD No. 1236, WCDMP No. 56, 193–201, 2003.
Toreti, A. and Desiato, F.: Changes in temperature extremes over Italy in the last 44 years, Internat. J. Climatol., 28, 733–745, 2008.
Toreti, A., Kuglitsch, F. G., Xoplaki, E., Maraun, D., Wanner, H., and Luterbacher, J.: Characterization of extreme winter precip-itation in the Mediterranean and associated anomalous atmo-spheric circulation patterns. Nat.Hazards Earth Syst. Sci., 10, 1037–1050, 2010.
Unkaševi´c, M. and Toši´c, I.: Trends in temperature indices over Ser-bia: relationships to large-scale circulation patterns, Int. J. Clima-tol., 33, 3152–3161, 2013.
World Meteorological Organization (WMO): Report of the CCI/CLIVAR expert team on climate change detection, moni-toring and indices (ETCCDMI), Geneve: World Meteorological Organization, 2004.
World Meteorological Organization (WMO): Guidelines on Anal-ysis of extremes in a changing climate in support of informed decisions for adaptation. Geneva 2, Switzerland, Climate Data and Monitoring WCDMP-No. 72, 2009.
Zhang, X., Aguilar, E., Sensoy, S., Melkonyan, H., Tagiyeva, U., Ahmed, N., Kutaladze, N., Rahimzadeh, F., Taghipour, F., Han-tosh, T. H., Albert, P., Semawi, M., Ali, M. K., Al-Shabibi, M. H. S., Al-Oulan, Z., Zatari, T., Khelet, I. A. D., Hamoud, S., Sa-gir, R., Demircan, M., Eken, M., Adiguzel, M., Alexander, L., Peterson, T. C., and Wallis, T.: Trends in Middle East climate ex-treme indices from 1950 to 2003, J. Geophys. Res., 110, D22104, doi:10.1029/2005JD006181, 2005.