Nuclear Accumulation of an Uncapped RNA Produced by
Drosha Cleavage of a Transcript Encoding miR-10b and
HOXD4
Sze Lynn Calista Phua1, V. Sivakamasundari2, Yu Shao1, Xiaohan Cai1, Li-Feng Zhang1, Thomas Lufkin2, Mark Featherstone1*
1School of Biological Sciences, Nanyang Technological University, Singapore,2Genome Institute of Singapore, Singapore
Abstract
Patterning of the animal embryo’s antero-posterior (AP) axis is dependent on spatially and temporally regulated Hox gene expression. The murine Hoxd4gene has been proposed to harbour two promoters, an upstream promoter P2, and a downstream promoter P1, that lie 5.2 and 1.1 kilobase pairs (kb) upstream of the coding region respectively. The evolutionarily conservedmicroRNA-10b(miR-10b) gene lies in theHoxd4genomic locus in the intron separating the non-coding exons 4 and 5 of the P2 transcript and directly adjacent to the proposed P1 promoter.Hoxd4 transcription is regulated by a 39neural enhancer that harbours a retinoic acid response element (RARE). Here, we show that the expression profiles ofHoxd4andmiR-10btranscripts during neural differentiation of mouse embryonal carcinoma (EC) P19 cells are co-ordinately regulated, suggesting that both Hoxd4 and miR-10b expression is governed by the neural enhancer. Our observation that P1 transcripts are uncapped, together with the mapping of their 59ends, strongly suggests that they are generated by Drosha cleavage of P2 transcripts rather than by transcriptional initiation. This is supported by the colocalization of P1 and P2 transcripts to the same posterior expression domain in the mouse embryo. These uncapped P1 transcripts do not appear to possess an Internal Ribosomal Entry Site (IRES), but accumulate within multiple punctate bodies within the nucleus suggesting that they play a functional role. Finally, similar uncapped Drosha-cleaved P1-like transcripts originating from the paralogousHoxb4/miR-10alocus were also identified. We propose that these transcripts may belong to a novel class of regulatory RNAs.
Citation:Phua SLC, Sivakamasundari V, Shao Y, Cai X, Zhang L-F, et al. (2011) Nuclear Accumulation of an Uncapped RNA Produced by Drosha Cleavage of a Transcript Encoding miR-10b and HOXD4. PLoS ONE 6(10): e25689. doi:10.1371/journal.pone.0025689
Editor:Laszlo Tora, Institute of Genetics and Molecular and Cellular Biology, France
ReceivedJuly 13, 2011;AcceptedSeptember 8, 2011;PublishedOctober 3, 2011
Copyright:ß2011 Phua et al. This is an open-access article distributed under the terms of the Creative Commons Attribution License, which permits unrestricted use, distribution, and reproduction in any medium, provided the original author and source are credited.
Funding:This work was supported by Biomedical Research Council (Singapore) grant number 07/1/22/19/5 (MF), the Agency for Science, Technology and Research (A*STAR) of Singapore (TL), and Singapore Stem Cell Consortium grant number SSCC-09-015 (LFZ). The Biomedical Research Council (BMRC, Singapore) vetted the manuscript for potentially patentable material. The remaining funders had no role in study design, data collection and analysis, decision to publish, or preparation of the manuscript.
Competing Interests:The authors have declared that no competing interests exist. * E-mail: [email protected]
Introduction
MicroRNAs are a class of highly conserved small noncoding RNAs (ncRNAs) expressed in a wide range of organisms [1,2]. Like proteins, many miRNAs are encoded by genes transcribed by RNA Polymerase II to give a long primary microRNA (pri-miRNA) transcript which is 59-capped and 39-polyadenylated. The pri-miRNA forms a hairpin-loop structure that is cleaved at its base by an RNAse III enzyme, Drosha, to form the precursor microRNA (pre-miRNA) which is exported out of the nucleus and then cleaved again on the loop side of the hairpin by another RNAse III enzyme, Dicer. This generates an miRNA: miRNA* duplex, one strand of which is preferentially selected and incorporated into the RNA-induced silencing complex (RISC). The single stranded mature miRNA is typically 21–23 nucleotides long and functions by base-pairing to target complementary mRNAs to regulate gene expression. In animals, this regulation occurs mostly, but not always, at the post-transcriptional level [3]. Recent evidence suggests that miRNAs are also able to epigenetically silence genes at the transcriptional level [4].
Homeobox (Hox) genes encode homeodomain-containing transcription factors that control segmental patterning and determine the identity of embryonic regions along the AP axis before and during gastrulation in the mouse [5,6]. They are highly conserved and found to be essential for normal development in all species where they have been tested [7]. Homeotic transformations and malformations in the embryo arise when Hox gene expression is deregulated by either a loss or gain of function, and the precise spatio-temporal control of their expression is therefore critical to normal development [6,8,9].
In mammals, there are 39 Hox genes organized in 4 paralogous
Hoxclusters, A–D (Fig 1A). There are three known microRNAs or miRNA families embedded in vertebrate Hox clusters: miR-10,
differs by a single nucleotide.miR-10a, located upstream ofHoxb4, was reported to repress Hoxd4 transcription by targeting its promoter region in human breast cancer cells [13]. miR-10b is found 59 toHoxd4and regulates metastasis and cell migration in human breast cancer cellsviasuppression ofHoxd10[14–16]. It is also known to be upregulated in malignant gliomas [17], pancreatic cancer [18] and chronic lymphocytic leukemia [19].
miR-10a and miR-10b are expressed in the central nervous system and trunk in a sub-domain of the Hoxb4 and Hoxd4
expression domains. This spatio-temporal restriction along the AP axis is reminiscent of Hox gene expression and is conserved in many animals such asDrosophila, zebrafish and mouse [20–23].
Hoxd4patterns the anterior cervical skeleton of the mouse, and has been implicated in acute lymphoblastic leukemia [24–27]. Two Hoxd4promoters, an upstream promoter termed P2 and a downstream promoter termed P1 (Fig. 1B) have been deduced from the results of S1 nuclease and RNase protection assays, and 59 Rapid Amplification of cDNA Ends (59RACE) [26]. While these are rigorous methods to map the 59ends of RNA transcripts, they do not reveal whether these 59ends are capped.
In the mouse, the full Hoxd4 expression domain in the developing central nervous system has an anterior limit at the boundary between rhombomeres 6 and 7 (r6/7) of the embryonic hindbrain. A region termed the 39neural enhancer (39 NE) is essential for r6/7-restrictedHoxd4expression in the central nervous system of the developing mouse embryo as well as in differentiating P19 cells [28–34]. However, a subset of
Hoxd4transcripts originating from an upstream promoter (P2) is expressed more posteriorly at a level just above the forelimb bud. miR-10b is expressed in a similar temporal and spatial pattern as the Hoxd4 P2 transcripts in the developing E9.5 mouse embryo, with an anterior expression border that is considerably posterior to the r6/7 anterior expression border [23,26]. The anterior expression border ofmiR-10a is likewise posterior to the r6/7 expression border of the fullHoxb4domain [20]. In zebrafish,miR-10bis expressed in the spinal cord with an anterior boundary somewhat posterior to the r6/7 boundary [35]. The zebrafishmiR-10family is also found to represshoxb1a
and hoxb3a within the spinal cord in cooperation with hoxb4a
[35].
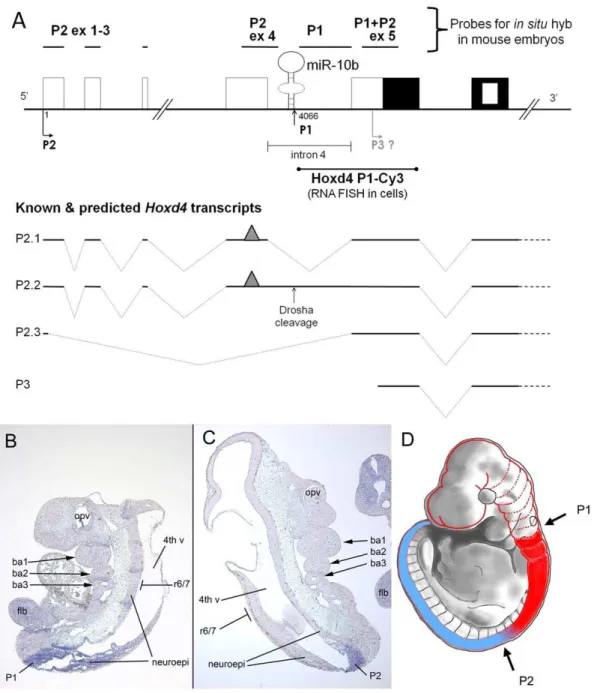
Figure 1. Hox genes and their associated microRNAs.(A) A schematic of the four mammalian Hox clusters (HoxA through HoxD) and the position of the microRNAs embedded within them [20]. The indicated direction of transcription applies to all four Hox clusters. (B) A schematic showing the genomic organization of the mouseHoxd4gene. Empty boxes indicate non-coding exons and black boxes indicate coding exons. The nested white box indicates the homeobox within the second coding exon. Grey boxes show regulatory elements. P2 denotes the upstream promoter and P1 denotes the putative downstream promoter.miR-10bis found directly upstream of the P1 promoter, in intron 4 of the P2 transcript. Dotted lines indicate spliced introns. The grey diamond at the 59end of the P2 transcript denotes the 597-methylguanosine (m7G) cap and the circled ‘‘P’’ at the 59end of the P1 transcript indicates a 59phosphate. The positions of two 200 bp regions amplified by qRT-PCR (qRT-PCR:P2 and qRT-PCR:P1+P2) are indicated by vertical arrows (see figure 2).
The location of mouse miR-10b immediately adjacent to the presumptive P1 transcriptional start site and within the intron separating exons 4 and 5 of the P2 transcript (Fig. 1B) raised several questions regardingHoxd4and the biogenesis ofmiR-10b. First, P2 may serve to encode both HOXD4 andmiR-10b. In other words, the Hoxd4 P2 transcript could also serve as the primary
miR-10btranscript that is the substrate for processing by Drosha. Second, expression of the Hoxd4/miR-10b transcript may be dependent on the neural enhancer located 39to theHoxd4coding region. Third, the previously mapped 59 end of the Hoxd4 P1 transcript may not be generated by transcriptional initiation but by the cleavage of theHoxd4P2 transcript by Drosha (Fig. 1B).
Here, we show that these three hypotheses are correct. In addition, though P1 transcripts are not capped, they are abundant and largely localized to punctate sub-nuclear bodies.
Results
The expression ofHoxd4andmiR-10bis co-ordinately regulated in differentiating P19 cells
To determine if the expression of pri-miR-10bis controlled by the
Hoxd4neural enhancer, the relative levels ofHoxd4P1, P2 and miR-10b transcripts were measured in differentiating P19 mouse EC cells. P19 cells can be induced to undergo neuronal differentiation by treatment with all-transretinoic acid (RA) and cell aggregation [36]. P19 neural differentiation recapitulates aspects of normal embryonic differentiation whereby Hox genes are expressed
sequentially in a colinear manner [33,37–40]. AllHoxd4 P1, P2 andmiR-10btranscripts were barely detectable in undifferentiated P19 cells (Fig 2, P1, P2, miR-10b at 0 h). The accumulation ofnestin
transcripts, a neural lineage marker, served as a marker for the P19 differentiation process.Hoxd4 P1 and P2 transcripts were highly induced during P19 differentiation, peaking at maximum levels on day 3 of differentiation (Fig 2, P1, P2 at D3). In a fashion similar to theHoxd4transcripts, themiR-10btranscripts were first expressed at very low levels in undifferentiated cells and were then strongly induced upon RA treatment and aggregation, peaking at day 4 (Fig 2, miR-10b at D4). When compared to theHoxd4P1 and P2 transcripts, we observed that themiR-10bpeaked a day later, on day 4. This delay in the expression peak may reflect differences in processing or stability; however, the overall expression profile is similar. This is in contrast to the expression profiles of other Hox genes such asHoxa1which is induced by 6 h and peaks as early as 48 h of neural differentiation [37,39].
In summary, miR-10b expression was shown to be induced together withHoxd4P1 and P2 transcripts during P19 differen-tiation. These data are consistent with a role for the Hoxd4 39 neural enhancer in directing expression of bothHoxd4and miR-10btranscripts.
Hoxd4transcripts originating from P1 are generated by Drosha cleavage
To determine ifHoxd4P1 transcripts are generated by Drosha cleavage or transcriptional initiation, an RNA-ligase mediated 59
Figure 2. Expression profiles ofHoxd4 P1, P2 andmiR-10bin differentiating P19 cells.qRT-PCR was carried out on cDNA derived from P19 cells undergoing neural differentiation. The levels of the transcripts were arbitrarily assigned 100% at the time point where they peaked. Transcripts ofnestin, a marker of neural differentiation, accumulated with time during P19 differentiation, peaking by day 4 (D4).miR-10bexpression was induced together withHoxd4P1 and P2 transcripts and likewise peaked on day 4 (D4). P1, P2 and nestin were normalized to 18S RNA; miR-10bwas normalized to U6 snoRNA. For specific detection of P2 transcripts only, or P1 plus P2 transcripts, primers were designed to amplify regions of approximately 200 bp whose positions are shown in figure 1B. Data represent two independent experiments, each shown as the average of qPCR technical duplicates. Dark grey bars: independent experiment 1 (IE 1); light grey bars: independent experiment 2 (IE 2).
doi:10.1371/journal.pone.0025689.g002
Rapid Amplification of cDNA Ends (59 RLM-RACE) was performed. Transcripts whose 59 ends are generated by Drosha cleavage will bear a 59phosphate and will be suitable substrates for RNA ligase, unlike intact transcripts synthesized by RNA pol II which will have a 59 7-methylguanosine (59 m7G) cap and therefore be unable to participate in RNA-ligase-mediated reactions.
Total RNA from P19 cells on day 3 of differentiation was collected. An aliquot was treated with calf intestinal phosphatase (CIP) to remove all free 59 phosphates in the total RNA. An aliquot of the CIP-treated RNA was subsequently treated with tobacco acid pyrophosphatase (TAP), which removes the 59cap on mRNA transcripts to leave a free 59phosphate. This was followed by ligation of all three RNA samples (untreated, CIP-treated and CIP/TAP-treated) to a synthetic RNA oligonucleotide and RT-PCR. Only transcripts bearing a 59phosphate, such as produced by Drosha cleavage (Fig 1B), can be amplified from untreated RNA samples. The untreated RNA sample gave a band of approximately 190 bp after PCR, which corresponded to the 188 bp from the primer to the predicted Drosha cleavage site (Fig 3A, arrowhead). Moreover, no comparably sized products were amplified from the CIP/TAP-treated RNA which would have allowed detection of capped transcripts (Fig 3A). The mRNA for a b-actin control was amplified only following treatment with both CIP and TAP (Fig 3A, arrow), as expected for a capped transcript. Next, we confirmed the presence of these presumptive Drosha-cleaved P1 transcripts in the mouse embryo. The otic vesicle is a morphological landmark that lies just anterior to the Hoxd4
expression border at r6/7. Embryonic day (E) E9.5 mouse embryos were therefore bisected just anterior to the developing otic vesicle and RNA extracted from anterior (Hoxd4-negative) and posterior (Hoxd4-expressing) tissues followed by 59 RLM-RACE. The 188 bp band indicating the presence of Drosha-cleaved P1 transcripts was amplified only from posterior tissue (Fig 3B). This demonstrates that the presumptive Drosha-cleaved P1 transcripts are generated during normal mouse embryonic development and only in embryonic regions expressingHoxd4.
The approximately 188 bp band derived from P19 cell RNA was then cloned and sequenced. The 59 ends of all four clones began with 59-TATGG-39, mapping precisely to the predicted Drosha cleavage site on the pri-miR-10btranscript, 11 nt from the base of the pri-miRNA stem junction [41]. Importantly, this site is within one nucleotide of the previously deduced P1 start site cluster. Together, these observations suggest that P1 transcripts are generated by Drosha cleavage of the primary microRNA for
miR-10b. The most likely origin for pri-miR-10b is a transcript initiating at P2 (Fig. 1B). In other words, pri-miR-10b and the
Hoxd4P2 transcript are one and the same.
Drosha cleavage of theHoxb4/pri-miR-10atranscript generates similar uncappedHoxb4transcripts
Similar to miR-10b and Hoxd4, miR-10a is located in a conserved position 59toHoxb4(Fig. 1A). qPCR analysis showed that bothmiR-10aandHoxb4transcripts are induced in a similar manner to miR-10b and Hoxd4 transcripts during RA-induced P19 neural differentiation (unpublished observations). To deter-mine if there was a Drosha-cleavedHoxb4/pri-miR-10atranscript paralogous toHoxd4 P1, we carried out 59-RLM-RACE with a
Hoxb4-specific reverse primer (RACE-Hoxb4-R). Only the untreated RNA sample gave an amplification product of 300 bp corresponding to the distance between the reverse primer and the predicted Drosha cleavage site (Fig 3C, arrow). Sequencing of the Hoxb4 PCR product confirmed that it is indeed Hoxb4-specific, mapping it to the predicted Drosha
cleavage site precisely 11 nt from the base of the pri-miRNA stem junction, just as for Hoxd4 (Fig 3D). This indicated the presence of similar uncapped Drosha-cleavedHoxb4transcripts in differentiating P19 cells, suggesting that they may belong to a novel class of RNA species.
Drosha-cleavedHoxd4P1 and P2/pri-miR-10btranscripts are all expressed posterior to the rhombomere 6/7 boundary in the mouse embryo
Using a probe against the Hoxd4 59 coding and non-coding region (P1+P2 ex5, Fig. 4A),Hoxd4transcripts have been shown to have an anterior expression boundary between r6 and r7 within the developing hindbrain of mice. This expression border is conserved in zebrafish [23,26]. By contrast, a probe that specifically detected P2 transcripts (probe name = P2 ex4, Fig. 4A) revealed a more posterior expression boundary in the anterior spinal cord above the forelimb bud [26]. Thus, the anterior part of the Hoxd4 expression domain up to r6/7 was attributed to the activity of a distinct P1 promoter. However, given our observation that P1 transcripts are likely generated by Drosha cleavage of P2 transcripts, and therefore do not originate from a transcriptional start site, we re-visited the spatial distribution of P1 and P2 transcripts in the mouse embryo.
We designed two new in situ hybridization probes to more precisely investigate the expression of these different transcripts in the embryo. First, a P1 probe was designed to be just downstream ofmiR-10band spanning the 59untranslated region (59UTR) of the Drosha-cleaved P1 transcripts (probe name = P1, Fig. 4A). This region is spliced out in the P2 transcripts and thus the P1 probe will specifically detect P1 transcripts only. A second probe (probe name = P2 ex 1–3, Fig. 4A), spans the first 3 exons of the P2 transcript and detects P2 transcripts only.In situhybridizations with both the P1 and P2 ex 1–3 probes showed an expression domain that is posterior to the r6/7 boundary, similar to the expression domain of maturemiR-10bin the E9.5 embryo. Neither probe detected more anterior expression up to the r6/7 boundary (Fig 4B, C, D). We conclude that P1 transcripts are derived by Drosha-cleavage of transcripts originating at the posteriorly active P2 promoter. The more anterior expression (up to r6/7) previously detected with probe P1+P2 ex 5 may be due to the action of a more anteriorly active promoter (hypothetical transcript P3, Fig. 4A). Alternatively, P2 may be the onlyHoxd4promoter, but the presence or absence of destabilizing elements due to differential splicing determines whether P2-derived transcripts accumulate at anterior or posterior positions (hypothetical transcript P2.3, Fig. 4A).
Drosha-cleaved P1 transcripts are abundant in the nucleus
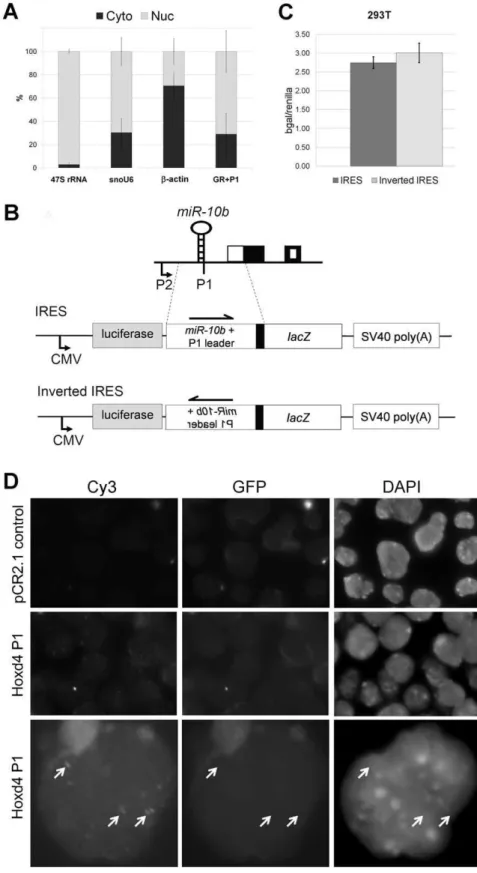
We determined that P1 transcripts are generated by Drosha cleavage. However, these uncapped P1 transcripts appeared to be abundant in differentiating P19 cells (Fig 2) and the mouse embryo (Fig 3B) [26]. We therefore asked if these abundant, uncapped P1 transcripts may have a function. As a first indication, we determined whether the uncapped P1 transcripts were present in the cytoplasm or nucleus.
Absence of robust IRES activity within the 59UTR of P1 transcripts
The presence of approximately one quarter of P1 transcripts in the cytoplasm suggested that they may be translatedviaan IRES. To determine whether the 59UTR of the cleaved P1 transcript has IRES activity, an IRES reporter assay was designed. The IRES reporter consisted of a firefly luciferase cassette driven by a CMV promoter, followed by the putative IRES region drivinglacZgene expression and ending with an SV40 polyadenylation signal. The ‘‘Inverted IRES’’ construct had the putative IRES region inverted and cloned in the same position within the vector and served as a negative baseline control (Fig 5B). Any increase inb-galactosidase levels of the IRES construct compared to the Inverted IRES construct would thus reflect IRES activity.
The IRES test plasmids were co-transfected with control renilla luciferase expression vectors in either HEK293T cells or RA-treated P19 cells. Cell lysates were assayed at 48 h post-transfection and b-galactosidase was normalized to renilla luciferase activity to account for variations in transfection efficiency. No significant IRES activity was observed in the HEK293T cells (Fig 5C). There was also no significant b
-galactosidase activity in transfected and RA-treated P19 cells compared to untransfected cells (data not shown). This suggests that the Drosha-cleaved P1 transcripts are not translated through an IRES. This result also indicates the absence of any additional promoter activity in the putative IRES region that stretches for about 1 kilobase pairs upstream from theHoxd4 coding region. Efficient cleavage of the IRES reporter fusion transcript by Drosha was evident from the fact that firefly luciferase activity derived from this reporter was low by comparison to that obtained with the Inverted IRES reporter (data not shown).
Hoxd4P1 transcripts localize to punctate nuclear bodies We performed RNA fluorescence in situ hybridization (RNA FISH) to determine sub-localization of nascent Hoxd4 and P1 transcripts in day 3 differentiated P19 cells. A Cy3-labelledHoxd4
P1 probe spanning 1.5 kb extending from the Drosha cleavage site to the Hoxd4 coding region (Fig 4A) yielded multiple signals corresponding to punctate nuclear bodies (Fig 5D, middle and bottom rows). A negative control Cy3-labelled probe (pCR2.1 control) yielded no specific signal (Fig 5D, top row). Likewise, undifferentiated P19 cells which do not expressHoxd4did not yield
Figure 3.Hoxd4 P1 transcripts are generated by Drosha cleavage.(A) Presence of uncapped P1 transcripts. The untreated sample (U) gave an approximately 188 bp amplification product (arrowhead). As a positive control, an expected 900 bp product fromb-actin is amplified only when the RNA has been treated with CIP and then TAP (arrow). NTC: no template control; U: untreated RNA; CIP: CIP-treated RNA; CIP/TAP: CIP and TAP-treated RNA. (B) Uncapped P1 transcripts are present only in posterior tissues of the mouse embryo. Untreated (U) RNA from the posterior tissues of two different mouse embryos (P.1, P.2) gave a 188 bp amplification product by RT-PCR that corresponds to the presence of uncapped P1 transcripts (black arrowhead). This band is at background levels in anterior tissues of two mouse embryos (A.1, A.2) whereHoxd4is not expressed. M: molecular weight markers. (C) Presence of uncappedHoxb4transcripts. The untreated sample (U) gave a 300 bp amplification product (red arrow), indicating the presence of an uncappedHoxb4transcript. Image is the negative of the ethidium bromide stained gel. (D) Drosha cleavage site of pri-miR-10b and -10a. The nucleotides in red show the miRNA duplex formed by the maturemiR-10b/a(top strand) andmiR-10b/a*(bottom strand) sequence. Black arrows show the Drosha cleavage sites on the pri-miR-10b/ahairpin. The cleavage site is exactly 11 bp from the bottom of both the pri-miR-10b
and pri-miR-10astem junction on the downstream side. This is within a single nucleotide of the previously mapped P1 start site (a cluster of 4 nt underlined and denoted ‘‘P1’’ on pri-miR-10b).
doi:10.1371/journal.pone.0025689.g003
Figure 4. Distribution ofHoxd4/miR-10btranscripts along the embryonic AP axis.(A)Hoxd4probes and transcripts. Thein situhybridization probes are shown above a diagram of theHoxd4genomic locus. Previously, the P2 ex 4 probe spanning exon 4 and extending partially into intron 4, detected P2 transcripts at a point posterior to the r6/7 boundary, while the P1+P2 ex 5 probe spanning exon 5 detected P1+P2 transcripts with an r6/ 7 boundary. The newly designed P2 ex 1-3 probe spanned the first 3 exons, and detected spliced P2 transcripts, while the P1 probe spans the 59UTR of P1 transcripts, a region that is spliced out in mature P2 transcripts. Exons are denoted as for Fig. 1B. The P1 59end maps to nucleotide 4066 downstream of the major P2 start site. TheHoxd4P1-Cy3 probe used for RNA FISH in Fig 5D and E extends from the P1 59end to the 39end ofHoxd4
exon 5 as drawn. The grey triangle represents a hypothetical mRNA destabilizing element that is proposed to be absent from hypothetical transcript P2.3. (B,C) Expression ofHoxd4in E9.5 mouse embryos. Both the Drosha-cleaved P1 transcript detected by the P1 probe (B) and the P2 transcript detected by the P2 ex 1-3 probe (C) show anterior expression boundaries that are posterior to the anterior limit of the fullHoxd4expression domain at r6/7. ba1,2,3: branchial arches 1, 2 and 3; 4thv: fourth ventricle within the developing brain; neuroepi: neuroepithelium; flb: forelimb bud; opv: optic vesicle. The r6/7 boundary is approximately opposite branchial arch 3 as indicated. (D) Schematic of distribution ofHoxd4transcripts in the E9.5 mouse embryo. The solid red plus blue shading represents the cumulative distribution of all Hoxd4transcripts. The most anteriorly expressed transcripts (red) have an anterior expression border at the r6/7 boundary. Such an expression pattern is detected with the P1+P2 ex 5 probe [26] as well as probes spanning the homeobox-containing exon and 39UTR [34,40,45]. The region in blue represents the expression domain of thoseHoxd4
any signal (data not shown). Thus, endogenous Hoxd4 P1 transcripts are abundant in the nucleus and accumulate in a pattern suggestive of function.
Discussion
We have established that the 59ends ofHoxd4P1 transcripts are not capped, bear a terminal phosphate and map to the predicted Drosha cleavage site at the base of the stem of the pri-miR-10b
stem-loop. The 59 end of theHoxd4P1 transcript is precisely 11 nucleotides from the base of the pri-miRNA stem junction. A similar result was obtained for the Drosha cleavage product of
miR-10a and Hoxb4. This result is consistent with a validated model in which Drosha cleaves at a position 11 nt from the stem-ssRNA junction [41]. We conclude thatHoxd4P1 transcripts are indeed the result of Drosha cleavage of the pri-mir-10btranscript and, contrary to our previous interpretation [26], are not generated by transcriptional initiation from a distinct promoter, but by the action of Drosha on transcripts initiated at the P2 promoter.
A shared promoter and common regulatory elements for
Hoxd4andmiR-10b
A significant majority of human miRNAs resides in intronic regions and in the same orientation as the host coding genes [42]. The expression patterns of these intronic miRNAs frequently coincide with the genes in which they are embedded, indicating that they could be regulated by commoncis-regulatory elements [43]. Expression ofHoxd4transgenes in P19 cells and in transgenic mouse embryos is critically dependent on a 39 neural enhancer [28,31–34]. The expression profiles ofHoxd4andmiR-10bduring P19 differentiation as measured by qRT-PCR are similar, with low basal expression levels in undifferentiated P19 cells and strong induction of their expression upon neural differentiation, peaking at day 3 or 4 and declining thereafter. This is in contrast to the expression profiles of other Hox genes in P19 cells such asHoxa1
which has been shown to be induced as early as 6 hours of neural differentiation [37]. Our data are therefore consistent with both
Hoxd4and miR-10btranscripts coming under the control of this same regulatory region.
Primary miRNAs transcribed by RNA polymerase II are 59 capped and 39polyadenylated, making them structurally identical to messenger RNAs. It has been reported that human pri-miRNA transcripts also give rise to mRNA coding for a protein [44]. This is consistent with our observation that transcripts initiating at
Hoxd4 P2 have the potential to encode both miR-10b and HOXD4. Such an arrangement would facilitate the co-regulated expression of both Hoxd4 and miR-10b during development, as activation of the P2 promoter would lead to production of both
miR-10b and HOXD4. This is supported by in situ data that showed an extensive overlap of mature miR-10b and Hoxd4
expression both spatially and temporally [23,26]. The coordinated regulation of both genes suggests that they may have shared functions during early development such as has been described for
the shared repressive functions of the miR-10 family andhoxb4in zebrafish [35].
Expression along the antero-posterior axis
The full Hoxd4 expression domain extends anteriorly to the boundary between r6 and r7 in the developing hindbrain (Fig. 4D, combined blue plus red shading) as revealed by in situ probes overlapping the 59or 39ends of the coding region [26,34,40,45]. However, miR-10b and Hoxd4 P2 and P1 transcripts are not detected in the anterior-mostHoxd4expression domain up to r6/7 [26]. If a single P2 promoter drives expression of all transcripts derived from the Hoxd4 locus, then there must be post-transcriptional controls which prevent some RNAs from accumu-lating in anterior tissues up to r6/7. In one possible mechanism, P2 transcripts that include a hypothetical destabilizing element (grey triangle in Fig. 4A) located in theHoxd459UTR are unstable and degraded in the anterior-most part of the Hoxd4 expression domain up to r6/7 (Fig 4D, shaded red). In this scenario, only alternatively spliced transcripts that lack this destabilizing element, such as the hypothetical P2.3 transcript shown in figure 4A, accumulate in the anterior-most domain.
Alternatively, an as-yet uncharacterized promoter (hypothetical promoter P3, Fig. 4A) is active in anterior neural tissue and is responsible for expression in the anterior-most portion of the
Hoxd4expression domain. This is supported by the presence of cDNA and Expressed Sequence Tag (EST) clones (FANTOM) whose 59 ends map immediately upstream of theHoxd4 coding region. In addition, on the basis of primer extension results, a putative humanHOXD4promoter has been mapped 21 bp 59of the ATG start codon [46]. However, suchHoxd4transcripts may not be expressed in the neural lineage, and we have been unable to detectHoxd459ends in the P3 region despite extensive S1 nuclease and RNase protection assays [26] and 59RLM-RACE (unpub-lished data). In addition, the results presented in figure 5C fail to reveal promoter activity in the 1 kb sequence upstream of the
Hoxd4ATG start codon. The lack of a promoter at presumptive P3 is further substantiated by a low density of elongating RNA pol II, p300, TBP and H3K4me3 adjacent to theHoxd4coding region. Supporting one or more far upstream promoters, the density of these four factors is high in a broad region spanning P2 (ChIP-seq data from CH12 cells from ENCODE/Stanford/Yale displayed on the UCSC Genome Browser)[47].
The relationship between themiR-10family andHox4genes is surprisingly well conserved through evolution. In the zebrafish genome, threemiR-10members,miR-10b-1,miR-10b-2, and miR-10c, are positioned upstream of the Hox group 4 paralogshoxd4a,
hoxc4aand hoxb4a, respectively [48]. The remaining two miR-10 family members,miR-10candmiR-10d, are located at homologous positions near sites from which 4thgroup paralogs have been lost in theHoxBaand (vestigial)HoxDbclusters [48]. The sequences of mature miR-10b-1 and miR-10b-2 are identical and they are expressed slightly posterior to the r6/7 boundary, reminiscent of the situation in the mouse embryo [23,26,35].
IRES region in front of thelacZgene and SV40 polyadenylation signal. The inverted IRES construct consists of the same components except that the putative IRES region, which is about 1 kb in length, is inverted. Boxes indicate exons as per figure 1B. (D) RNA FISH of P19 cells on day 3 of neural differentiation. Vertical columns show images obtained under excitation for Cy3, GFP and DAPI. Images obtained with excitation for GFP control for autofluorescence. The upper row shows a negative control Cy3-labelled probe (pCR2.1 control) and the middle and lower rows show the localization of the Cy3-labelledHoxd4P1 probe (Hoxd4 P1).Hoxd4transcripts are specifically detected as speckles in the nucleus of neurally differentiated P19 cells. Images in the bottom row have been digitally enlarged in order to present the punctate bodies more clearly. The Adobe Photoshop application was used to enhance the contrastsimultaneouslyto pairs of images in the Cy3 and GFP columns. Arrows denote punctate bodies visible with the Cy3-labelled Hoxd4 P1 probe. These bodies are not visible when the sample is excited for GFP and do not correspond to chromatin structures detected by DAPI.
Long intergenic primary Hox transcripts have been document-ed from the earliest days of the field [49]. More recently, high-resolution transcriptional profiling of the Hox clusters has revealed extensive polycistronic transcripts and a high degree of transcrip-tional complexity within the mammalian Hox clusters [50]. This increases the possible sources of transcripts acting as primary microRNAs and/or Hox messenger RNAs. A long primary transcript (Genbank BK005082) originating downstream of zebrafishhoxb5aspansmiR-10c, hoxb4aandhoxb3aand is expressed in a domain posterior tohoxb4a[35,51]. A similar situation exists in mouse where a long-rangeHoxd3transcript initiated from the
Hoxd4P2 promoter has the potential to code for miR-10bas well (NM_010468). Thus, it may be generally true of Hox complexes that long intergenic transcripts governed by a variety of enhancers contribute to miRNA accumulation at different points along the antero-posterior axis.
Putative function of Drosha-cleaved P1 transcripts Although uncapped transcripts are typically degraded rapidly [52], theHoxd4P1 product of Drosha cleavage appears to be both stable and abundant in the mouse embryo and neurally differentiating P19 cells. We have also shown the presence of uncapped Drosha-cleavedHoxb4transcripts (Fig 3C), leading us to speculate that this may be a new class of RNA species with novel functions.
While P1 transcripts might be translated, they do not appear to have an IRES necessary for cap-independent translation (Fig 5C). By contrast, however, P1 transcripts are abundantly localized to punctate nuclear bodies in differentiating P19 cells. There is now widespread evidence for the prevalence and importance of actively transcribed ncRNAs in mammalian cells [53–55]. The highly regulated expression of these ncRNAs in a temporal or spatial manner is suggestive of functional significance. Some Hox-associated ncRNAs which are 59 capped, spliced and polyadenyl-ated, such as HOTAIR and HOTTIP were found to interact with Polycomb/PRC2 and Trithorax/MLL complexes, respectively, controlling histone methylation and chromatin remodeling and thereby silencing or activating transcription [56,57]. Intriguingly, the HOTAIR ncRNA employs atransmode of action by silencing transcription at a distant HOXD locus while the HOTTIP ncRNA activates gene expression incis, on the proximal HOXA genes. It is thus conceivable that theHoxd4P1 transcripts may perform similar roles by binding chromatin remodeling complexes to direct transcription of genes in transorcis. Further insight will require the use of appropriate probes to co-localize P1 transcripts to one of the known sub-nuclear structures such as paraspeckles [58].
Materials and Methods
Ethics statement
All animal procedures were performed according to the Singapore A*STAR Biopolis Biological Resource Center (BRC) Institutional Animal Care and Use Committee (IACUC) guide-lines and the IACUC protocols employed were reviewed and approved by the aforementioned committee before any animal procedures were undertaken for this study described here (IACUC Protocol No: 080348 and 080377).
Cell culture and differentiation
P19 cells (American Type Culture Collection #CRL-1825) were cultured in DMEM (Gibco) supplemented with 10% fetal bovine serum. For differentiation, the P19 cells were seeded at a density of 16105 cells/ml in a 10 cm untreated polystyrene bacterial petri dish (Greiner Bio-One, Germany), treated with
0.3mM of all-trans retinoic acid and allowed to aggregate. This was designated as day 0. Fresh media with 0.3mM RA was replaced after 2 days. After 4 days, fresh media without RA was replaced and the cells plated onto tissue culture plates (Corning, USA).
Quantitative reverse transcriptase PCR
RNA was extracted using the PureLinkTM Micro-to-MidiTM Total RNA Purification System (Invitrogen). 1mg total RNA was first treated with 1 U DNase I (Fermentas) at 37uC for 30 min. Reverse transcription of mRNA was carried out with SuperScriptH
III First-Strand Synthesis (Invitrogen) and reverse transcription of miRNA was carried out with NCodeTM miRNA First-Strand cDNA Synthesis (Invitrogen) as per the manufacturer’s instruc-tions. The cDNA was then used for quantitative PCR (qPCR) together with SYBR GreenERTMqPCR SuperMix (Invitrogen) on a BioRad iCycler iQ5. 18S RNA was used as internal control for the mRNAs while U6 RNA was used as an internal control for the microRNAs.
RNA ligation mediated 59rapid amplification of cDNA ends
RNA was extracted from P19 cells on day 3 of differentiation using the PureLinkTM Micro-to-MidiTM Total RNA Purification System (Invitrogen) and 59RACE performed as per manufactur-er’s instructions (GeneRacerHKit, Invitrogen).
RNAin situhybridization
Embryos were fixed overnight at 4uC in 4% paraformaldehyde and subsequently processed for 10mm paraffin-embedded sections as described [59]. RNA in situ hybridization with digoxigenin (DIG)-labeled probes was performed as previously described [60]. The following plasmids were used as templates for synthesizing antisense DIG-labeled RNA probes: pGEMT Hoxd4 uP1 and pCR4-TOPO Hoxd4 P2 exon1-3. Following hybridization and washing, sections were stained with NBT/BCIP and exposed overnight at 4uC in dark according to manufacturer’s instructions (Roche). Sections were subsequently washed in PBS and mounted with glycerol gelatin. All sections were photographed using a Zeiss Axio Imager Z1.
RNA FISH
Day 3 neurally differentiated P19 cells were typsinized and diluted to a concentration of 76105cells/ml before being cytospun onto glass slides using a cytocentrifuge, CytoSpin 4 (Thermo Scientific). Cells were then washed with ice-cold PBS for 5 min followed by fixation at room temperature in 4% paraformaldehyde (PFA) for 10 min. The slides were stored in 70% ethanol at 4uC. Before use, the slides were sequentially dehydrated through 80, 90 and 100% ethanol for 2 min each. The RNA FISH probes were labelled with the Nick translation kit and Cy3-dUTP according to the manufacturer’s instructions (Roche). Cot-1 mouse DNA was added to the Cy3-labelled probe and stored in hybridization buffer (50% formamide, 2x SSC pH 7.4, 2 mg/ml BSA, 10% Dextran Sulfate-500K) with a final concentration of 500 ng/ml and 50 ng/ ml respectively. Hybridization was carried out at 42uC for 3 hours, followed by three washes of 5 min each in 50% (v/v) formamide in 2x SSC and another three washes of 5 min each in 2x SSC at 45uC. All cells were imaged using a Nikon Eclipse Ti.
Nuclear-cytoplasmic fractionation
chilled lysis buffer (10 mM Tris pH 7.4, 3 mM MgCl2, 10 mM NaCl, 150 mM sucrose, 0.5% NP-40) with 10-20 U of RNase-OUT (Invitrogen) and kept on ice for 5–10 min with gentle mixing every minute. The cell lysate was centrifuged at 250 g in a microcentrifuge at 4uC for 5 min. Supernatant containing the cytoplasmic fraction was collected. The nuclear pellet was washed twice with 1 ml lysis buffer without NP-40 and resuspended in 100ml of lysis buffer. RNA extraction of both nuclear and cytoplasmic fractions was performed with RNA mini kit (Invitro-gen) followed by phenol-chloroform (pH 4.7) extraction and ethanol precipitation. RNA was then resuspended in equal volumes of DEPC-treated water. Equal volumes (1–2ml) of the total RNA obtained from the nuclear and cytoplasmic fractions was then individually ligated to the RNA oligonucleotide adaptor using T4 RNA ligase (Fermentas). Reverse transcription of mRNA was carried out with SuperScriptH III First-Strand Synthesis (Invitrogen). The cDNA was then used for qPCR together with SYBR GreenERTM qPCR SuperMix (Invitrogen) on a BioRad iCycler iQ5.
IRES plasmid transfection
293T cells (American Type Culture Collection#CRL-11268) were seeded at a density of 16105cells/ml in a 12-well plate and allowed to attach overnight. Transfection was performed the next day with Lipofectamine 2000 (Invitrogen) and 1.2mg of IRES or inverted IRES plasmids together with 50 ng of renilla reporter plasmid. Cell lysate was extracted 2 days after transfection.b-gal activity was measured using the Dual-LightHCombined Reporter Gene Assay System (Applied Biosystems) and normalized to renilla activity which was measured using the Dual-Luciferase
TM
Reporter Assay System (Promega) on a Fluoroskan Ascent FL (Thermo). Experimental triplicates were performed.
Plasmid constructs
The pGEMT Hoxd4 uP1 plasmid used for mouse in situ
hybridizations was made by T-tailed cloning of an approximately
700 bp PCR fragment amplified from pSNlacZpA (Zhanget al.
2000) starting from the P1 start site to the 39 splice acceptor of
Hoxd4intron 4 into the pGEMT vector (Promega).
The pCR4-TOPOHoxd4P2 exon 1-3 plasmid used for mouse
in situhybridizations was made by T-tailed cloning of an 287 bp PCR fragment amplified from cDNA of P19 day 4 differentiated cells, comprising of the first threeHoxd4exons into pCR4-TOPO vector using the TOPOHTA CloningHKit (Invitrogen).
The non IRES Reporter plasmid was made by cloning a 3.2 kb fragment amplified from PSNlacZpA (Zhanget al.2000) starting from theHoxd4ATG start codon and extending throughout the entirelacZcoding sequence into SpeI and PmeI sites in the pMIR-REPORT Luciferase plasmid from the PSNlacZpA (Zhang et al. 2000) starting from approximately 140 bp upstream from the Drosha cleavage site of miR-10b to the sequence just 59 of the
Hoxd4ATG start codon into SpeI sites in the non IRES Reporter plasmid.
The Hoxd4 P1 plasmid used for RNA FISH was made by cloning a 1.5 kb PCR fragment from the P1 Drosha cleavage site extending to the end of Hoxd4 exon 5 (Fig 4A, Hoxd4 P1-Cy3) into pCR4-TOPO T-tailed vector (Invitrogen). Primer sequences: P1-start(4255)-F (tatggtcgatgcaaaaacttca), Hoxd4 ex5(5802)-R (atccaagggtagaccacagc).
Acknowledgments
We would like to thank Eugene Makeyev for help with the nuclear-cytoplasmic fractionation and critical reading of the manuscript.
Author Contributions
Conceived and designed the experiments: SLCP L-FZ MF. Performed the experiments: SLCP XC YS VS. Analyzed the data: SLCP VS TL YS XC L-FZ MF. Contributed reagents/materials/analysis tools: SLCP VS TL YS L-FZ MF. Wrote the paper: SLCP TL L-FZ MF.
References
1. Griffiths-Jones S (2004) The microRNA Registry. Nucleic Acids Res 32: D109–111.
2. Griffiths-Jones S, Grocock RJ, van Dongen S, Bateman A, Enright AJ (2006) miRBase: microRNA sequences, targets and gene nomenclature. Nucleic Acids Res 34: D140–144.
3. Filipowicz W, Bhattacharyya SN, Sonenberg N (2008) Mechanisms of post-transcriptional regulation by microRNAs: are the answers in sight? Nat Rev Genet 9: 102–114.
4. Kim DH, Saetrom P, Snove O, Jr., Rossi JJ (2008) MicroRNA-directed transcriptional gene silencing in mammalian cells. Proc Natl Acad Sci U S A 105: 16230–16235.
5. Mallo M, Wellik DM, Deschamps J (2010) Hox genes and regional patterning of the vertebrate body plan. Dev Biol 344: 7–15.
6. Durston AJ, Jansen HJ, Wacker SA (2010) Review: Time-space translation regulates trunk axial patterning in the early vertebrate embryo. Genomics 95: 250–255.
7. Duboule D (2007) The rise and fall of Hox gene clusters. Development 134: 2549–2560.
8. Woltering JM, Duboule D (2010) The origin of digits: expression patterns versus regulatory mechanisms. Dev Cell 18: 526–532.
9. Tschopp P, Tarchini B, Spitz F, Zakany J, Duboule D (2009) Uncoupling time and space in the collinear regulation of Hox genes. PLoS Genet 5: e1000398. 10. Lagos-Quintana M, Rauhut R, Lendeckel W, Tuschl T (2001) Identification of
novel genes coding for small expressed RNAs. Science 294: 853–858. 11. Lagos-Quintana M, Rauhut R, Yalcin A, Meyer J, Lendeckel W, et al. (2002)
Identification of tissue-specific microRNAs from mouse. Curr Biol 12: 735–739. 12. Lagos-Quintana M, Rauhut R, Meyer J, Borkhardt A, Tuschl T (2003) New
microRNAs from mouse and human. RNA 9: 175–179.
13. Tan Y, Zhang B, Wu T, Skogerbo G, Zhu X, et al. (2009) Transcriptional inhibiton of Hoxd4 expression by miRNA-10a in human breast cancer cells. BMC Mol Biol 10: 12.
14. Ma L, Teruya-Feldstein J, Weinberg RA (2007) Tumour invasion and metastasis initiated by microRNA-10b in breast cancer. Nature 449: 682–688.
15. Ma L, Reinhardt F, Pan E, Soutschek J, Bhat B, et al. (2010) Therapeutic silencing of miR-10b inhibits metastasis in a mouse mammary tumor model. Nat Biotechnol 28: 341–347.
16. Ma L, Weinberg RA (2008) MicroRNAs in malignant progression. Cell Cycle 7: 570–572.
17. Sasayama T, Nishihara M, Kondoh T, Hosoda K, Kohmura E (2009) MicroRNA-10b is overexpressed in malignant glioma and associated with tumor invasive factors, uPAR and RhoC. Int J Cancer 125: 1407–1413.
18. Bloomston M, Frankel WL, Petrocca F, Volinia S, Alder H, et al. (2007) MicroRNA expression patterns to differentiate pancreatic adenocarcinoma from normal pancreas and chronic pancreatitis. JAMA 297: 1901–1908.
19. Ciafre SA, Galardi S, Mangiola A, Ferracin M, Liu CG, et al. (2005) Extensive modulation of a set of microRNAs in primary glioblastoma. Biochem Biophys Res Commun 334: 1351–1358.
20. Mansfield JH, Harfe BD, Nissen R, Obenauer J, Srineel J, et al. (2004) MicroRNA-responsive ‘sensor’ transgenes uncover Hox-like and other develop-mentally regulated patterns of vertebrate microRNA expression. Nat Genet 36: 1079–1083.
21. Kosman D, Mizutani CM, Lemons D, Cox WG, McGinnis W, et al. (2004) Multiplex detection of RNA expression in Drosophila embryos. Science 305: 846.
22. Wienholds E, Kloosterman WP, Miska E, Alvarez-Saavedra E, Berezikov E, et al. (2005) MicroRNA expression in zebrafish embryonic development. Science 309: 310–311.
23. Kloosterman WP, Wienholds E, de Bruijn E, Kauppinen S, Plasterk RH (2006) In situ detection of miRNAs in animal embryos using LNA-modified oligonucleotide probes. Nat Methods 3: 27–29.
24. Horan GS, Kovacs EN, Behringer RR, Featherstone MS (1995) Mutations in paralogous Hox genes result in overlapping homeotic transformations of the axial skeleton: evidence for unique and redundant function. Dev Biol 169: 359–372.
show more complete homeotic transformations and a dose-dependent increase in the number of vertebrae transformed. Genes Dev 9: 1667–1677. 26. Folberg A, Kovacs EN, Featherstone MS (1997) Characterization and retinoic
acid responsiveness of the murine Hoxd4 transcription unit. J Biol Chem 272: 29151–29157.
27. van Scherpenzeel Thim V, Remacle S, Picard J, Cornu G, Gofflot F, et al. (2005) Mutation analysis of the HOX paralogous 4-13 genes in children with acute lymphoid malignancies: identification of a novel germline mutation of HOXD4 leading to a partial loss-of-function. Hum Mutat 25: 384–395. 28. Nolte C, Amores A, Nagy Kovacs E, Postlethwait J, Featherstone M (2003) The
role of a retinoic acid response element in establishing the anterior neural expression border of Hoxd4 transgenes. Mech Dev 120: 325–335.
29. Morrison A, Moroni MC, Ariza-McNaughton L, Krumlauf R, Mavilio F (1996) In vitro and transgenic analysis of a human HOXD4 retinoid-responsive enhancer. Development 122: 1895–1907.
30. Morrison A, Ariza-McNaughton L, Gould A, Featherstone M, Krumlauf R (1997) HOXD4 and regulation of the group 4 paralog genes. Development 124: 3135–3146.
31. Zhang F, Popperl H, Morrison A, Kovacs EN, Prideaux V, et al. (1997) Elements both 59and 39to the murine Hoxd4 gene establish anterior borders of expression in mesoderm and neurectoderm. Mech Dev 67: 49–58.
32. Zhang F, Nagy Kovacs E, Featherstone MS (2000) Murine hoxd4 expression in the CNS requires multiple elements including a retinoic acid response element. Mech Dev 96: 79–89.
33. Rastegar M, Kobrossy L, Kovacs EN, Rambaldi I, Featherstone M (2004) Sequential histone modifications at Hoxd4 regulatory regions distinguish anterior from posterior embryonic compartments. Mol Cell Biol 24: 8090–8103. 34. Nolte C, Rastegar M, Amores A, Bouchard M, Grote D, et al. (2006) Stereospecificity and PAX6 function direct Hoxd4 neural enhancer activity along the antero-posterior axis. Dev Biol 299: 582–593.
35. Woltering JM, Durston AJ (2008) MiR-10 represses HoxB1a and HoxB3a in zebrafish. PLoS One 3: e1396.
36. Rudnicki MA, McBurney MW (1987) Cell culture methods and induction of differentiation of embryonal carcinoma cell lines. In: Robertson EJ, ed. Teratocarcinomas and embryonic stem cells: a practical approach. Oxford: IRL Press. pp 19–49.
37. LaRosa GJ, Gudas LJ (1988) Early Retinoic Acid-Induced F9 Teratocarcinoma Stem Cell Gene ERA-I: Alternate Splicing Creates Transcripts for a Homeobox-Containing Protein and One Lacking the Homeobox. Molecular and Cellular Biology 8: 3906–3917.
38. Wei Y, Harris T, Childs G (2002) Global gene expression patterns during neural differentiation of P19 embryonic carcinoma cells. Differentiation 70: 204–219. 39. Baron A, Featherstone MS, Hill RE, Hall A, Galliot B, et al. (1987)Hox-1.6: A
mouse homeobox-containing gene member of theHox-1complex. EMBO J 6: 2977–2986.
40. Featherstone MS, Baron A, Gaunt SJ, Mattei MG, Duboule D (1988) Hox-5.1 defines a homeobox-containing gene locus on mouse chromosome 2. Proc Natl Acad Sci U S A 85: 4760–4764.
41. Han J, Lee Y, Yeom K-H, Nam J-W, Heo I, et al. (2006) Molecular Basis for the Recognition of Primary microRNAs by the Drosha-DGCR8 Complex. Cell 125: 887–901.
42. Rodriguez A, Griffiths-Jones S, Ashurst JL, Bradley A (2004) Identification of mammalian microRNA host genes and transcription units. Genome Res 14: 1902–1910.
43. Baskerville S, Bartel DP (2005) Microarray profiling of microRNAs reveals frequent coexpression with neighboring miRNAs and host genes. RNA 11: 241–247.
44. Cai X, Hagedorn CH, Cullen BR (2004) Human microRNAs are processed from capped, polyadenylated transcripts that can also function as mRNAs. RNA 10: 1957–1966.
45. Gaunt SJ, Krumlauf R, Duboule D (1989) Mouse homeo-genes within a subfamily, Hox-1.4, -2.6 and -5.1, display similar anteroposterior domains of expression in the embryo, but show stage- and tissue-dependent differences in their regulation. Development 107: 131–141.
46. Cianetti L, Di Cristofaro A, Zappavigna V, Bottero L, Boccoli G, et al. (1990) Molecular mechanisms underlying the expression of the human HOX-5.1 gene. Nucleic Acids Res 18: 4361–4368.
47. Myers RM, Stamatoyannopoulos J, Snyder M, Dunham I, Hardison RC, et al. (2011) A user’s guide to the encyclopedia of DNA elements (ENCODE). PLoS Biol 9: e1001046.
48. Woltering JM, Durston AJ (2006) The zebrafish hoxDb cluster has been reduced to a single microRNA. Nat Genet 38: 601–602.
49. Simeone A, Pannese M, Acampora D, D’Esposito M, Boncinelli E (1988) At least three human homeoboxes on chromosome 12 belong to the same transcription unit. Nucleic Acids Res 16: 5379–5390.
50. Mainguy G, Koster J, Woltering J, Jansen H, Durston A (2007) Extensive polycistronism and antisense transcription in the mammalian Hox clusters. PLoS One 2: e356.
51. Hadrys T, Prince V, Hunter M, Baker R, Rinkwitz S (2004) Comparative genomic analysis of vertebrate Hox3 and Hox4 genes. J Exp Zool B Mol Dev Evol 302: 147–164.
52. Franks TM, Lykke-Andersen J (2008) The control of mRNA decapping and P-body formation. Mol Cell 32: 605–615.
53. Okazaki Y, Furuno M, Kasukawa T, Adachi J, Bono H, et al. (2002) Analysis of the mouse transcriptome based on functional annotation of 60,770 full-length cDNAs. Nature 420: 563–573.
54. Carninci P, Kasukawa T, Katayama S, Gough J, Frith MC, et al. (2005) The transcriptional landscape of the mammalian genome. Science 309: 1559–1563. 55. Birney E, Stamatoyannopoulos JA, Dutta A, Guigo R, Gingeras TR, et al. (2007) Identification and analysis of functional elements in 1% of the human genome by the ENCODE pilot project. Nature 447: 799–816.
56. Rinn JL, Kertesz M, Wang JK, Squazzo SL, Xu X, et al. (2007) Functional demarcation of active and silent chromatin domains in human HOX loci by Noncoding RNAs. Cell 129: 1311–1323.
57. Wang KC, Yang YW, Liu B, Sanyal A, Corces-Zimmerman R, et al. (2011) A long noncoding RNA maintains active chromatin to coordinate homeotic gene expression. Nature 472: 120–124.
58. Clemson CM, Hutchinson JN, Sara SA, Ensminger AW, Fox AH, et al. (2009) An architectural role for a nuclear noncoding RNA: NEAT1 RNA is essential for the structure of paraspeckles. Mol Cell 33: 717–726.
59. Tribioli C, Lufkin T (1999) The murine Bapx1 homeobox gene plays a critical role in embryonic development of the axial skeleton and spleen. Development 126: 5699–5711.
60. Wang W, Chan EK, Baron S, Van de Water T, Lufkin T (2001) Hmx2 homeobox gene control of murine vestibular morphogenesis. Development 128: 5017–5029.
![Figure 1. Hox genes and their associated microRNAs. (A) A schematic of the four mammalian Hox clusters (HoxA through HoxD) and the position of the microRNAs embedded within them [20]](https://thumb-eu.123doks.com/thumbv2/123dok_br/18402343.358841/2.918.88.568.435.966/associated-micrornas-schematic-mammalian-clusters-position-micrornas-embedded.webp)