Identification of Differentially Expressed
Genes Related to Dehydration Resistance in a
Highly Drought-Tolerant Pear,
Pyrus
betulaefolia, as through RNA-Seq
Kong-Qing Li1, Xiao-Yong Xu3, Xiao-San Huang2*
1College of Rural Development, Nanjing Agricultural University, Nanjing, 210095, China,2College of Horticulture, State Key Laboratory of Crop Genetics and Germplasm Enhancement, Nanjing Agricultural University, Nanjing, 210095, China,3School of Horticulture and Plant Protection, Yangzhou University, Yangzhou, 225009, China
Abstract
Drought is a major abiotic stress that affects plant growth, development and productivity. Pear is one of the most important deciduous fruit trees in the world, but the mechanisms of drought tolerance in this plant are still unclear. To better understand the molecular basis regarding drought stress response, RNA-seq was performed on samples collected before and after dehydration inPyrus betulaefolia. In total, 19,532 differentially expressed genes (DEGs) were identified. These genes were annotated into 144 Gene Ontology (GO) terms and 18 clusters of orthologous groups (COG) involved in 129 Kyoto Encyclopedia of Genes and Genomes (KEGG) defined pathways. These DEGs comprised 49 (26 up-regulated, 23 down-regulated), 248 (166 up-regulated, 82 down-regulated), 3483 (1295 up-regulated, 2188 down-regulated), 1455 (1065 up-regulated, 390 down-regulated) genes from the 1 h, 3 h and 6 h dehydration-treated samples and a 24 h recovery samples, respectively. RNA-seq was validated by analyzing the expresson patterns of randomly selected 16 DEGs by quantitative real-time PCR. Photosynthesis, signal transduction, innate immune response, protein phosphorylation, response to water, response to biotic stimulus, and plant hormone signal transduction were the most significantly enriched GO categories amongst the DEGs. A total of 637 transcription factors were shown to be dehydration responsive. In addition, a number of genes involved in the metabolism and signaling of hormones were significantly affected by the dehydration stress. This dataset provides valuable information regarding the
Pyrus betulaefoliatranscriptome changes in response to dehydration and may promote identification and functional analysis of potential genes that could be used for improving drought tolerance via genetic engineering of non-model, but economically-important, peren-nial species.
a11111
OPEN ACCESS
Citation:Li K-Q, Xu X-Y, Huang X-S (2016) Identification of Differentially Expressed Genes Related to Dehydration Resistance in a Highly Drought-Tolerant Pear,Pyrus betulaefolia, as through RNA-Seq. PLoS ONE 11(2): e0149352. doi:10.1371/ journal.pone.0149352
Editor:Ji-Hong Liu, Key Laboratory of Horticultural Plant Biology (MOE), CHINA
Received:October 29, 2015
Accepted:January 29, 2016
Published:February 22, 2016
Copyright:© 2016 Li et al. This is an open access article distributed under the terms of theCreative Commons Attribution License, which permits unrestricted use, distribution, and reproduction in any medium, provided the original author and source are credited.
Data Availability Statement:All relevant data are within the paper and its Supporting Information files.
Introduction
As sessile organisms, plants are frequently threatened by drought, which detrimentally affects growth, development, productivity and geographic distribution [1]. Plants have developed many sophisticated mechanisms to adapt or survive under drought stress. Elucidating the molecular mechanisms that regulate drought tolerance is critical if plant growth and productiv-ity under drought conditions is to be improved. Emerging evidences have shown that plants do not passively accept adverse conditions, but cope with it actively through generic drought sig-nal perception and transduction, which leads to a range of stress related genes alterations that protect them from stress [2].
Previous reports have indicated that stress signaling cascades encompass a large number of stress-responsive genes, which can be generally classified into two major groups based on the functions of their products, effector molecules or regulator molecules. Products of the first group fucntion directly in protecting cells against damage derived from stresses and sustaining cell viability, such as osmolyte biosynthetic enzymes, antioxidant proteins, chaperones and late embryogenesis abundant (LEA) proteins [2–5]. The second group is composed of regulatory proteins, such as transcription factors (TFs), protein phosphatases and protein kinases [2]. Among these stress-related transcription factors, members of the AP2/EREPB, bZIP, WRKY and MYB proteins have been well characterized for their roles in the regulation of drought tol-erance [6–9]. These genes constitute a delicate network that plays a key role in combating abi-otic stress. A large number of genes are expressed under abiabi-otic stress conditions, which suggests that the abiotic stress responses are more complex than was previously thought. Fur-thermore, there has been some difficulty in developing a clear-cut network for abiotic stress responses. Although many molecular components responsive to drought stress have been iden-tified in many model plants, the highly complex and interconnected nature of the network is still not understood. Furthermore, it is well known that molecular responses may differ between model plants and non-model plants, although a few parts of the response pathways may be the same. Therefore, it is important to identify transcriptional changes in non-model plants during drought stress so that the molecular elements that are specific to non-model plants can be identified.
Previous researchers tended to clone and characterize a single gene involved in the stress response. However, this is a piecemeal strategy and contributes little to a comprehensive understanding of the defense-related transcriptome that is controlled by quantitative mecha-nisms [10]. To extend the list of candidates of interest, high-throughput techniques have been widely applied to further understanding of the molecular mechanisms underlying drought stress. Genome-wide expression profiling of plants under drought stress has been reported for many plant species, including tomato [11], rice [12], barley [13], cotton [14], maize [15], sor-ghum [16] andArabidopsis[17,18]. Although significant progress has been made over the past decade into identifying the networks affected by drought stress, there is still little information available about the network dynamics involved in pear drought resistance.
Pear is the one of the most widespread fruit in the world and has considerable economic and health value. Many wild relatives of cultivated pear exist and they have different degrees of tolerance to abiotic stress.Pyrus betulaefolia, an important rootstock for pear, is drought tolerant, which makes it a good source of valuable drought tolerance genes [19,20]. Further-more, genomic information for pear is currently available, and RNA-Seq has become more efficient, less costly and more sensitive [21,22]. In this study, RNA-Seq data were generated to compare the gene expression patterns during different dehydration states. The gene expres-sion profiles will provide valuable insights into the mechanisms underlying drought resistance in pear.
2014M551615), and the Jiangsu Provincial Postdoctoral Fund (1201019B, 1401125C). The funders had no role in study design, data collection and analysis, decision to publish, or preparation of the manuscript.
Materials and Methods
Plant materials and dehydration treatment
Pear plants were grown in the seedling beds at National Center of Pear Engineering Technol-ogy Research, Nanjing Agricultural University. Three-month-old plants were used in this study. Uniform and healthy plants were inserted into a beaker containing distilled water, which were kept in a growth chamber at 26°C with a 16 h light/8 h dark photoperiod for 2 d before exposure to the dehydration treatment. Then seedlings were put on clean filter papers (90 x 90 mm) and allowed to dry for 0, 1, 3 and 6 h in an ambient environment at 26°C, followed by recovery in water at 26°C for 24 h. The leaves were independently harvested at the designated dehydration time points and then immediately placed in liquid nitrogen, and stored at–80°C until they were used for RNA extraction.
Illumina sequencing and data analysis
The total RNA isolation and Solexa/Illumina sequencing was done according to the published paper [23]. The raw sequence data analysis and base calling were produced by the Illumina instrument software Analyzer at BGI-Shenzhen. The remaining high quality clean sequencing reads were mapped onto the pear genome reference [24] to identify continuous gene regions using SOAP aligner/SOAP2 [25]. Only two mismatches were allowed. Unique mapped reads were used for further analysis. For gene expression level analysis, RPKM (reads per kb per mil-lion reads) was used [26]. To identify differentially expressed genes (DEGs), read counts for each gene were calculated. Then we model the read counts as Poisson distributed [27]. DEGs were identified requiring FDR0.001 and an absolute value of log2(fold-change)1.
Genes with similar expression patterns are usually functionally correlated. We performed a cluster analysis on the gene expression patterns using cluster software [28] and Java Treeview [29] software. In the gene expression profiling analysis, InterPro domains [30] were annotated by InterProScan Release 36.0 [31] and functional assignments were mapped onto GO terms [32]. GO enrichment analysis were constructed using WEGO [33]. Significantly enriched Kyoto Encyclopedia of Genes and Genomes (KEGG) pathways were identified according to the P values and enrichment factors [34]. Using a BLAST search against the KEGG database and then mapped onto KEGG pathways.
Cluster analysis
For each gene, RPKM expression values were normalized to values between -1.0 and 1.0 by multiplying by a scale factor, which made the sum of the squares for the time point values equal to 1.0. The normalized expression values for each transcript were then centered on zero by subtracting the mean of the values from each data point. Clustering was carried out by hclust function in R (http://www.r-project.org/) using a distance matrix representing the RPKM level profiles of the genes across the five time points. The tree produced by the cluster-ing process was cut into several groups by the cutree function in R. Maximum number of clus-ters was set to 20.
Gene expression analysis by quantitative real-time PCR
cDNA Synthesis Kit (TOYOBO, TOYOBO Biotech Co. Ltd, Japan) following the manufactur-er’s instructions. The 10μL qPCR solutions contained 5μL of SYBR1Green Premix kit
(TaKaRa Biotechnology. Dalian, China), 0.25μM forward and 0.25μM reverse primers, and 50
ng cDNA templates. All reactions were run as duplicates in 96-well plates. The quadruple qPCR reactions were performed on a Lightcycle-480 (Roche) using the following cycle regime: 50°C/2 min, 95°C/10 min, followed by 40 cycles of 95°C/15 s, and 58°C/1 min. TheTubulin gene (AB239681) was amplified in parallel as an internal reference gene. The relative expres-sion levels of the amplified products were calculated using the 2-ΔΔCtmethod [35]. Four techni-cal replicates were used for each sample and the data are shown as means ± standard errors (SE) (n = 3). The source of variation resulted from the technical errors, such as operational approach, equipment and reagent. The primer sequences used for qPCR are listed are listed in S11 File.
Results and Discussion
Electrolyte leakage and relative water content during dehydration
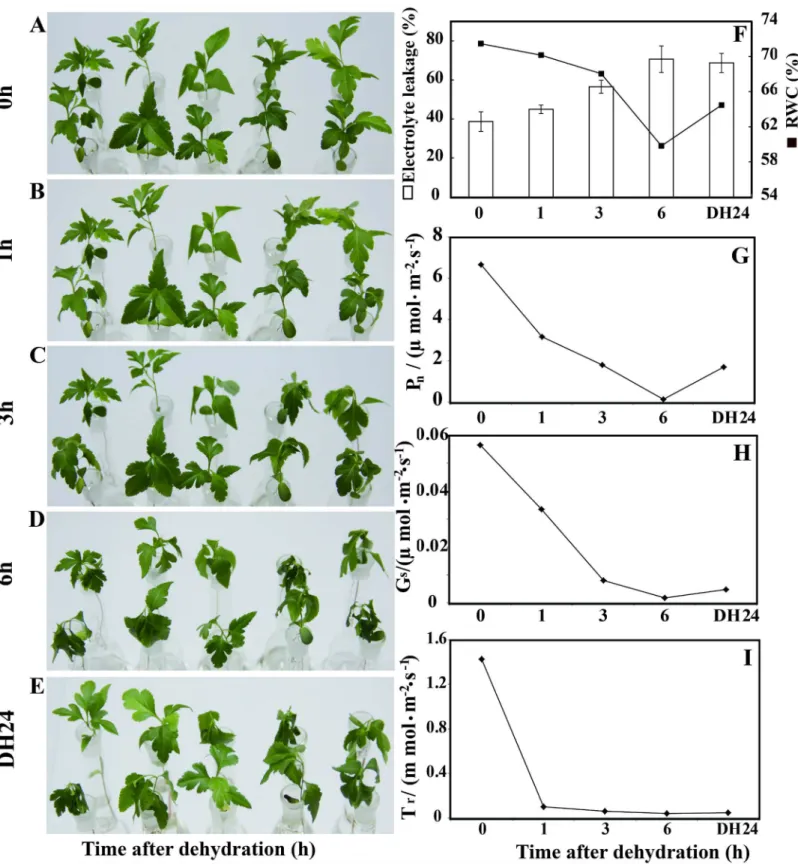
In order to investigate the effect of dehydration on pear, young seedlings were dehydrated for 0, 1, 3, 6 h in an ambient environment at 26°C, followed by recovery in the water at 26°C for 24 h (Fig 1). Seedling electrolyte leakage (EL) was measured. Significantly higher EL was observed during dehydration for 6 h than at any other time point. The survival rate of the plants dehy-drated for 6 h was 42% (Fig 1F). The decrease of relative water content (RWC) in the leaves was slow over the first hour of dehydration in an ambient environment but accelerated at the 3 and 6 h time points. The RWC of the dehydrated plants after 6 h was lower than it was at the other time points, except for after recovery in the water for 24 h (Fig 1F). The net photosyn-thetic rate (Pn), stomatal conductance (Gs) and transpiration rate (Tr) ofPyrus betulaefolia
were lower at 6 h than for any of the other time points at 1000 molm-2s-1light intensity. In this study, we also monitored the water potential during the process of dehydration, the result was shown as (S1 Fig). These results agree with earlier reports that drought significantly dam-ages self-repair mechanisms and physiological metabolism [36–39].
Statistics of read mapping
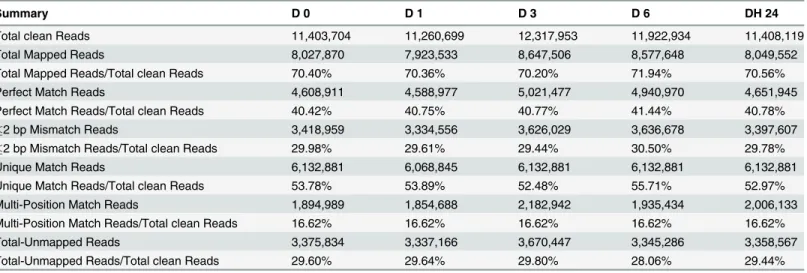
In this study, we performed an RNA-Seq analysis of thePyrus betulaefoliadigital transcript abundance measurements using Illumina-based 2 × 90 bp paired-end reads sequencing. Illu-mina, a widely used NGS platform for transcriptome assembly, produces relatively shorter reads but generates higher transcriptome coverage at lower expenses compared with other plat-forms [40]. In total, five RNA-Seq libraries were sequenced fromPyrus betulaefoliashoots dehydrated for 0, 1, 3 or 6 h in an ambient environment and then left to recover for 24 h in water. The number of reads for each library ranged from 11.7 to 12.6 million. A total of 11,959,230 raw reads were obtained from D0, 11,784,133 from D1, 12,643,252 from D3, 12,388,234 from D6, 11,957,932 from DH24. We filtering out the low quality reads, reads where the percentage of unknown bases (N) was greater than 10%, and adaptor sequences. Finally, this generated 11,403,704; 11,260,699; 12,317,953; 11,922,934; 11,408,119 clean reads with 49 bp reads for the 0, 1, 3, 6, dehydration time points and the 24 h recovery time point. The average number of clean reads produced per library was 11.6 million. The total number of mapped reads per library ranged from 7.9 to 8.6 million and the percentage of these mapped reads ranged from 70% to 71% (Table 1).
Fig 1. Time-course fresh water loss ofPyrus betulaefoliaseedling during dehydration for 0, 1, 3 and 6 h in an ambient environment at 26°C, followed by recovery in water at 26°C for 24 h.(A-E). Electrolyte leakage and relative water content (RWC) analysis ofPyrus betulaefolialeaves. (F). Content of photosynthetic rate (Pn) (G); content of stomatal conductance (Gs) (H); content of transpiration rate (Tr) (I).
number of detected genes almost stopped increasing when the number of reads reached 2 mil-lion (data not shown). If the randomness is poor for specific gene region, then this will directly affect subsequent bioinformatics analysis. Therefore the randomness of the RNA-seq data was evaluated by analyzing the distribution of reads matching the reference genes [41]. The results showed that the randomness of the reads was so good that the reads in every position would be evenly distributed (data not shown). Heterogeneity and redundancy are two significant charac-teristics of mRNA expression levels. Therefore, the normality of the RNA-Seq analysis was evaluated by analyzing the distribution of the unique mapped reads.S2 Figshows that the dis-tribution of the unique mapped reads over different read abundance categories showed the same patterns for all five RNA-Seq libraries. Taken together, these results were also suggested that our RNA-seq data ofPyrus betulaefoliarepresents a valuable digital transcript abundance measurements resource for gene discovery and functional analysis, which was in agreement with previous report [11,13,21,23].
Differentially expressed genes in the libraries
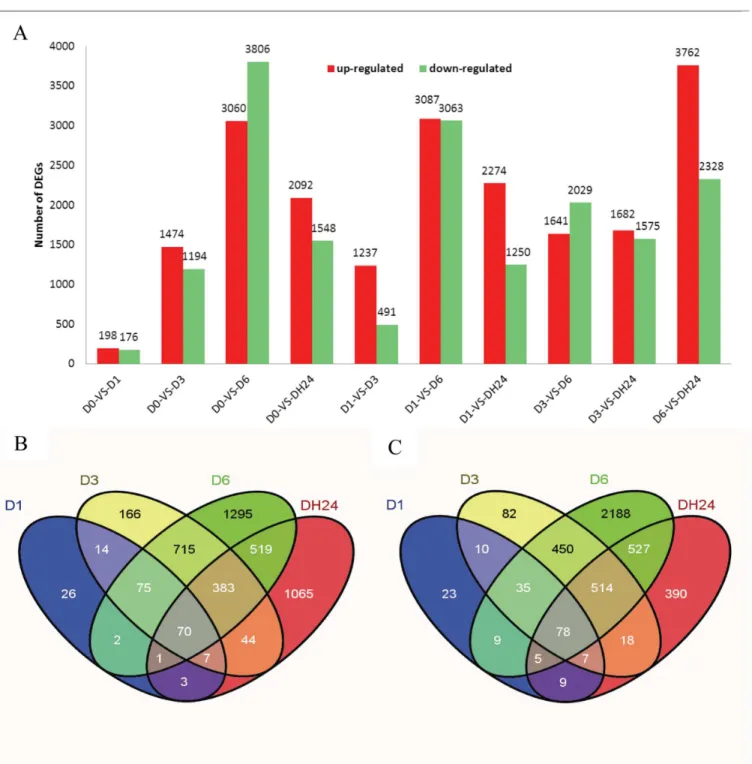
It has been well documented that plants can enhance their drought tolerance by modulating gene transcription, and examples of gene induction and repression in response to drought have been reported [11,42]. In this study, differences in gene expression during dehydration treat-ment were analyzed, and the DEGs were identified by pairwise comparisons of the five librar-ies, i.e. D0 vs. D1, D0 vs. D3, D0 vs. D6, D0 vs. DH24, D1 vs. D3, D vs. D6, D1 vs. DH24, D3 vs. D6, D3 vs. DH24 and D6 vs. DH24 (Fig 2A), which resulted in ten pairs of comparisons. Among these comparisons, we found that between 374 and 6866 genes were significantly dif-ferentially expressed, depending on the library, and the average number was 3,777. The differ-ential expression patterns for the libraries revealed that the largest number of differdiffer-entially expressed genes occurred between D0 and D6. A total of 6866 genes were significantly differen-tially expressed between these two libraries. Of these genes, 3060 genes were up-regulated and 3806 genes were down-regulated. The second largest number of differentially-expressed genes occurred between D1 vs. D6. A total number of 6,150 DEGs were detected between the D1 and D6 libraries, with 3087 being up-regulated and 3063 down-regulated. The third largest number of DEGs occurred in the D6 vs. DH24 comparison, followed by D3 vs. D6, D1 vs. D3, D1 vs. DH24, D3 vs. DH24, D0 vs. D3, D1 vs. D3, D0 vs. D1. The results are consistent with the Table 1. Summary of read numbers based on the RNA-Seq data fromPyrus betulaefoliapear during dehydration.
Summary D 0 D 1 D 3 D 6 DH 24
Total clean Reads 11,403,704 11,260,699 12,317,953 11,922,934 11,408,119
Total Mapped Reads 8,027,870 7,923,533 8,647,506 8,577,648 8,049,552
Total Mapped Reads/Total clean Reads 70.40% 70.36% 70.20% 71.94% 70.56%
Perfect Match Reads 4,608,911 4,588,977 5,021,477 4,940,970 4,651,945
Perfect Match Reads/Total clean Reads 40.42% 40.75% 40.77% 41.44% 40.78%
2 bp Mismatch Reads 3,418,959 3,334,556 3,626,029 3,636,678 3,397,607
2 bp Mismatch Reads/Total clean Reads 29.98% 29.61% 29.44% 30.50% 29.78%
Unique Match Reads 6,132,881 6,068,845 6,132,881 6,132,881 6,132,881
Unique Match Reads/Total clean Reads 53.78% 53.89% 52.48% 55.71% 52.97%
Multi-Position Match Reads 1,894,989 1,854,688 2,182,942 1,935,434 2,006,133
Multi-Position Match Reads/Total clean Reads 16.62% 16.62% 16.62% 16.62% 16.62%
Total-Unmapped Reads 3,375,834 3,337,166 3,670,447 3,345,286 3,358,567
Total-Unmapped Reads/Total clean Reads 29.60% 29.64% 29.80% 28.06% 29.44%
results reported by Huang et al. (2013), Ning et al. (2010), Gong et al. (2010), whose data showed that on exposure to different stresses, many stress related genes were induced by stress treatments that lasted for varying lengths of time [21,43,44]. One of the explanations for this might be that plants do not passively accept environmental stresses, but respond actively through the perception of a stress signal, which then induces the expression of a large number Fig 2. Differentially expressed genes between different libraries.Up-regulated (red) and down-regulated (green) genes were quantified (A). The ten comparison results are shown. Venn diagram showing the differentially expressed genes at each of the five time points associated with drought stress. (B) Up-regulated genes. (C) Down-regulated genes.
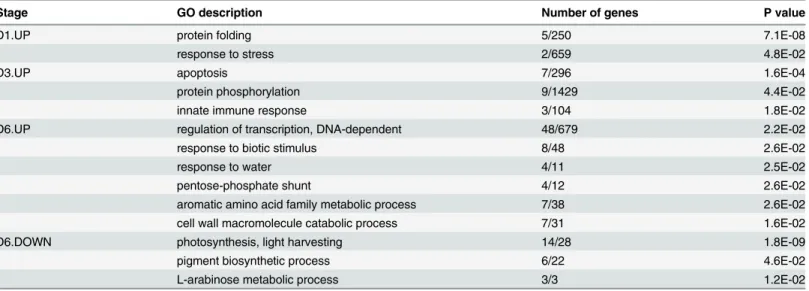
of stress related genes that protect the plant against stress damage [13,36]. To further survey the genes that were transcriptionally highly expressed during specific stages of dehydration, we investigated the genes that were up-regulated at a single time point compared with their expression levels at any other time point. There were 1516 relatively highly expressed genes that showed a more than twofold change in expression at a single stage compared to all other stages (S1 File). These genes are called stage specific up-regulated genes (SSRG) in this paper. After the plants had been dehydrated for 1 h, ten genes showed a more than twofold change in expression, compared to the other time points. Two of these SSRG genes coded for 70 kD heat shock proteins (Hsp70s), which are an important part of a cell’s protein folding mechanism, and help to protect cells from stress [45]. Five genes were related to protein folding, which indi-cated that the protein folding mechanism was the main process that responded to drought stress at this point. After 3 h, 53 SSRGs were observed to be enriched in the GO terms“ apopto-sis”and "protein phosphorylation" (Table 2). After 6 h, the number of SSRGs significantly increased. A total of 992 SSRGs were detected with the enriched GO terms of“regulation of transcription”,“NA-dependent”,“response to biotic stimulus”,“cell wall macromolecule cata-bolic process”etc. After the rehydration recovery period in water, there were 457 genes that were more highly expressed than at any other stage. The up-regulated transcription of the genes mentioned above suggested that they played an important role in biological processes at specific stages during dehydration. During the early stage of dehydration stress, protein folding is important, and then apoptosis and protein phosphorylation began to respond to stress after 3 h of treatment. Many genes were highly expressed after 6 h, including some transcription fac-tors and stress related genes (S2 File). When the plants had recovered in water, other highly expressed genes seemed to play a specific role in recovery, which was in agreement with previ-ous report [13,37,43].
We analyzed genes that were only differentially expressed at a single time point to investi-gate genes that are transcriptionally regulated at specific time points under water deficit condi-tions. We found that 26, 166, 1295 and 1065 of the DEGs were significantly up-regulated only at D1, D3, D6 and DH24, respectively (Fig 2B). In contrast, 23, 82, 2188 and 390 genes were only significantly down-regulated at D1, D3, D6 and DH24, respectively (Fig 2C). We also have added the analysis on each stage (D1, D3 and D6) specific down-regulated genes com-pared with DH24, the data are shown inS3,S4,S5andS6Files. In addition, we have added the analysis on 5 stages common differentially expression genes. There were 70 genes common up-regulated, and 78 genes are common down-regulated (S7andS8Files). These data indicate that DEGs display noticeable differences in their dehydration response at the transcriptional level, and that these differences depend on the dehydration state of the plant, which was in agreement with previous report [11,13].
Functional annotation of differentially expressed genes
activity, binding, transporter activity, molecular transducer activity, transporter activity, enzyme regulation and nucleic acid binding transcription factor activity. The cellular compo-nent category was further classified into cell, cell part, membrane, organelle and membrane part. These results demonstrated that DEGs that had binding, transport, molecular transduc-tion, transcription regulation and enzyme regulation functions were important during drought stress, which was in agreement with previous report [11,21].
Table 2. Over-represented GO terms for specific highly expressed genes at a given time point compared to the other time points.
Stage GO description Number of genes P value
D1.UP protein folding 5/250 7.1E-08
response to stress 2/659 4.8E-02
D3.UP apoptosis 7/296 1.6E-04
protein phosphorylation 9/1429 4.4E-02
innate immune response 3/104 1.8E-02
D6.UP regulation of transcription, DNA-dependent 48/679 2.2E-02
response to biotic stimulus 8/48 2.6E-02
response to water 4/11 2.5E-02
pentose-phosphate shunt 4/12 2.6E-02
aromatic amino acid family metabolic process 7/38 2.6E-02
cell wall macromolecule catabolic process 7/31 1.6E-02
D6.DOWN photosynthesis, light harvesting 14/28 1.8E-09
pigment biosynthetic process 6/22 4.6E-02
L-arabinose metabolic process 3/3 1.2E-02
doi:10.1371/journal.pone.0149352.t002
Significantly enriched Kyoto Encyclopedia of Genes and Genomes (KEGG) pathways were identified according to the P values and enrichment factors. Using a BLAST search against the KEGG database showed that there were 19,532 genes that mapped onto KEGG pathways. As shown inS9 File, a total of 129 KEGG pathways were observed to be significantly overrepre-sented during dehydration. The genes that correlated with drought were mainly involved in photosynthesis, plant hormone signal transduction, cell wall modification, transcriptional reg-ulation and drought metabolism, and were selected for subsequent analysis. The present results were consistent with the overall biochemical pathways that are known to be active during drought stress [11]. In addition, several other biological processes that have not previously been reported to be associated with drought, such as cell process, biological regulation, and metabolic process, also dramatically changed during drought stress. These might be novel genes that are relevant to the drought process inPyrus betulaefolia, which was in agreement with previous report [43,47].
An overview of the gene expression profiles, gene ontology enrichment
results and KEGG pathways present during dehydration treatment
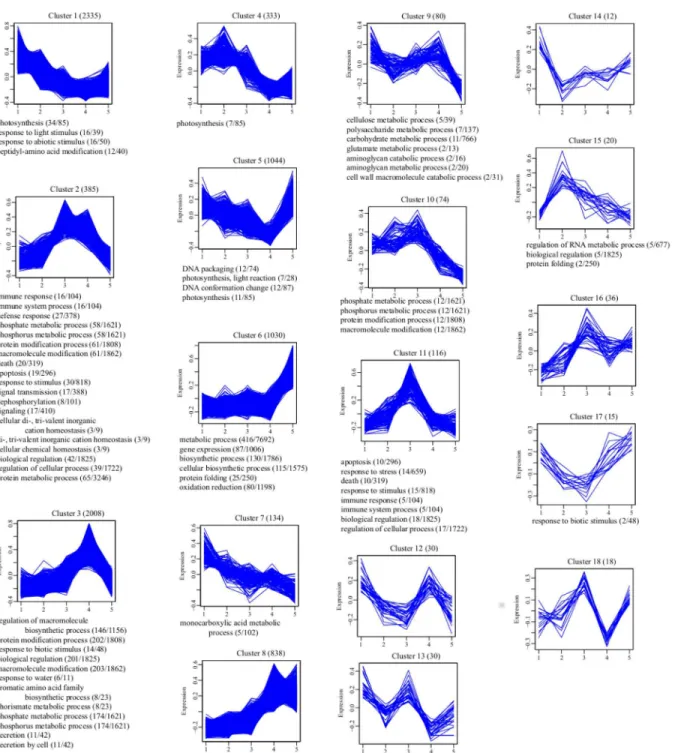
To investigate the co-expressed genes during drought stress, we applied statistical clustering to all the genes that were differentially expressed in at least one drought stage compared to the control (Fig 4). This clustering approach classifies genes using the pool of differentially regu-lated genes that exhibited similar patterns of expression over the five stages, regardless of the absolute level of expression. We detected 18 clusters of regulated genes, comprising of 8538 genes that showed some degree of differential expression (Fig 4). The largest group (Cluster 1) included 2335 genes (27.3%) that began to decrease progressively 3 h after dehydration treat-ment, but maintained a stable expression level during the last two stages. The second largest group (Cluster 3) contained 2008 genes (23.5%) that began to accumulate 1 h after dehydra-tion, and increased progressively until they reached their highest level at 6 h. The third largest group (Cluster 5) contained 1044 genes (12.2%) whose expression decreased continuously up to the 6 h time point, and then increased progressively until they reached their highest level at DH24. The fourth largest group (Cluster 6) contained 1030 genes (12.1%) whose expression did not change notably at the beginning, except for a slight decrease at 6 h of dehydration treat-ment, and then increased progressively until the end at DH24. The fifth largest group (Cluster 8) contained 838 genes (9.8%) whose transcript level increased progressively under dehydra-tion stress until they reached their highest level at 6 h, and then slightly decreased until the end at DH24. The sixth largest group (Cluster 11) contained 116 genes (1.4%) whose expression increased continuously under dehydration stress until they reached their highest level at 6 h, and then decreased progressively until DH24, which was in agreement with previous report [36,37].
In order to produce a global description of the biological processes enriched in each cluster of similarly regulated genes, we generated an overview of gene ontology (GO) terms using BinGO. The GO term“photosynthesis”was enriched in Cluster 1, which indicated that photo-synthesis decreased when the plant responded to water deficit stress. The“innate immune response”biological process was detected in Clusters 2 and 11, whose genes were highly expressed at D3 or D6, but had returned to control levels at DH24. The“response to stimulus”
Fig 4. Clustering and gene ontology enrichment of regulated genes.Genes displaying some degree of regulation were clustered using Hierarchical Clustering. A description of the expression pattern and the number of transcripts belonging to the cluster form the title of each chart. Expression values were normalized and scaled to between–1.0 and 1.0 (Y-axis). Enriched“Biological Process”GO terms, generated in BinGO are listed at the bottom of each cluster. For Clusters 12, 13, 14, 16 and 18, no over-represented“Biological Process”terms were detected. The number of genes associated with an over-represented GO term in the cluster and the number of genes associated with the same GO term in the Pyrus transcriptome are shown in parentheses. Specific genes belonging to each cluster can be found inS3 File. 2 (D1), 3 (D3), 4, (D6), 5 (DH24).
genes with significantly up-regulated expressions under these GO terms played key roles in the response to dehydration stress, which was in agreement with previous report [43,47,48].
We generated an overview of the metabolic pathways using KEGG pathway analysis (http:// www.genome.jp/kegg/) so that a global description of enriched metabolic pathways in each cluster of similar genes could be produced. We also found other important metabolic pathways that had been enriched in some clusters and were related to drought stress (S2 File).“Plant hor-mone signal transduction”and“photosynthesis”was found to be enriched in Cluster 1, which showed that photosynthesis pathway activity decreased when plants were exposed to dehydra-tion stress. These results agreed with earlier reports that photosynthesis is a primary biosyn-thetic pathway that restricts the normal function of other metabolic pathways, such as nitrogen fixation [11,49,50]. The metabolic“MAPK signaling pathway”was classified into Cluster 3 and Cluster 15. Previous studies have extensively emphasized the role of the MAPK signaling pathway in abiotic stress tolerance [38,44,51,52].
Metabolic changes of hormone in response to the dehydration
In order to investigate the metabolic changes after dehydration stress, we used MapMan to dis-sect the detailed metabolism in pear. At D1 and D3, we can observed that some of mebabolism have been changes, including genes including genes involved in cell wall, lipids, etc. We also observed the most metabolic changes at D6 (S3,S4,S5andS6Figs). Plant utilize hormones to regulate and coordinate growth and stress tolerance to survive or escape from stress. These hor-mones can act in the upstream of dehydration response and trigger hormone signal pathway. So here we mainly focus on metabolic changes of Abscisic acid (ABA) and gibberellin (GA).
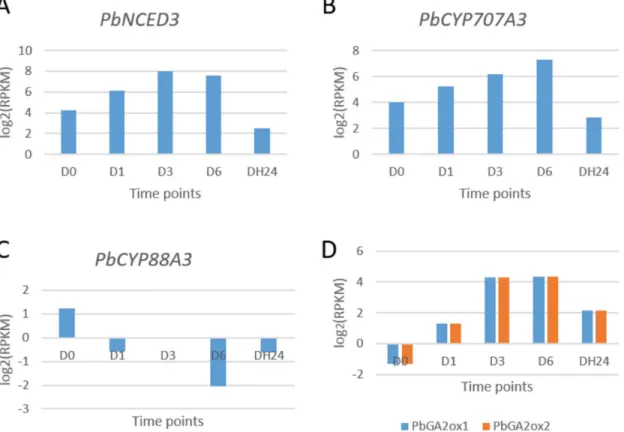
Abscisic acid (ABA) is an important phytohormone in the dehydration-stress response in plant. Its metabolic changes are one of the determinants of endogenous ABA levels and control diverse stress response. In our results, we observedPbNCED3were induced at 1 h and kept a higher expression level at 3 h and 6 h. After recovery in the water for 24 h, the expression was down-regulated. This gene encodes an epoxy carotenoid dioxygenase, a key enzyme in the bio-synthesis of abscisic acid.AtNCED3gene is strongly induced by drought stress, and thenced3 mutant lacks drought-responsive ABA accumulation [53]. The induction ofAtNCED3occurs in the early stages of the response to dehydration stress [54]. In our study,PbNCED3was also induced at very early stage (Fig 5A).
In pear,PbCYP707A3showed similar expression pattern withPbNCED3(Fig 5B). The cyp707a3mutant plants exhibited both exaggerated ABA-inducible gene expression and enhanced drought tolerance [55].CYP707A3encodes a major ABA 8'-hydroxylase and involves in dehydration and rehydration response inArabidopsis[55]. These results indicate that the response of the ABA metabolism pathway towards drought stress is a conserved mech-anisms betweenArabidopsisand pear.
We found thatPbCYP88A3were induced under drought stress in pear (Fig 5C).
PbCYP88A3encodes an ent-kaurenoic acid hydroxylase. Ent-kaurenoic acid hydroxylase is an important enzyme in GA biosynthesis. After drought stress, ent-kaurenoic acid hydroxylase was found to be down-regulated. GA 2-oxidase (GA2ox) genes encode GA-inactivating enzymes [56]. GA deactivation is an important point of control in the reduction of bioactive GA levels in response to stress. Decreased level of bioactive GA levels may be a results of growth inhibition after dehydration in pear (Fig 5D).
Phytohormone signal transduction under dehydration stress
within 1 h of dehydration treatment. Furthermore, a large numbers of genes related to hor-mone pathways showed modifys in transcript levels over the 6 h of the dehydration, demostrat-ting a important role of the these pathways in conferringPyrus betulaefoliaresponse to the dehydration. ABA is a major phytohormone that regulates a broad range of plant traits and is important for adaptation to environmental conditions [56,57]. It has been suggested that ABA can bind to the PYR/PYL/RCAR family of START domain-containing soluble receptors [58, 59]. The binding causes the receptors to bind and inhibit the activities of the type A protein phosphatase 2Cs (PP2Cs). Intersetingly, in this study, we noticed that a PYL gene was up-regu-lated by approximately 7–50 folds after 3 and 6 h of dehydration treatment. Up-regulation of the PYL gene implies that synthesis of ABA might be elevated inPyrus betulaefoliaunder dehy-dration. In addition, we also detected the up-regulated expression of PP2C by approximately 5.6–9.7 folds after 3 and 6 h of dehydration treatment, a key component in the ABA signaling pathway. This result is consistent with studies ofP.euphraticaandA.thaliana[11,60]. So, whether and how ABA mediated signaling pathway is involved in the dehydration responses of Pyrus betulaefoliaremains to be further illustrated.
Classification of the transcription factors into clusters
Numerous families of TFs are known to orchestrate the signals that are transduced when plants are challenged with various abiotic stresses, including the MYB, AP2/ EREBP, WRKY, NAC, MYC and bHLH families, and individual members have been revealed to promote or suppress abiotic stress responses [6,8,43,61–64]. In the current study, our digital transcript abundance measurement results showed that 2353 TFs were annotated as putative transcription factors in Fig 5. Expression patterns of genes involved in ABA and GA metabolism.
the pear genome. Among these, 637 (27.1%) were found to be induced either at a given time point or during the whole course of the dehydration treatment. These TFs were distributed across the above 18 clusters and classified into five major groups according to their putative DNA binding domains (S10 File).
The first largest group of the dehydration-inducible TFs belonged to the MYB family, which contained 72 MYB genes that were differentially expressed and classified into different clusters based on their expression patterns, among which 23, 6, 17, 1, 6, 4, 5, 6, 2 and 2 MYB transcrip-tion factors were identified in Cluster 1, Cluster 2, Cluster 3, Cluster 4, Cluster 5, Cluster 6, Cluster 7, Cluster 8, Cluster 11 and Cluster 16, respectively (S10 File). Interestingly, Clusters 2, 3, 8, 11 and 16 were induced by the drought treatment. In other words, approximately 33 MYB transcription factors were up-regulated under dehydration stress. The present data corrobo-rated earlier work which had suggested that MYB family transcription factors were involved in stress responses [6,65].
The second group of induced transcription factors contained factors from the basic helix-loop-helix (bHLH) family. A total of 57 bHLH genes were identified as drought-responsive genes in this study. Approximately 24, 2, 17, 1, 5, 3, 3, 1 and 1 bHLH transcription factors were identified in Cluster 1, Cluster 2, Cluster 3, Cluster 4, Cluster 5, Cluster 6, Cluster 8, Cluster 12 and Cluster 17, respectively (S10 File). Cluster 3 and Cluster 8 genes, whose transcription levels increased progressively under dehydration stress, contained 20 bHLH transcription factors. In addition, one bHLH transcription factor was up-regulated at D1, 11 bHLH novel genes were up-regulated at D3, 11 bHLH novel genes were up-regulated at D6, and three bHLH novel genes were up-regulated at DH24. Our data corroborates earlier research that had suggested that the bHLH genes were involved in ABA response regulation under stress conditions [64, 66].
The third group contained 45 WRKY genes that were induced by dehydration treatment. In this study, a total of 45 WRKY transcription factors were differentially expressed, and approxi-mately 4, 6, 23, 2, 3, 5, 1 and 1 WRKY transcription factors were identified in Cluster 1, Cluster 2, Cluster 3, Cluster 5, Cluster 6, Cluster 8, Cluster 9 and Cluster 11, respectively (S10 File). Moreover, one WRKY transcription factor was induced at D1, 23 WRKY novel genes were up-regulated at D3, nine WRKY novel genes were up-up-regulated at D6, and four novel genes were up-regulated at DH24. These results agree with earlier reports that WRKY transcription factors play important roles in regulating drought and other abiotic stress responses [67,68].
The fourth group contained NAC family genes, and a total of 39 genes belonging to this family were identified in this study. Among them, approximately 3, 2, 20, 3, 4, 6 and 1 NAC transcription factors were classified into Cluster 1, Cluster 2, Cluster 3, Cluster 4, Cluster 5, Cluster 6, Cluster 8, Cluster 9 and Cluster 11, respectively (S10 File). In addition, three NAC transcription factors were induced at D1, 12 novel NAC genes were up-regulated at D3, 13 novel NAC genes were up-regulated genes at D6, and four novel NAC genes were up-regulated at DH24. These results agreed with earlier reports that suggested that NAC genes played signif-icant roles in plant tolerance to various environmental stresses [63,69].
Validation of DEG-based gene expression
To validate the reliability of the drought responsive gene expression profiles for DEG, 16 genes were confirmed by quantitative real-time PCR using gene-specific primers (S11 File). These selected genes encoded dehydrin 5, dehydrin 2, dehydrin 4, dehydrin 1, heat stress transcrip-tion factor A-3-like, ethylene response factor 3, WRKY transcriptranscrip-tion factor, late embryogenesis abundant protein D-29, putative transcription factor bHLH041, CML13, PP2C, DREB6 and WRKY29. As shown inFig 6, it is evident that the expression patterns of the selected drought responsive genes produced by quantitative real—time PCR were largely consistent with the DEG data, despite the difference in the absolute fold change between the two methods. These results agreed with earlier reports that suggested that these selected genes played significant roles in plant tolerance to various environmental stresses [5,8,22,57,59,68,70,72,73]. It also showed that there is a high degree of correlation in expressional patterns between qPCR and RNA-Seq. In addition, The PCR efficiency (E) of each gene were ranked from 95.7% to 105.5%, the correlation coefficients (R2) was between 0.996 to 1.000. The result indicated that the primer for quantitative real-time PCR of each gene was appropriate (S11 File). This suggested
Fig 6. Quantitative RT-PCR validation of differential gene expression during dehydration.The left Y-axis indicates the gene expression levels calculated by the RPKM method. The right Y-axis indicates the relative gene expression levels.
that the results from this preliminary DEG data analysis were reliable, which was in agreement with previous report [21,74]. In addition, it also provides a basis for further investigation into the functions of these drought genes in the future.
Conclusions
The transcriptome data forPyrus betulaefolia, obtained by RNA-Seq, was used to identify and annotate a large number of DEGs involved in dehydration stress, which provides an excellent platform for future genetic and functional genomic research. Genes related to drought toler-ance and their expression profiles at four different dehydration stages and at one recovery stage were analyzed further. This offered new insights into the molecular mechanisms underlying pear drought tolerance. The up-regulated DEGs included some previously reported genes (e.g. NAC, DREB, bHLH and MYB) and some new genes (e.g. cytochrome P450, ERF1B and PYL) that are thought to be related to drought tolerance. In addition, a number of candidate target genes that could be used in future functional studies of the drought stress process were obtained. Taken together, in this study, we found metabolic changes of ABA and GA in pear. These changes worked as upstream of drought response and then leaded hormone signal changes. Hormone signal changes further caused TF expression changes and drought response in pear (S7 Fig). The data presented here gives an insight into the molecular changes underly-ing the drought process inPyrus betulaefolia, and the results can be used as a reference for identifying candidate genes that hold great potential for genetic engineering and for the crea-tion of novel germplasms with enhanced drought stress tolerance.
Supporting Information
S1 Fig. Water potential during the process of dehydration. (JPG)
S2 Fig. Percent coverage represents the percentage of unigenes mapped in our transcrip-tome data that showed a five-fold increase in expression during dehydration.Gene coverage is the percentage of a gene covered by reads. This value is the ratio of the number of bases in a gene covered by unique mapping reads to the total number of bases in that gene. The distribu-tion of unique reads over different read abundance categories show similar patterns for all five RNA-Seq libraries.
(TIF)
S3 Fig. DEGs between D0 and D1 in major metabolic pathway using MapMan. (JPG)
S4 Fig. DEGs between D0 and D3 in major metabolic pathway using MapMan. (JPG)
S5 Fig. DEGs between D0 and D6 in major metabolic pathway using MapMan. (JPG)
S6 Fig. DEGs between D0 and DH24 in major metabolic pathway using MapMan. (JPG)
S7 Fig. Model for drought response in pear. (TIF)
S1 File. Best hit counterparts in other plant species of the genes specifically up-regulated in a stage compared with other stages
S2 File. Significantly enriched pathway in KEGG in clusters. (XLSX)
S3 File. D0 stage specific down-regulated genes compared with DH24. (XLSX)
S4 File. D1 stage specific down-regulated genes compared with DH24. (XLSX)
S5 File. D3 stage specific down-regulated genes compared with DH24. (XLSX)
S6 File. D6 stage specific down-regulated genes compared with DH24. (XLSX)
S7 File. Common up-regulated genes in D1, D3, D6 and DH24. (XLSX)
S8 File. Common down-regulated genes in D1, D3, D6 and DH24. (XLSX)
S9 File. Significantly enriched Kyoto Encyclopedia of Genes and Genomes (KEGG) terms. (XLS)
S10 File. List of TFs in each cluster. (XLSX)
S11 File. Primers for sixteen DEGs were designed using Primer5 software based on the tar-get genes.
(DOCX)
Author Contributions
Conceived and designed the experiments: XSH KQL. Performed the experiments: KQL XSH. Analyzed the data: XSH KQL. Contributed reagents/materials/analysis tools: XSH KQL XYX. Wrote the paper: XSH KQL.
References
1. Aswath CR, Kim SH, Mo SY, Kim DH. Transgenic plants of creeping bent grass harboring the stress inducible gene, 9-cis-epoxycarotenoid dioxygenase, are highly tolerant to drought and NaCl stress. Plant growth regulation. 2005; 47(2–3):129–39. doi:10.1007/s10725-005-3380-6
2. Shinozaki K, Yamaguchi-Shinozaki K. Gene networks involved in drought stress response and toler-ance. Journal of experimental botany. 2007; 58(2):221–7. doi:10.1093/jxb/erl164PMID:17075077.
3. Bailly C, Audigier C, Ladonne F, Wagner MH, Coste F, Corbineau F, et al. Changes in oligosaccharide content and antioxidant enzyme activities in developing bean seeds as related to acquisition of drying tolerance and seed quality. Journal of experimental botany. 2001; 52(357):701–8. PMID:11413206.
4. Breton G, Danyluk J, Charron JBF, Sarhan F. Expression profiling and bioinformatic analyses of a novel stress-regulated multispanning transmembrane protein family from cereals and Arabidopsis. Plant physiology. 2003; 132(1):64–74. doi:10.1104/pp.102.015255PMID:12746512.
5. Wang YC, Jiang J, Zhao X, Liu GF, Yang CP, Zhan LP. A novel LEA gene from Tamarix androssowii confers drought tolerance in transgenic tobacco. Plant Science. 2006; 171(6):655–62. doi:10.1016/j. plantsci.2006.06.011
6. Abe H, YamaguchiShinozaki K, Urao T, Iwasaki T, Hosokawa D, Shinozaki K. Role of Arabidopsis MYC and MYB homologs in drought- and abscisic acid-regulated gene expression. The Plant Cell. 1997; 9(10):1859–68. doi:10.1105/tpc.9.10.1859PMID:9368419.
8. Mare C, Mazzucotelli E, Crosatti C, Francia E, Stanca AM, Cattivelli L. Hv-WRKY38: a new transcription factor involved in cold- and drought-response in barley. Plant molecular biology. 2004; 55(3):399–416. doi:10.1007/s11103-004-0906-7PMID:15604689.
9. Song CP, Agarwal M, Ohta M, Guo Y, Halfter U, Wang PC, et al. Role of an Arabidopsis AP2/EREBP-type transcriptional repressor in abscisic acid and drought stress responses. The Plant Cell. 2005; 17 (8):2384–96. doi:10.1105/tpc.105.033043PMID:15994908.
10. Eulgem T. Regulation of the Arabidopsis defense transcriptome. Trends in plant science. 2005; 10 (2):71–8. doi:10.1016/j.tplants.2004.12.006PMID:15708344.
11. Gong PJ, Zhang JH, Li HX, Yang CX, Zhang CJ, Zhang XH, et al. Transcriptional profiles of drought-responsive genes in modulating transcription signal transduction, and biochemical pathways in tomato. Journal of experimental botany. 2010; 61(13):3563–75. doi:10.1093/jxb/erq167PMID:20643807.
12. Rabbani MA, Maruyama K, Abe H, Khan MA, Katsura K, Ito Y, et al. Monitoring expression profiles of rice genes under cold, drought, and high-salinity stresses and abscisic acid application using cDNA microarray and RNA get-blot analyses. Plant physiology. 2003; 133(4):1755–67. doi:10.1104/pp.103. 025742PMID:14645724.
13. Talame V, Ozturk NZ, Bohnert HJ, Tuberosa R. Barley transcript profiles under dehydration shock and drought stress treatments: a comparative analysis. Journal of experimental botany. 2007; 58(2):229– 40. Epub 2006/11/18. doi:10.1093/jxb/erl163PMID:17110587.
14. Miao WG, Wang XB, Song CF, Wang Y, Ren YH, Wang JS. Transcriptome analysis of Hpa1(Xoo) transformed cotton revealed constitutive expression of genes in multiple signalling pathways related to disease resistance. Journal of experimental botany. 2010; 61(15):4263–75. doi:10.1093/jxb/erq227 PMID:20667962.
15. Hayano-Kanashiro C, Calderon-Vazquez C, Ibarra-Laclette E, Herrera-Estrella L, Simpson J. Analysis of Gene Expression and Physiological Responses in Three Mexican Maize Landraces under Drought Stress and Recovery Irrigation. PLoS One. 2009; 4(10). ARTN e7531 doi:10.1371/journal.pone. 0007531PMID:19888455.
16. Pratt LH, Liang C, Shah M, Sun F, Wang HM, Reid SP, et al. Sorghum expressed sequence tags iden-tify signature genes for drought, pathogenesis, and skotomorphogenesis from a milestone set of 16,801 unique transcripts. Plant physiology. 2005; 139(2):869–84. doi:10.1104/pp.105.066134PMID: 16169961.
17. Seki M, Narusaka M, Ishida J, Nanjo T, Fujita M, Oono Y, et al. Monitoring the expression profiles of 7000 Arabidopsis genes under drought, cold and high-salinity stresses using a full-length cDNA micro-array. Plant journal. 2002; 31(3):279–92. doi:10.1046/j.1365-313X.2002.01359.xPMID:12164808.
18. Huang DQ, Wu WR, Abrams SR, Cutler AJ. The relationship of drought-related gene expression in Ara-bidopsis thaliana to hormonal and environmental factors. Journal of experimental botany. 2008; 59 (11):2991–3007. doi:10.1093/jxb/ern155PMID:18552355.
19. Zong Y, Sun P, Liu J, Yue XY, Niu QF, Teng YW. Chloroplast DNA-based genetic diversity and phylo-geography of Pyrus betulaefolia (Rosaceae) in Northern China. Tree Genet Genomes. 2014; 10 (3):739–49. doi:10.1007/s11295-014-0718-0
20. Okubo M, Sakuratani T. Effects of sodium chloride on survival and stem elongation of two Asian pear rootstock seedlings. Scientia Horticulturae. 2000; 85(1–2):85–90. doi: 10.1016/S0304-4238(99)00141-7
21. Huang XS, Li KQ, Xu XY, Yao ZH, Jin C, Zhang SL. Genome-wide analysis of WRKY transcription fac-tors in white pear (Pyrus bretschneideri) reveals evolution and patterns under drought stress. BMC genomics. 2015; 16(1):1104. Epub 2015/12/26. doi:10.1186/s12864-015-2233-6PMID:26704366; PubMed Central PMCID: PMC4691019.
22. Huang XS, Li KQ, Jin C, Zhang SL. ICE1 of Pyrus ussuriensis functions in cold tolerance by enhancing PuDREBa transcriptional levels through interacting with PuHHP1. Scientific reports. 2015; 5. Artn 17620 doi:10.1038/Srep17620PMID:26626798.
23. Qi XX, Wu J, Wang LF, Li LT, Cao YF, Tian LM, et al. Identifying the candidate genes involved in the calyx abscission process of 'Kuerlexiangli' (Pyrus sinkiangensis Yu) by digital transcript abundance measurements. BMC genomics. 2013; 14. Artn 727 doi:10.1186/1471-2164-14-727PMID:24152304.
24. Wu J, Wang ZW, Shi ZB, Zhang S, Ming R, Zhu SL, et al. The genome of the pear (Pyrus bretschneideri Rehd.). Genome Res. 2013; 23(2):396–408. doi:10.1101/gr.144311.112PMID:23149293.
25. Li RQ, Yu C, Li YR, Lam TW, Yiu SM, Kristiansen K, et al. SOAP2: an improved ultrafast tool for short read alignment. Bioinformatics. 2009; 25(15):1966–7. doi:10.1093/bioinformatics/btp336PMID: 19497933.
27. Audic S, Claverie JM. The significance of digital gene expression profiles. Genome Res. 1997; 7 (10):986–95. PMID:9331369.
28. de Hoon MJL, Imoto S, Nolan J, Miyano S. Open source clustering software. Bioinformatics. 2004; 20 (9):1453–4. doi:10.1093/bioinformatics/bth078PMID:14871861.
29. Saldanha AJ. Java Treeview-extensible visualization of microarray data. Bioinformatics. 2004; 20 (17):3246–8. doi:10.1093/bioinformatics/bth349PMID:15180930.
30. Mulder NJ, Apweiler R, Attwood TK, Bairoch A, Barrell D, Bateman A, et al. The InterPro Database, 2003 brings increased coverage and new features. Nucleic acids research. 2003; 31(1):315–8. doi:10. 1093/nar/gkg046PMID:12520011.
31. Zdobnov EM, Apweiler R. InterProScan—an integration platform for the signature-recognition methods in InterPro. Bioinformatics. 2001; 17(9):847–8. doi:10.1093/bioinformatics/17.9.847PMID:12520011.
32. Harris MA, Clark J, Ireland A, Lomax J, Ashburner M, Foulger R, et al. The Gene Ontology (GO) data-base and informatics resource. Nucleic acids research. 2004; 32:D258–D61. doi:10.1093/nar/gkh036 PMID:14681407.
33. Ye J, Fang L, Zheng HK, Zhang Y, Chen J, Zhang ZJ, et al. WEGO: a web tool for plotting GO annota-tions. Nucleic acids research. 2006; 34:W293–W7. doi:10.1093/nar/gkl1031PMID:16845012.
34. Kanehisa M, Goto S, Hattori M, Aoki-Kinoshita KF, Itoh M, Kawashima S, et al. From genomics to chemical genomics: new developments in KEGG. Nucleic acids research. 2006; 34:D354–D7. doi:10. 1093/nar/gkj102PMID:16381885.
35. Livak KJ, Schmittgen TD. Analysis of relative gene expression data using real-time quantitative PCR and the 2(T)(-Delta Delta C) method. Methods. 2001; 25(4):402–8. doi:10.1006/meth.2001.1262 PMID:11846609.
36. Huang XS, Liu JH, Chen XJ. Overexpression of PtrABF gene, a bZIP transcription factor isolated from Poncirus trifoliata, enhances dehydration and drought tolerance in tobacco via scavenging ROS and modulating expression of stress-responsive genes. BMC plant biology. 2010; 10. Artn 230 doi:10. 1186/1471-2229-10-230PMID:20973995.
37. Huang XS, Luo T, Fu XZ, Fan QJ, Liu JH. Cloning and molecular characterization of a mitogen-acti-vated protein kinase gene from Poncirus trifoliata whose ectopic expression confers dehydration/ drought tolerance in transgenic tobacco. Journal of experimental botany. 2011; 62(14):5191–206. doi: 10.1093/jxb/err229PMID:21778184.
38. Fernandez-Calvo P, Chini A, Fernandez-Barbero G, Chico JM, Gimenez-Ibanez S, Geerinck J, et al. The Arabidopsis bHLH Transcription Factors MYC3 and MYC4 Are Targets of JAZ Repressors and Act Additively with MYC2 in the Activation of Jasmonate Responses. The Plant cell. 2011; 23(2):701–15. doi:10.1105/tpc.110.080788PMID:21335373.
39. Gorton HL. Water Relations in Pulvini from Samanea-Saman .1. Intact Pulvini. Plant physiology. 1987; 83(4):945–50. doi:10.1104/Pp.83.4.945PMID:16665369.
40. Xu YJ, Gao S, Yang YJ, Huang MY, Cheng LN, Wei Q, et al. Transcriptome sequencing and whole genome expression profiling of chrysanthemum under dehydration stress. BMC genomics. 2013; 14. Artn 662 doi:10.1186/1471-2164-14-662PMID:24074255.
41. Wang Z, Gerstein M, Snyder M. RNA-Seq: a revolutionary tool for transcriptomics. Nature reviews genetics. 2009; 10(1):57–63. doi:10.1038/nrg2484I PMID:19015660.
42. Bray EA. Genes commonly regulated by water-deficit stress in Arabidopsis thaliana. Journal of experi-mental botany. 2004; 55(407):2331–41. doi:10.1093/jxb/erh270PMID:15448178.
43. Huang XS, Wang W, Zhang Q, Liu JH. A Basic Helix-Loop-Helix Transcription Factor, PtrbHLH, of Pon-cirus trifoliata Confers Cold Tolerance and Modulates Peroxidase-Mediated Scavenging of Hydrogen Peroxide. Plant physiology. 2013; 162(2):1178–94. doi:10.1104/pp.112.210740PMID:23624854.
44. Ning J, Li XH, Hicks LM, Xiong LZ. A Raf-Like MAPKKK Gene DSM1 Mediates Drought Resistance through Reactive Oxygen Species Scavenging in Rice. Plant physiology. 2010; 152(2):876–90. doi:10. 1104/pp.109.149856PMID:20007444.
45. Morano KA. New tricks for an old dog: The evolving world of Hsp70. Annals of the New York Academy of Sciences. 2007; 1113:1–14. doi:10.1196/annals.1391.018PMID:17513460.
46. Du Z, Zhou X, Ling Y, Zhang ZH, Su Z. agriGO: a GO analysis toolkit for the agricultural community. Nucleic acids research. 2010; 38:W64–W70. doi:10.1093/nar/gkq310PMID:20435677.
47. Lenka SK, Katiyar A, Chinnusamy V, Bansal KC. Comparative analysis of drought-responsive tran-scriptome in Indica rice genotypes with contrasting drought tolerance. Plant biotechnology journal. 2011; 9(3):315–27. doi:10.1111/j.1467-7652.2010.00560.xPMID:20809928.
reproductive stage. Journal of experimental botany. 2009; 60(12):3531–44. doi:10.1093/jxb/erp194 PMID:19561048.
49. Chaves MM, Flexas J, Pinheiro C. Photosynthesis under drought and salt stress: regulation mecha-nisms from whole plant to cell. Annals of botany. 2009; 103(4):551–60. doi:10.1093/aob/mcn125 PMID:18662937.
50. Chaves M, Flexas J, Pinheiro C. Photosynthesis under drought and salt stress—regulation mecha-nisms from the whole plant to cell. Photosynthesis research. 2007; 91(2–3):300–300.
51. Tena G, Asai T, Chiu WL, Sheen J. Plant mitogen-activated protein kinase signaling cascades. Current opinion in plant biology. 2001; 4(5):392–400. doi:10.1016/S1369-5266(00)00191-6PMID:11597496.
52. Nakagami H, Pitzschke A, Hirt H. Emerging MAP kinase pathways in plant stress signalling. Trends in plant science. 2005; 10(7):339–46. doi:10.1016/j.tplants.2005.05.009PMID:15953753.
53. Urano K, Maruyama K, Ogata Y, Morishita Y, Takeda M, Sakurai N, et al. Characterization of the ABA-regulated global responses to dehydration in Arabidopsis by metabolomics. The Plant journal. 2009; 57 (6):1065–78. doi:10.1111/j.1365-313X.2008.03748.xPMID:19036030.
54. Shinozaki K, Yamaguchi-Shinozaki K. Gene networks involved in drought stress response and toler-ance. Journal of experimental botany. 2007; 58(2):221–7. Epub 2006/11/01. doi:10.1093/jxb/erl164 PMID:17075077.
55. Umezawa T, Okamoto M, Kushiro T, Nambara E, Oono Y, Seki M, et al. CYP707A3, a major ABA 8'-hydroxylase involved in dehydration and rehydration response in Arabidopsis thaliana. The Plant jour-nal. 2006; 46(2):171–82. Epub 2006/04/21. doi:10.1111/j.1365-313X.2006.02683.xPMID:16623881.
56. Colebrook EH, Thomas SG, Phillips AL, Hedden P. The role of gibberellin signalling in plant responses to abiotic stress. Journal of experimental biology. 2014; 217(Pt 1):67–75. Epub 2013/12/20. doi:10. 1242/jeb.089938PMID:24353205.
57. Fujii H, Verslues PE, Zhu JK. Arabidopsis decuple mutant reveals the importance of SnRK2 kinases in osmotic stress responses in vivo. Proceedings of the National Academy of Sciences of the United States of America. 2011; 108(4):1717–22. doi:10.1073/pnas.1018367108PMID:21220313.
58. Sharp RE, LeNoble ME. ABA, ethylene and the control of shoot and root growth under water stress. Journal of experimental botany. 2002; 53(366):33–7. doi:10.1093/jexbot/53.366.33PMID:11741038.
59. Fujii H, Chinnusamy V, Rodrigues A, Rubio S, Antoni R, Park SY, et al. In vitro reconstitution of an abscisic acid signalling pathway. Nature. 2009; 462(7273):660–U138. doi:10.1038/nature08599 PMID:19924127.
60. Boudsocq M, Droillard MJ, Barbier-Brygoo H, Lauriere C. Different phosphorylation mechanisms are involved in the activation of sucrose non-fermenting 1 related protein kinases 2 by osmotic stresses and abscisic acid. Plant molecular biology. 2007; 63(4):491–503. doi:10.1007/s11103-006-9103-1 PMID:17103012.
61. Bray EA. Genes commonly regulated by water-deficit stress in Arabidopsis thaliana. Journal of experi-mental botany. 2004; 55(407):2331–41. Epub 2004/09/28. doi:10.1093/jxb/erh270PMID:15448178.
62. Liu JH, Peng T, Dai WS. Critical cis-Acting Elements and Interacting Transcription Factors: Key Players Associated with Abiotic Stress Responses in Plants. Plant molecular biology reporter. 2014; 32 (2):303–17. doi:10.1007/s11105-013-0667-z
63. Hu HH, Dai MQ, Yao JL, Xiao BZ, Li XH, Zhang QF, et al. Overexpressing a NAM, ATAF, and CUC (NAC) transcription factor enhances drought resistance and salt tolerance in rice. Proceedings of the National Academy of Sciences of the United States of America. 2006; 103(35):12987–92. doi:10.1073/ pnas.0604882103PMID:16924117.
64. Abe H, Urao T, Ito T, Seki M, Shinozaki K, Yamaguchi-Shinozaki K. Arbaidopsis AtMYC2 (bHLH) and AtMYB2 (MYB) function as transcriptional activators in abscisic acid signaling. The Plant cell. 2003; 15 (1):63–78. doi:10.1105/tpc.006130PMID:12509522.
65. Cominelli E, Galbiati M, Vavasseur A, Conti L, Sala T, Vuylsteke M, et al. A guard-cell-specific MYB transcription factor regulates stomatal movements and plant drought tolerance. Current biology. 2005; 15(13):1196–200. doi:10.1016/j.cub.2005.05.048PMID:16005291.
66. Li HM, Sun JQ, Xu YX, Jiang HL, Wu XY, Li CY. The bHLH-type transcription factor AtAIB positively regulates ABA response in Arabidopsis. Plant molecular biology. 2007; 65(5):655–65. doi:10.1007/ s11103-007-9230-3PMID:17828375.
67. Zou XL, Shen QJX, Neuman D. An ABA inducible WRKY gene integrates responses of creosote bush (Larrea tridentata) to elevated CO2 and abiotic stresses. Plant Science. 2007; 172(5):997–1004. doi: 10.1016/j.plantsci.2007.02.003
69. Zheng XN, Chen B, Lu GJ, Han B. Overexpression of a NAC transcription factor enhances rice drought and salt tolerance. Biochemical and biophysical research communications. 2009; 379(4):985–9. doi: 10.1016/j.bbrc.2008.12.163PMID:19135985.
70. Storozhenko S, De Pauw P, Van Montagu M, Inze D, Kushnir S. The heat-shock element is a functional component of the Arabidopsis APX1 gene promoter. Plant physiology. 1998; 118(3):1005–14. doi:10. 1104/pp.118.3.1005PMID:9808745.
71. Wang WX, Vinocur B, Shoseyov O, Altman A. Role of plant heat-shock proteins and molecular chaper-ones in the abiotic stress response. Trends in plant science. 2004; 9(5):244–52. doi:10.1016/j.tplants. 2004.03.006PMID:15130550.
72. Rong W, Qi L, Wang AY, Ye XG, Du LP, Liang HX, et al. The ERF transcription factor TaERF3 pro-motes tolerance to salt and drought stresses in wheat. Plant biotechnology journal. 2014; 12(4):468– 79. doi:10.1111/pbi.12153PMID:24393105.
73. Hanin M, Brini F, Ebel C, Toda Y, Takeda S, Masmoudi K. Plant dehydrins and stress tolerance: versa-tile proteins for complex mechanisms. Plant signaling & behavior. 2011; 6(10):1503–9. Epub 2011/09/ 08. doi:10.4161/psb.6.10.17088PMID:21897131.