BGD
11, 5443–5469, 2014Net vs. gross anthropogenic land
use changes
S. Wilkenskjeld et al.
Title Page
Abstract Introduction
Conclusions References
Tables Figures
◭ ◮
◭ ◮
Back Close
Full Screen / Esc
Printer-friendly Version Interactive Discussion
Discussion
P
a
per
|
D
iscussion
P
a
per
|
Discussion
P
a
per
|
Discuss
ion
P
a
per
|
Biogeosciences Discuss., 11, 5443–5469, 2014 www.biogeosciences-discuss.net/11/5443/2014/ doi:10.5194/bgd-11-5443-2014
© Author(s) 2014. CC Attribution 3.0 License.
Open Access
Biogeosciences
Discussions
This discussion paper is/has been under review for the journal Biogeosciences (BG). Please refer to the corresponding final paper in BG if available.
Comparing the influence of net and gross
anthropogenic land use and land cover
changes on the carbon cycle in the
MPI-ESM
S. Wilkenskjeld, S. Kloster, J. Pongratz, T. Raddatz, and C. Reick
Land in the Earth System, Max-Planck-Institute for Meteorology, Hamburg, Germany Received: 24 January 2014 – Accepted: 26 March 2014 – Published: 4 April 2014 Correspondence to: S. Wilkenskjeld ([email protected])
BGD
11, 5443–5469, 2014Net vs. gross anthropogenic land
use changes
S. Wilkenskjeld et al.
Title Page
Abstract Introduction
Conclusions References
Tables Figures
◭ ◮
◭ ◮
Back Close
Full Screen / Esc
Printer-friendly Version Interactive Discussion
Discussion
P
a
per
|
D
iscussion
P
a
per
|
Discussion
P
a
per
|
Discuss
ion
P
a
per
|
Abstract
Global vegetation models traditionally treat anthropogenic land use and land cover changes (LULCC) only as the changes in vegetation cover seen from one year to the next (net transitions). This approach ignores sub-grid-scale processes such as shifting cultivation which do not affect the net vegetation distribution but which
5
have an impact on the carbon budget. The simulations for the Coupled Model Intercomparison Project Phase 5 (CMIP5) all describe LULCC using the Harmonized Land-Use Protocol. Though this protocol describes such sub-grid-scale processes (gross transitions), some of the CMIP5 models still use the traditional approach. Using JSBACH/CBALANCE – the land carbon component of the Max Planck Institute
10
Earth System Model (MPI-ESM), this study demonstrates how this potentially leads to a severe underestimation of the carbon emissions from LULCC. Using net transitions lowers the average land use emissions from 1.44 to 0.90 Pg C yr−1 (38 %) during the historical period (1850–2005) – a total lowering by 85 Pg C. The difference between the methods is smaller in the RCP-scenarios (2006–2100) but in RCP2.6 and RCP8.5
15
still cumulates to 30–40 Pg C (on average 0.3–0.4 Pg C yr−1 or 13–25 %). In RCP4.5 essentially no difference between the methods is found. Results from models using net transitions are furthermore found to be sensitive to model resolution.
1 Introduction
Since prehistoric times humans have been changing the surface of the Earth to
20
suit their purposes (Williams, 2006). These changes include conversion of natural vegetation to agricultural land (e.g. by slash burning) and wood harvest for fuel and construction usage. The anthropogenic land use and land cover changes (LULCC) have increased with growing human population and its associated agricultural needs (Pongratz et al., 2008). LULCC remove carbon from the natural vegetation and
25
BGD
11, 5443–5469, 2014Net vs. gross anthropogenic land
use changes
S. Wilkenskjeld et al.
Title Page
Abstract Introduction
Conclusions References
Tables Figures
◭ ◮
◭ ◮
Back Close
Full Screen / Esc
Printer-friendly Version Interactive Discussion
Discussion
P
a
per
|
D
iscussion
P
a
per
|
Discussion
P
a
per
|
Discuss
ion
P
a
per
|
carbon emissions from LULCC exceeded other anthropogenic carbon sources (such as burning of fossil fuel and cement production) until far after the onset of the industrialization (Houghton et al., 1983; Pongratz et al., 2009; Reick et al., 2010). Still in the 1980s, carbon emissions from LULCC accounted for up to 20 % of the total anthropogenic carbon emissions (Denman, 2007). The published LULCC carbon
5
emissions (Houghton et al., 2012, and references therein) exibit a huge span. Several studies have addressed possible reasons for this span: different model type (Houghton et al., 2012; Reick et al., 2010), different LULCC data sets applied (Shevliakova et al., 2009; Jain et al., 2013), nitrogen limitation on regrowth (Jain et al., 2013) and different definitions of what is meant by LULCC emissions (Pongratz et al., 2014). This study
10
addresses the differences arising from the inclusion or exclusion of sub-grid-scale LULCC which is the difference between net and gross LULCC algorithms.
In the framework of the 5th phase of the Coupled Model Intercomparison Project (CMIP5) a series of experiments covering the recent past and future scenarios were defined to facilitate direct comparisions between the results of different coupled
15
models (Taylor et al., 2012) contributing to the 5th Assessment Report (AR5) of the Intergovernmental Panel on Climate Change (IPCC). Several of the Earth System Models (ESMs) participating in CMIP5 implemented LULCC into an interactive carbon cycle. However, the implementation details of LULCC in the different ESMs are diverse (Brovkin et al., 2013), and so are the results with respect to the influence of LULCC on
20
the carbon cycle (Houghton et al., 2012, and references therein). One aspect in which the implementations differ, is whether the models implement LULCC by a net or a gross algorithm.
Gross algorithms account for the possibility that there might be grid cells in which at some time, e.g., grassland is turned into cropland while at the same time elsewhere
25
BGD
11, 5443–5469, 2014Net vs. gross anthropogenic land
use changes
S. Wilkenskjeld et al.
Title Page
Abstract Introduction
Conclusions References
Tables Figures
◭ ◮
◭ ◮
Back Close
Full Screen / Esc
Printer-friendly Version Interactive Discussion
Discussion
P
a
per
|
D
iscussion
P
a
per
|
Discussion
P
a
per
|
Discuss
ion
P
a
per
|
some years, abandoning it again while clearing another piece of natural land – is a common practice (Lanly, 1985; Ranjan and Upadhyay, 1999; Bruun et al., 2006; Lojka et al., 2011). Though shifting cultivation does not change the vegetation distribution, as it is seen by global models, it releases carbon from the natural vegetation. These carbon fluxes are not accounted for when using a net algorithm.
5
Though already Houghton et al. (1983) included gross conversion effects in their book-keeping model, Hurtt et al. (2006) was the first to provide a data set which accounts for such cultivation practices by describing the anthropogenic land surface transformations within a grid cell bi-directionally in a form usable by grid cell based global vegetation models (GVMs). An update to this data set – the so called
10
Harmonized Protocol – was presented in Hurtt et al. (2011) and used by all CMIP5 models implementing LULCC.
The present study adresses the differences in carbon emissions arising from applying net or gross transitions using the same model, JSBACH/CBALANCE, by re-running a sub-set of the CMIP5 experiments performed with the Max Planck Institute
15
for Meteorology Earth System Model (MPI-ESM) (Giorgetta et al., 2013).
Section 2 describes the model and how LULCC (both gross and net) is implemented, Sect. 3 explains the performed experiments while the results are described in Sect. 4 and discussed in a broader context in Sect. 5.
2 The model 20
In the present study CBALANCE, the carbon cycle and vegetation distribution component of the land vegetation model JSBACH (Raddatz et al., 2007; Brovkin et al., 2009; Reick et al., 2013) of the MPI-ESM, was used. CBALANCE can be run as a standalone model, which is capable of reproducing exactly the results of the coupled MPI-ESM model with respect to the land carbon cycle and land vegetation cover, when
25
BGD
11, 5443–5469, 2014Net vs. gross anthropogenic land
use changes
S. Wilkenskjeld et al.
Title Page
Abstract Introduction
Conclusions References
Tables Figures
◭ ◮
◭ ◮
Back Close
Full Screen / Esc
Printer-friendly Version Interactive Discussion
Discussion
P
a
per
|
D
iscussion
P
a
per
|
Discussion
P
a
per
|
Discuss
ion
P
a
per
|
CBALANCE was run globally in the same setup as the MPI-ESM CMIP5 LR-experiments (Giorgetta et al., 2013; Schneck et al., 2013) – i.e. on the T63 grid (resolution of≈1.87×1.87◦). In each grid cell up to 11 plant functional types (PFTs) out of a total of 13 different PFTs (4 forest, 2 shrub, 2 grassland, 2 pasture, 2 crop and 1 glacier/other permanently unhospitable land) can be present. Furthermore each grid
5
cell can contain a fraction of temporarily unhospitable land (desert) (see Reick et al., 2013).
2.1 Land use transitions
In JSBACH/CBALANCE the LULCC in each grid cell is described by annual conversion factors of the bidirectional transformations between any pair of the three vegetation
10
classes: natural (which includes forest, shrublands and unmanaged grasslands, subscript: N), pasture (P) and crop (C):
cN cC cP
k+1 =
αN→NαC→NαP→N αN→CαC→CαP→C αN→PαC→PαP→P
cN cC cP
k
(1)
where c is the fraction of a grid cell vegetated with plants from the corresponding
15
vegtation class, k is the discrete time and the conversion factors α are the fraction of the area of a given vegetation class converted to a given other vegetation class. The six off-diagonal matrix elements are obtained from an external data set. Due to conservation of area, the diagonal elements are given by: αi→i =1−P
j,j6=iαi→j for
i,j∈ {N, C, P}. Since this formulation allows simultaneous conversions betweeen any
20
pair of vegetation classes, JSBACH/CBALANCE is capable of doing gross LULCC. In general, the area converted between vegetation classes is distributed so that each PFT within the relevant vegetation classes gains or looses the same fraction of its area. However, to emulate typical cultural practices JSBACH/CBALANCE treats forest (incl. shrublands) and grasslands as two different vegetation classes. For
BGD
11, 5443–5469, 2014Net vs. gross anthropogenic land
use changes
S. Wilkenskjeld et al.
Title Page
Abstract Introduction
Conclusions References
Tables Figures
◭ ◮
◭ ◮
Back Close
Full Screen / Esc
Printer-friendly Version Interactive Discussion
Discussion
P
a
per
|
D
iscussion
P
a
per
|
Discussion
P
a
per
|
Discuss
ion
P
a
per
|
conversion from natural vegetation to pasture, preferentially grasslands are converted, and conversely reestablishment of forest has priority when pasture is abandoned. When converting natural vegetation to crops, the land is taken from both forest and grasslands proportional to their fraction of area after eventual conversions from natural vegetation to pasture has been applied. Details on this “pasture-rule” and LULCC in
5
JSBACH/CBALANCE in general are found in Reick et al. (2013).
In JSBACH/CBALANCE 80 % of the carbon of the living plants on the converted area is released to the atmosphere immediately while the remaing 20 % is transformed to litter. The litter carbon already present at the converted area is assumed to stay where it is physically located and is thus reassigned to the PFT taking over the location.
10
2.2 Net land use transitions
Net transitions are applied using the standard JSBACH/CBALANCE transition scheme, but using a reduced data set derived from the gross data set during run-time. The derivation is done by applying the principle of minimum transitions: at the start of each year, the annual gross transitions are – using Eq. (1) – applied to the actual
PFT-15
distribution to obtain the PFT-distribution at the start of the next year. The difference between the two PFT-distributions is then used to determine the conversion factors resulting in the same PFT-distribution minimizing the land conversions. In this case at most two of the non-diagonal factorsαare non-zero. This is equivalent to the traditional approach, pre-describing a map with the vegetation distribution each year.
20
2.3 Harvest of carbon from natural vegetation
Harvest of natural vegetation is the process of humans removing part of the biomass without altering the type of vegetation – i.e. a forest is still a forest though a few trees are removed. In JSBACH/CBALANCE wood harvest is implemented as a pre-described removal of biomass in terms of carbon. All natural PFT’s contribute carbon to the
25
BGD
11, 5443–5469, 2014Net vs. gross anthropogenic land
use changes
S. Wilkenskjeld et al.
Title Page
Abstract Introduction
Conclusions References
Tables Figures
◭ ◮
◭ ◮
Back Close
Full Screen / Esc
Printer-friendly Version Interactive Discussion
Discussion
P
a
per
|
D
iscussion
P
a
per
|
Discussion
P
a
per
|
Discuss
ion
P
a
per
|
the harvested carbon (20 %) is released directly to the atmosphere at the time of harvest. The rest is treated as litter and is respired to the atmosphere with a time delay. Depending on the climatic conditions and vegetation a small fraction of the harvested carbon may be deposited in the soil for a very long time.
3 Data and experiments 5
The carbon fluxes presented in this study are equivalent to the “net land use flux” as defined in Pongratz et al. (2014), but to avoid confusion about the word “net”, here the fluxes are termed “land use carbon emissions” (LCE). The cumulated LCE is the difference between the total carbon stored on land between an experiment with LULCC and one whithout. This method takes into account both the direct carbon transfer
10
to the atmosphere, indirect effects like adjustment of primary production as well as delayed emissions from soil/litter respiration. In experiments without LULCC wood is still harvested at a fixed rate corresponding to the prescribed rate at the starting year of the experiment. Comparing LCE from gross and net transitions thus requires three experiments for each scenario: one without LULCC, one with gross and one with net
15
LULCC.
The LULCC data used (including data on wood harvest), were taken from the Harmonized Protocol (Hurtt et al., 2011) also used for the MPI-ESM CMIP5-experiments. All experiments were applying the dynamic vegetation of JSBACH/CBALANCE (Brovkin et al., 2009, 2013; Reick et al., 2013) to determine the
20
distribution of deserts and natural PFTs.
CBALANCE was forced with the daily output from the MPI-ESM CMIP5-scenarios from MPI-ESM ensemble member “r1” (Giorgetta et al., 2013) from the respective scenario, and the initial (1850) vegetation distribution and carbon pools were accordingly taken from thepiControlexperiment.
25
Four of the CMIP5-scenarios (Taylor et al., 2012) were redone: the historical
BGD
11, 5443–5469, 2014Net vs. gross anthropogenic land
use changes
S. Wilkenskjeld et al.
Title Page
Abstract Introduction
Conclusions References
Tables Figures
◭ ◮
◭ ◮
Back Close
Full Screen / Esc
Printer-friendly Version Interactive Discussion
Discussion
P
a
per
|
D
iscussion
P
a
per
|
Discussion
P
a
per
|
Discuss
ion
P
a
per
|
rcp2.6(van Vuuren et al., 2011b),rcp4.5(Thomson et al., 2011) andrcp8.5(Riahi
et al., 2011). In total 12 runs were performed, logically assigned to six experiments (Table 1) dependent on the time period and the LULCC type (i.e. no LULCC, net LULCC or gross LULCC).
The experiments hist_gross and RCP_gross exactly reproduce the
CMIP5-5
experiments with the coupled MPI-ESM, hist_net and RCP_net are equivalent, just using net transitions instead of gross and hist_none and RCP_none serve as reference runs for LCE calculations for the respectivegross/netexperiments.
4 Results
4.1 Vegetation distribution 10
4.1.1 Natural changes
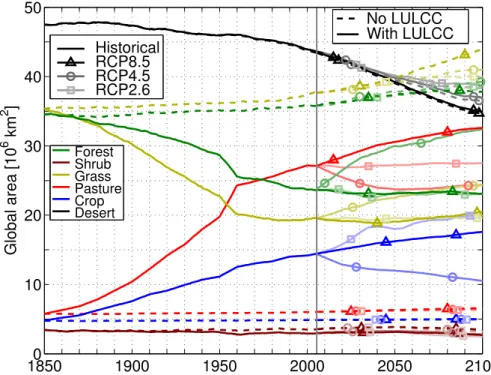
Due to the dynamic vegetation in JSBACH/CBALANCE and a changing climate, vegetation distribution is changing over time even in the experiments not applying LULCC (hist_none, RCP_none, dashed lines in Fig. 1). From 1850 to 2100 the desert area decreases by 9–12.5×10⁶km2(depending on the RCP-scenario) of which
15
1/2–2/3 occur during the RCP-period (2006–2100). The decrease mainly occurs in high northern latitudes and is compensated by a proportional increase in all natural vegetation classes. The decrease of desert area is largest forRCP8.5, less forRCP4.5
and least forRCP2.6.
4.1.2 Changes from LULCC 20
BGD
11, 5443–5469, 2014Net vs. gross anthropogenic land
use changes
S. Wilkenskjeld et al.
Title Page
Abstract Introduction
Conclusions References
Tables Figures
◭ ◮
◭ ◮
Back Close
Full Screen / Esc
Printer-friendly Version Interactive Discussion
Discussion
P
a
per
|
D
iscussion
P
a
per
|
Discussion
P
a
per
|
Discuss
ion
P
a
per
|
crop and 21.3×10⁶km2of pasture is gained. The areas actually converted during the period are much larger (gross:≈135×106km2, net:≈58×106km2), but most of these conversions cancel each other globally (both LULCC forms) and on sub-grid scale (gross LULCC only).
In the RCP4.5 scenario the natural vegetation has in year 2100 regained about
5
1/3 of the area which was cultivated during the historical period – partly by reducing agricultural land, partly because of forest expansion in the high northern latitude desert areas.RCP2.6andRCP8.5both show a stabilization of the global natural vegetation (about 24×106km2 forest and 20×106km2 grassland). This global stabilization however stems from decreasing forests in the Southern Hemisphere compensated by
10
an increase in forest area in the high northern latitudes. These two scenarios increase cultivated areas, globally balancing the decreasing desert area, which is slightly less (up to 500×103km2) with LULCC than without. InRCP8.5both crop and pasture areas ares increased, while inRCP2.6mainly cropland is increased.
It is expected that gross and net LULCC result in the same vegetation distribution
15
(Fig. 1). Due to non-linear interactions between LULCC, the dynamic vegetation and wildfires, this is however not entirely fulfilled. LULCC removes carbon from the natural vegetation and litter. Since wildfire activity depends on the availability of litter, there is less fire when applying gross LULCC. Though applying net instead of gross LULCC regionally causes a large increase in wildfire activity, average global burned area only
20
increases by less than 1 %. Since grass is faster in occupying the bare land left after fires (Reick et al., 2013), net LULCC results in up to about 300×103km2extra grassland on the cost of forests globally. Since this difference is very small compared to the total arable land (≈100×106km2) this imbalance is considered unimportant for the further analysis.
BGD
11, 5443–5469, 2014Net vs. gross anthropogenic land
use changes
S. Wilkenskjeld et al.
Title Page
Abstract Introduction
Conclusions References
Tables Figures
◭ ◮
◭ ◮
Back Close
Full Screen / Esc
Printer-friendly Version Interactive Discussion
Discussion
P
a
per
|
D
iscussion
P
a
per
|
Discussion
P
a
per
|
Discuss
ion
P
a
per
|
4.2 Land use carbon emissions (LCE)
4.2.1 LCE from net LULCC
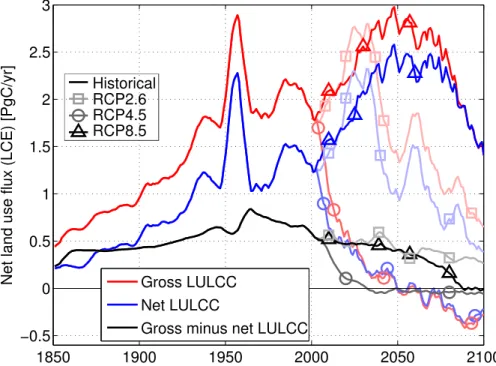
The historical LCE from net LULCC (Fig. 3) increases almost linearly from 0.2 Pg C yr−1 in 1850 to about 1.4 Pg C yr−1in the early 1980s with a peak in the 1950s. After 1990 it drops to about 1.2 Pg C yr−1 at the end of the historical period. Negative LCE is found
5
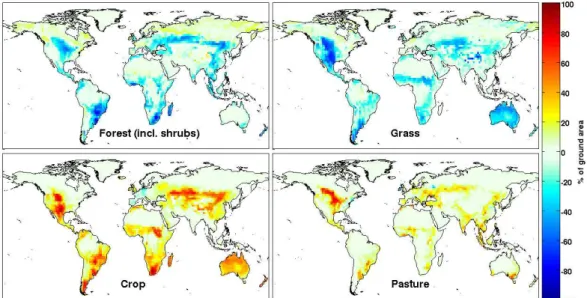
in regions, where large areas of grassland have been converted to pasture (compare Fig. 4, upper left panel with Fig. 2), because conversion from natural to agricultural land decrease the carbon emissions from wildfires (which in JSBACH/CBALANCE is supressed on pastures and croplands). In contrast to forests, grassland has low density of above-ground carbon and a short turnover period of the carbon. Therefore
10
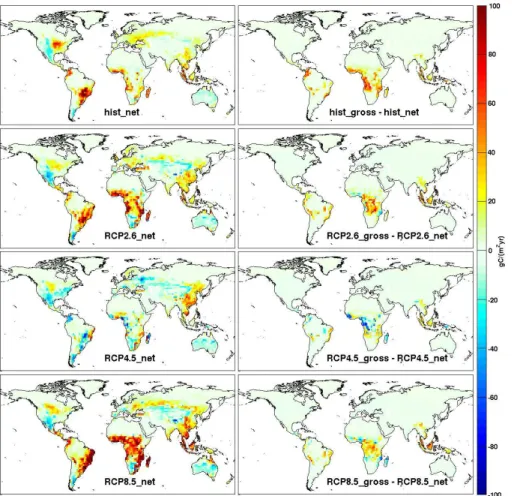
the reduction in wildfire activity can cause reductions in the carbon emission larger than the emissions from LULCC in such regions. This effect is not obvious in regions converted to crop probably since – due to the pasture rule – a higher fraction of this area was originally forest. The regional patterns of LCE (Fig. 4, left panels) do not change much betweenhist and RCP2.6/RCP8.5 with exception of Africa south of
15
Sahara, where the LCE increase substantially. RCP4.5 on the contrary shows large scale negative LCE due to re-establishment of natural areas, the only exceptions being east Asia and eastern Africa, where agricultural expansion continues. Globally,RCP2.6
andRCP8.5 both show increasing LCE in the beginning of the 21st century (Fig. 3),
peaking around 2030 (2070) at about 2.2 (2.5) Pg C yr−1forRCP2.6(RCP8.5) followed
20
by a decrease thereafter, steepest in RCP2.6, so that the LCE in 2100 is about 0.3 (1.5) Pg C yr−1. The global LCE in RCP4.5drops steeply at the beginning of the 21st century and continues to decrease, reaching about−0.2 Pg C yr−1in 2100.
4.2.2 LCE differences between net and gross LULCC
Applying gross LULCC converts larger areas than net LULCC and thus generally
25
BGD
11, 5443–5469, 2014Net vs. gross anthropogenic land
use changes
S. Wilkenskjeld et al.
Title Page
Abstract Introduction
Conclusions References
Tables Figures
◭ ◮
◭ ◮
Back Close
Full Screen / Esc
Printer-friendly Version Interactive Discussion
Discussion
P
a
per
|
D
iscussion
P
a
per
|
Discussion
P
a
per
|
Discuss
ion
P
a
per
|
0.3 Pg C yr−1(more than 100 % of the net LCE) and it increases to about 0.6 Pg C yr−1in 1960, where it jumps to 0.9 Pg C yr−1and decreases during the rest of the experiment period. In 2005 the difference is about 0.5 Pg C yr−1. The total LCE during (Table 2, bottom) the historical period is about 85 Pg C – almost 60 % – larger when applying gross instead of net LULCC. The LCE difference between net and gross LULCC is
5
decreasing during all the RCP’s. RCP4.5has a sudden drop in the beginning of the 21st century, reaching essentially 0 Pg C yr−1 in 2030, thereafter staying constant. In
RCP2.6 and RCP8.5 the decrease is more steady throughout the century, though
the descent becomes steeper inRCP8.5after 2060, reaching 0 Pg C yr−1around year 2090. In RCP2.6 the difference is about 0.3 Pg C yr−1 in 2100. The convergence of
10
gross and net LCE towards the end of the 21st century is most likely to be due to the projections prescribing essentially constant rates of conversion, allowing the local carbon reservoirs to come into equilibrium with the chosen LULCC type. By using gross LULCC, a total of 40 Pg C (34 %), 2.4 Pg C (32 %) and 30 Pg C (15 %) (Table 2, bottom) is added to the LCE duringRCP2.6,RCP4.5andRCP8.5respectively.
15
In many regions the difference between LCE from gross and net LULCC (Fig. 4, right panels) is of the same magnitude as the LCE from the net LULCC (left panels) – in parts of southern Africa even exceeding these. The patterns of additional LCE from the gross LULCC do not change much from the historical period to RCP2.6/RCP8.5
with exception of a shift from the coastal southern Africa to the more central parts.
20
Most of the patterns are also found inRCP4.5with a major difference in south-western Africa, where the gross LULCC leads to an even larger negative LCE than the net LULCC. This is possible in areas where the additional conversion of forest from gross LULCC during the historical period have left the forests with less carbon than the net LULCC (and thus with a larger regrowth potential) is followed by a reduction in the
25
deforestation rate in the RCP projections.
BGD
11, 5443–5469, 2014Net vs. gross anthropogenic land
use changes
S. Wilkenskjeld et al.
Title Page
Abstract Introduction
Conclusions References
Tables Figures
◭ ◮
◭ ◮
Back Close
Full Screen / Esc
Printer-friendly Version Interactive Discussion
Discussion
P
a
per
|
D
iscussion
P
a
per
|
Discussion
P
a
per
|
Discuss
ion
P
a
per
|
to a total of 2.71 Pg C yr−1compared to hist_net. The reduction is 5.5 %, 3.5 % and 5.3 % inRCP2.6,RCP4.5andRCP8.5respectively.
5 Discussion and summary
Using the land carbon model of MPI-ESM, CBALANCE, this study demonstrates that ignoring sub-grid scale LULCC conversions like shifting cultivation (net LULCC), as it
5
is done by many of the models participating in CMIP5, lead to much lower LCE than when such conversions are included (gross LULCC). In the four studied scenarios (historical, RCP2.6, RCP4.5 and RCP8.5), the cumulated LCE estimates are lowered by 85, 40, 2.4 and 30 Pg C (Table 2), corresponding to ignoring emissions of 0.54, 0.32, 0.02 and 0.42 Pg C yr−1 respectively on average. The differences between the
10
LULCC methods are getting smaller towards year 2100, probably due to establishment of equilibria between local carbon reservoirs and essentially constant LULCC-rates.
Representing LULCC via gross transitions extend the LULCC representation by also resolving shifting cultivation and other sub-grid scale LULCC processes in addition to the net transitions. One might thus be tempted to regard the gross transitions as
15
superior to the net transitions while conceptually more realistic. Gross transitions, however, need more input data. Accurate historical information of this kind is scarce and thus Hurtt et al. (2006) made some rather simple assumptions about the location of shifting cultivation (“in the tropics”) and the period for which agricultural land is cultivated before it is again abandoned (15 years, corresponding to an abandonment
20
rate of 6.7 %). In reality the cycle period of shifting cultivation is strongly dependent on location and time (Lanly, 1985; Bruun et al., 2006; Lojka et al., 2011; Ranjan and Upadhyay, 1999; Ramankutty et al., 2007) and thus the gross transitions add extra uncertainty to the modeled estimates of LCE. However, it is known that shifting cultivation plays a role in global agriculture and therefore the estimates of LCE from the
25
BGD
11, 5443–5469, 2014Net vs. gross anthropogenic land
use changes
S. Wilkenskjeld et al.
Title Page
Abstract Introduction
Conclusions References
Tables Figures
◭ ◮
◭ ◮
Back Close
Full Screen / Esc
Printer-friendly Version Interactive Discussion
Discussion
P
a
per
|
D
iscussion
P
a
per
|
Discussion
P
a
per
|
Discuss
ion
P
a
per
|
Among the estimates of LCE reported in the studies by Houghton et al. (2012) and Brovkin et al. (2013), the estimates presented here are towards the high end when the MPI-ESM standard (gross) LULCC is applied. Houghton et al. (2012) reported a multi-method average estimate of LCE of 1.14 Pg C yr−1for the 1990s, including the JSBACH results of Pongratz et al. (2009), who applied the net LULCC data of Pongratz
5
et al. (2008). Applying net LULCC in CBALANCE reduces the LCE from 2.05 Pg C yr−1 to 1.40 Pg C yr−1during the 1990s, thus removing most of the difference to Houghton et al. (2012)’s “method-mean”.
However, the results presented here question the value of such “method-means”, where some ensemble members are applying net transitions, others gross. Only ESMs
10
implementing gross methods can be expected to reproduce the results of bookkeeping models like the one presented in Houghton et al. (1983). Ensemble means and spreads of “method-ensembles” such as the CMIP5-project or the ensemble presented in Houghton et al. (2012) may be misleading, since they contain members which are not truely comparable. Building sub-ensembles containing only comparable members
15
may ease the interpretation and narrowing the range of LCE estimates.
The converted areas are very dependent on the exact model implementation. Thus our converted areas are much less (our gross (net) converted areas are≈50 % (70 %) of theirs) than those presented in Hurtt et al. (2011), who included secondary natural vegetation. Compared to Shevliakova et al. (2013) (their Fig. 1b) our gross conversions
20
are higher than their “gross from fractions”, while our net conversions are slightly lower than theirs. They include secondary vegetation with age classes and area of harvested wood. Lawrence et al. (2012) get – using a net method – total converted areas somewhat higher than ours – most likely to be due to different treatment of desert areas.
25
BGD
11, 5443–5469, 2014Net vs. gross anthropogenic land
use changes
S. Wilkenskjeld et al.
Title Page
Abstract Introduction
Conclusions References
Tables Figures
◭ ◮
◭ ◮
Back Close
Full Screen / Esc
Printer-friendly Version Interactive Discussion
Discussion
P
a
per
|
D
iscussion
P
a
per
|
Discussion
P
a
per
|
Discuss
ion
P
a
per
|
an additional cancellation from opposing land conversions in adjacent grid cells. For a typical state-of-the-art ESM with a resolution of 2◦ the resolution reduction of converted area has been estimated (see Appendix A) to 1–5 % for the different scenarios. Since the reduction of converted area mainly occurs in areas of intensive LULCC and thus below average carbon stocks, the effect of resolution on the LCE is
5
expected to be less than the effect on the converted area. The differences between converted area of net and gross LULCC disappear entirely only when the model resolution resolves the individual plots of shifting cultivation. Since the area of a plot typically is O(1 ha) (Bruun et al., 2006; Lojka et al., 2011), this would require a reduction of grid cell area by a factor of O(106) compared to current generation of ESMs and an
10
almost similar increase in the need for accurate input data. It is not realistic that any of these requirements are fulfilled in the forseeable future.
The CMIP5-models also treat wood harvest very differently, either ignoring it completely, including it as a removal of carbon or as transitions from primary and/or secondary to secondary land (Appendix A in Brovkin et al., 2013; Shevliakova
15
et al., 2013). In a steady state, the carbon emissions from wood harvest would be compensated by regrowth of forests (see the discussion in Ramankutty et al., 2007) and would thus not add to the anthropogenic carbon emissions. However, according to the Harmonized Protocol wood harvest is (almost) monotonically increasing from 0.2 Pg C yr−1 in 1850 to 1.8–3.5 Pg C yr−1 in 2100 (dependent on the RCP-scenario).
20
Though no steady state is obtained, regrowth still compensates the majority of the wood harvest. A rough estimate of the net carbon emissions from wood harvest can be obtained by assuming that the regrowth is in equilibrium with the wood harvest some years earlier. Testing delays from 1 to 20 years reveals an almost perfect increasing linear relationship with the delay and suggests that the actual delay must be larger
25
than 3 years (RCP8.5) or 12–13 years (all other scenarios) for the net wood harvest emissions to exceed 0.1 Pg yr−1.
BGD
11, 5443–5469, 2014Net vs. gross anthropogenic land
use changes
S. Wilkenskjeld et al.
Title Page
Abstract Introduction
Conclusions References
Tables Figures
◭ ◮
◭ ◮
Back Close
Full Screen / Esc
Printer-friendly Version Interactive Discussion
Discussion
P
a
per
|
D
iscussion
P
a
per
|
Discussion
P
a
per
|
Discuss
ion
P
a
per
|
Since the experiments with gross and net LULCC are (net: almost) identical to the coupled CMIP5 runs with MPI-ESM, and since plant growth in JSBACH/CBALANCE is dependent only on climate and PFT-properties – not on the actual state of the plants –, these experiments are still consistent with respect to the physical feedbacks (e.g. roughness length, albedo). However, disregarding the atmospheric feedbacks may
5
have an effect on the reference runs which have a significantly different vegetation distribution due to the lack of LULCC. Because the calculation of net and gross LCE uses the same reference run, this is, however, unlikely to change the main conclusions of this study. The MPI-ESM-experiments delivering the forcing data for our experiments are performed with prescribed transient atmospheric CO2-concentration and thus the
10
most important biogeochemical feedback is treated consistently with the coupled runs despite the use of an off-line carbon model.
This study demonstrates that implementation details of LULCC may significantly alter the estimates of LCE and thus the estimates of the effects of LULCC on climate and climate changes. Most studies up to now deal with implementations of net LULCC and
15
are likely to underestimate the LCE.
Appendix A
Estimating resolution dependency of net LULCC
Based on the original 0.5◦ resolution data of Hurtt et al. (2011) the resolution effect on the net converted area has been estimated by joining a number of grid cells
20
together to produce a data set with a specified resolution, thereafter the conversions are reduced to net conversions as described in Sect. 2.2. The data have not been masked by any land-sea masks. The conversions taken into account are those regarded by JSBACH/CBALANCE: conversions from primary to secondary land are ignored and in all other conversions primary and secondary land is treated as being
25
BGD
11, 5443–5469, 2014Net vs. gross anthropogenic land
use changes
S. Wilkenskjeld et al.
Title Page
Abstract Introduction
Conclusions References
Tables Figures
◭ ◮
◭ ◮
Back Close
Full Screen / Esc
Printer-friendly Version Interactive Discussion
Discussion
P
a
per
|
D
iscussion
P
a
per
|
Discussion
P
a
per
|
Discuss
ion
P
a
per
|
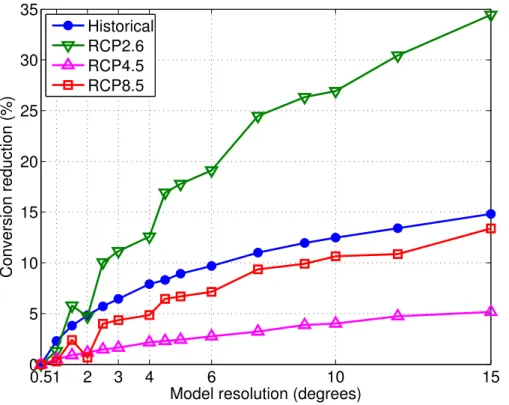
to the original data after joining a number of adjacent cells (e.g. 2◦ resolution joins 4×4 cells) to reduce resolution. Not surprising, the reduction of converted area in general increases with decreasing resolution. However, the slope of reduction is largest for very high resolutions and the different scenarios show very different resolution dependencies. The latter is related to the heterogeneity of the provided
5
LULCC data which again is related to the resolution of the source data/Integrated Assessment Model (IAM) from which the LULCC data stem (historical: Hurtt et al. (2011), RCP2.6: van Vuuren et al. (2011b), RCP4.5: Thomson et al. (2011), RCP8.5: Riahi et al. (2011)) – the coarser the source data/model, the smoother the data and the smaller the reduction. For state-of-the-art ESMs with resolutions of 1–3◦ the
10
reduction of converted area with resolution is however a second order effect compared to ignoring the sub-grid scale conversions, which already at 0.5◦ resolution amounts to≈2/3 for the historical period and≈90 % in any of the RCPs of the total conversions.
The service charges for this open access publication
15
have been covered by the Max Planck Society.
References
Brovkin, V., Raddatz, T., Reick, C. H., Claussen, M., and Gayler, V.: Global biogeophysical in-teractions between forest and climate, Geophys. Res. Lett., 36, doi:10.1029/2009GL037543, 2009. 5446, 5449
20
Brovkin, V., Boysen, L., Arora, V. K., Boisier, J. P., Cadule, P., Chini, L., Claussen, M., Friedlingstein, P., Gayler, V., van den Hurk, B. J. J. M., Hurtt, G. C., Jones, C. D., Kato, E.,
de Noblet-Ducoudre, N., Pacifico, F., Pongratz, J., and Weiss, M.: Effect of anthropogenic
land use and land-cover changes on climate and land carbon storage in CMIP5 projections for the twenty-first century, J. Climate, 26, 6859–6881, doi:10.1175/JCLI-D-12-00623.1,
25
BGD
11, 5443–5469, 2014Net vs. gross anthropogenic land
use changes
S. Wilkenskjeld et al.
Title Page
Abstract Introduction
Conclusions References
Tables Figures
◭ ◮
◭ ◮
Back Close
Full Screen / Esc
Printer-friendly Version Interactive Discussion
Discussion
P
a
per
|
D
iscussion
P
a
per
|
Discussion
P
a
per
|
Discuss
ion
P
a
per
|
Bruun, T., Mertz, O., and Elberling, B.: Linking yields of upland rice in shifting cultivation to fallow length and soil properties, Agr. Ecosyst. Eviron., 113, 139–149, doi:10.1016/j.agee.2005.09.012, 2006. 5446, 5454, 5456
Denman, K. L., Brasseur, G., Chidthaisong, A., Ciais, P., Cox, P. M., Dickinson, R. E., Hauglustaine, D., Heinze, C., Holland, E., Jacob, D., Lohmann, U., Ramachandran, S., da
5
Silva Dias, P. L., Wofsy, S. C., and Zhang, X.: Couplings between changes in the climate system and biogeochemistry, in: The Physical Science Basis: Contribution of Working Group I to the Fourth Assessment Report of the Intergovernmental Panel on Climate Change, edited by: Solomon, S., Qin, D., Manning, M., Chen, Z., Marquis, M., Averyt, K. B., and Tignor, M., Cambridge University Press, Cambridge, 499–587, 2007. 5445
10
Giorgetta, M. A., Jungclaus, J., Reick, C. H., Legutke, S., Bader, J., Böttinger, M., Brovkin, V., Crueger, T., Esch, M., Fieg, K., Glushak, K., Gayler, V., Haak, H., Hollweg, H.-D., Ilyina, T., Kinne, S., Kornblueh, L., Matei, D., Mauritsen, T., Mikolajewicz, U., Mueller, W., Notz, D., Pithan, F., Raddatz, T., Rast, S., Redler, R., Roeckner, E., Schmidt, H., Schnur, R., Segschneider, J., Six, K. D., Stockhause, M., Timmreck, C., Wegner, J., Widmann, H.,
15
Wieners, K.-H., Claussen, M., Jochem, M., and Stevens, B.: Climate and carbon cycle changes from 1850 to 2100 in MPI-ESM simulations for the coupled model intercomparison project phase 5, J. Adv. Model. Earth Syst., 5, 572–597, doi:10.1002/jame.20038, 2013. 5446, 5447, 5449
Houghton, R. A., Hobbie, J. E., Melillo, J. M., Moore, B., Peterson, B. J., Shaver, G. R., and
20
Woodwell, G. M.: Changes in the carbon content of terrestrial biota and soils between 1860
and 1980: a net release of CO2to the atmosphere, Ecol. Monogr., 53, doi:10.2307/1942531,
1983. 5445, 5446, 5455
Houghton, R. A., House, J. I., Pongratz, J., van der Werf, G. R., DeFries, R. S., Hansen, M. C., Le Quéré, C., and Ramankutty, N.: Carbon emissions from land use and land-cover change,
25
Biogeosciences, 9, 5125–5142, doi:10.5194/bg-9-5125-2012, 2012. 5445, 5455
Hurtt, G. C., Frolking, S., Fearon, M. G., Moore, B., Shevliakova, E., Malyshev, S., Pacala, S. W., and Houghton, R. A.: The underpinnings of land-use history: three centuries of global gridded land-use transitions, wood-harvest activity, and resulting secondary lands, Glob. Change Biol., 12, 1208–1229, doi:10.1111/j.1365-2486.2006.01150.x, 2006. 5446, 5454
30
BGD
11, 5443–5469, 2014Net vs. gross anthropogenic land
use changes
S. Wilkenskjeld et al.
Title Page
Abstract Introduction
Conclusions References
Tables Figures
◭ ◮
◭ ◮
Back Close
Full Screen / Esc
Printer-friendly Version Interactive Discussion
Discussion
P
a
per
|
D
iscussion
P
a
per
|
Discussion
P
a
per
|
Discuss
ion
P
a
per
|
Thomson, A., Thornton, P., van Vuuren, D. P., and Wang, Y. P.: Harmonization of land-use scenarios for the period 1500–2100: 600 years of global gridded annual land-use transitions, wood harvest, and resulting secondary lands, Climatic Change, 109, 117–161, doi:10.1007/s10584-011-0153-2, 2011. 5446, 5449, 5455, 5457, 5458
Jain, A. K., Meiyappan, P., Song, Y., and House, J. I.: CO2 emissions from land-use change
5
affected more by nitrogen cycle, than by the choice of land-cover data, Glob. Change Biol.,
19, 2893–2906, doi:10.1111/gcb.12207, 2013. 5445
Lanly, J. P.: Defining and measuring shifting cultivation, Unasylva, 37, 17–21, 1985. 5446, 5454 Lawrence, P. J., Feddema, J. J., Bonan, G. B., Meehl, G. A., O’Neill, B. C., Oleson, K. W., Levis, S., Lawrence, D. M., Kluzek, E., Lindsay, K., and Thornton, P. E.: Simulating the
10
biogeochemical and biogeophysical impacts of transient land cover change and wood harvest in the Community Climate System Model (CCSM4) from 1850 to 2100, J. Climate, 25, 3071–3095, doi:10.1175/JCLI-D-11-00256.1, 2012. 5455
Lojka, B., Banout, J., Banoutova, L., Verner, V., and Van Damme, P.: Diversity of shifting cultivation cycles among small-scale farmers in Peruvian Amazon, Agr. Sci., 2, 68–77,
15
doi:10.4236/as.2011.22011, 2011. 5446, 5454, 5456
Pongratz, J., Reick, C., Raddatz, T., and Claussen, M.: A reconstruction of global agricultural areas and land cover for the last millennium, Global Biogeochem. Cy., 22, doi:10.1029/2007GB003153, 2008. 5444, 5455
Pongratz, J., Reick, C. H., Raddatz, T., and Claussen, M.: Effects of anthropogenic land cover
20
change on the carbon cycle of the last millennium, Global Biogeochem. Cy., 23, GB4001, doi:10.1029/2009GB003488, 2009. 5445, 5455
Pongratz, J., Reick, C. H., Houghton, R. A., and House, J. I.: Terminology as a key uncertainty in net land use and land cover change carbon flux estimates, Earth Syst. Dynam., 5, 177–195, doi:10.5194/esd-5-177-2014, 2014. 5445, 5449
25
Raddatz, T. J., Reick, C. H., Knorr, W., Kattge, J., Roeckner, E., Schnur, R., Schnitzler, K.-G., Wetzel, P., and Jungclaus, J.: Will the tropical land biosphere dominate the climate-carbon cycle feedback during the twenty-first century?, Clim. Dynam., 29, 565–574, doi:10.1007/s00382-007-0247-8, 2007. 5446
Ramankutty, N., Gibbs, H. K., Achard, F., Defriess, R., Foley, J. A., and Houghton, R. A.:
30
BGD
11, 5443–5469, 2014Net vs. gross anthropogenic land
use changes
S. Wilkenskjeld et al.
Title Page
Abstract Introduction
Conclusions References
Tables Figures
◭ ◮
◭ ◮
Back Close
Full Screen / Esc
Printer-friendly Version Interactive Discussion
Discussion
P
a
per
|
D
iscussion
P
a
per
|
Discussion
P
a
per
|
Discuss
ion
P
a
per
|
Ranjan, R. and Upadhyay, V.: Ecological problems due to shifting cultivation, Curr. Sci. India, 77, 1246–1250, 1999. 5446, 5454
Reick, C. H., Raddatz, T., Pongratz, J., and Claussen, M.: Contribution of anthropogenic
land cover change emissions to pre-industrial atmospheric CO2, Tellus B, 62, 329–336,
doi:10.1111/j.1600-0889.2010.00479.x, 2010. 5445
5
Reick, C. H., Raddatz, T., Brovkin, V., and Gayler, V.: Representation of natural and anthropogenic land cover change in MPI-ESM, J. Adv. Model. Earth Syst., 5, 459–482, doi:10.1002/jame.20022, 2013. 5446, 5447, 5448, 5449, 5451
Riahi, K., Rao, S., Krey, V., Cho, C., Chirkov, V., Fischer, G., Kindermann, G., Nakicenovic, N., and Rafaj, P.: RCP 8.5-A scenario of comparatively high greenhouse gas emissions, Climatic
10
Change, 109, 33–57, doi:10.1007/s10584-011-0149-y, 2011. 5450, 5458
Schneck, R., Reick, C. H., and Raddatz, T.: Land contribution to natural CO2variability on time
scales of centuries, J. Adv. Model. Earth Syst., 5, 354–365, doi:10.1002/jame.20029, 2013. 5447
Shevliakova, E., Pacala, S. W., Malyshev, S., Hurtt, G. C., Milly, P. C. D., Caspersen, J. P.,
15
Sentman, L. T., Fisk, J. P., Wirth, C., and Crevoisier, C.: Carbon cycling under 300 years of land use change: importance of the secondary vegetation sink, Global Biogeochem. Cy., 23, GB2022, doi:10.1029/2007GB003176, 2009. 5445
Shevliakova, E., Stouffer, R. J., Malyshev, S., Krasting, J. P., Hurtt, G. C., and Pacala, S. W.:
Historical warming reduced due to enhanced land carbon uptake, P. Natl. Acad. Sci. USA,
20
110, 16730–16735, doi:10.1073/pnas.1314047110, 2013. 5455, 5456
Taylor, K. E., Stouffer, R. J., and Meehl, G. A.: An overview of CMIP5 and the experiment
design, B. Am. Meteorol. Soc., 93, 485–498, doi:10.1175/BAMS-D-11-00094.1, 2012. 5445, 5449
Thomson, A. M., Calvin, K. V., Smith, S. J., Kyle, G. P., Volke, A., Patel, P., Delgado-Arias, S.,
25
Bond-Lamberty, B., Wise, M. A., Clarke, L. E., and Edmonds, J. A.: RCP4.5: a pathway for stabilization of radiative forcing by 2100, Climatic Change, 109, 77–94, doi:10.1007/s10584-011-0151-4, 2011. 5450, 5458
van Vuuren, D. P., Edmonds, J., Kainuma, M., Riahi, K., Thomson, A., Hibbard, K., Hurtt, G. C., Kram, T., Krey, V., Lamarque, J.-F., Masui, T., Meinshausen, M., Nakicenovic, N., Smith, S. J.,
30
BGD
11, 5443–5469, 2014Net vs. gross anthropogenic land
use changes
S. Wilkenskjeld et al.
Title Page
Abstract Introduction
Conclusions References
Tables Figures
◭ ◮
◭ ◮
Back Close
Full Screen / Esc
Printer-friendly Version Interactive Discussion
Discussion
P
a
per
|
D
iscussion
P
a
per
|
Discussion
P
a
per
|
Discuss
ion
P
a
per
|
van Vuuren, D. P., Stehfest, E., den Elzen, M. G. J., Kram, T., van Vliet, J., Deetman, S., Isaac, M., Goldewijk, K. K., Hof, A., Beltran, A. M., Oostenrijk, R., and van Ruijven, B.: RCP2.6: exploring the possibility to keep global mean temperature increase below 2 degrees C, Climatic Change, 109, 95–116, doi:10.1007/s10584-011-0152-3, 2011b. 5450, 5458 Williams, M.: Deforesting the Earth: from Prehistroy to Global Crisis, University of Chicago
5
BGD
11, 5443–5469, 2014Net vs. gross anthropogenic land
use changes
S. Wilkenskjeld et al.
Title Page
Abstract Introduction
Conclusions References
Tables Figures
◭ ◮
◭ ◮
Back Close
Full Screen / Esc
Printer-friendly Version Interactive Discussion
Discussion
P
a
per
|
D
iscussion
P
a
per
|
Discussion
P
a
per
|
Discuss
ion
P
a
per
|
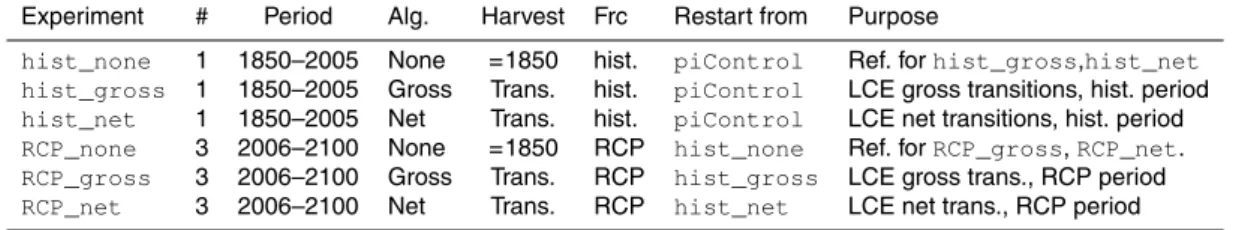
Table 1.Performed experiments. RCP-forced experiments include runs forRCP2.6, RCP4.5
andRCP8.5. Experiments with no LULCC have their distribution of agricultural land fixed at
the time where also the harvest from the natural vegetation is fixed. Thehist_experiments
are restarted from the coupledpiControlexperiment so thathist_grossreproduces the
“r1” ensemble member. “#”=Number of scenarios for this setup, “Alg”=LULCC algorithm,
“Trans.”=Transient, “Frc.”=forcing, “hist.”=historical.
Experiment # Period Alg. Harvest Frc Restart from Purpose
BGD
11, 5443–5469, 2014Net vs. gross anthropogenic land
use changes
S. Wilkenskjeld et al.
Title Page
Abstract Introduction
Conclusions References
Tables Figures
◭ ◮
◭ ◮
Back Close
Full Screen / Esc
Printer-friendly Version Interactive Discussion
Discussion
P
a
per
|
D
iscussion
P
a
per
|
Discussion
P
a
per
|
Discuss
ion
P
a
per
|
Table 2.Annual average LCE [Pg C yr−1] and LCE accumulated over entire experiment [Pg C].
Scenario “historical” calculated from experimentshist_gross(hist_net) andhist_ref,
experiments “RCP” fromRCP_gross(RCP_net) andRCP_ref.
Scenario historical RCP2.6 RCP4.5 RCP8.5
1990s 2005 1850–2005
Gross (annual) 2.05 2.09 1.44 1.69 0.12 2.38
Net (annual) 1.40 1.59 0.90 1.26 0.10 2.06
Gross (cumulated) 225 160 11.9 226
BGD
11, 5443–5469, 2014Net vs. gross anthropogenic land
use changes
S. Wilkenskjeld et al.
Title Page
Abstract Introduction
Conclusions References
Tables Figures
◭ ◮
◭ ◮
Back Close
Full Screen / Esc
Printer-friendly Version Interactive Discussion
Discussion
P
a
per
|
D
iscussion
P
a
per
|
Discussion
P
a
per
|
Discuss
ion
P
a
per
|
❉✐s❝✉ss✐♦♥
P
❛♣
❡r
⑤
❉✐s❝✉ss✐♦♥
P
❛♣
❡r
⑤
❉✐s❝✉ss✐♦♥
P
❛♣
❡r
⑤
❉✐
s❝✉ss
✐♦♥
P
❛♣
❡r
⑤
18500 1900 1950 2000 2050 2100
10 20 30 40 50
Global area [10
6 km 2 ]
With LULCC No LULCC
Historical RCP8.5 RCP4.5 RCP2.6
Desert Crop Pasture Grass Shrub Forest
Fig. 1. Evolution of the global area of different vegetation and surface types resulting from
gross and no LULCC combined with dynamic vegetation. Different experiments have different
line styles, different surface types have different color and different scenarios have different
brightness (same brightness for historical and RCP8.5, since they do not have any temporal overlap). Desert: area without vegetation under current climate. Glacier and bare rock area
which can never have vegetation is constant about 16×106km2 throughout the experiments.
Minor differences between net and gross LULCC are discussed in the text.
BGD
11, 5443–5469, 2014Net vs. gross anthropogenic land
use changes
S. Wilkenskjeld et al.
Title Page
Abstract Introduction
Conclusions References
Tables Figures
◭ ◮
◭ ◮
Back Close
Full Screen / Esc
Printer-friendly Version Interactive Discussion
Discussion
P
a
per
|
D
iscussion
P
a
per
|
Discussion
P
a
per
|
Discuss
ion
P
a
per
|
❉✐s❝✉ss✐♦♥
P
❛♣
❡r
⑤
❉✐s❝✉ss✐♦♥
P
❛♣
❡r
⑤
❉✐s❝✉ss✐♦♥
P
❛♣
❡r
⑤
❉✐
s❝✉ss
✐♦♥
P
❛♣
❡r
⑤
Fig. 2.Modelled change in area of different vegetation types during the historical period (1850– 2005).
BGD
11, 5443–5469, 2014Net vs. gross anthropogenic land
use changes
S. Wilkenskjeld et al.
Title Page
Abstract Introduction
Conclusions References
Tables Figures
◭ ◮
◭ ◮
Back Close
Full Screen / Esc
Printer-friendly Version Interactive Discussion
Discussion
P
a
per
|
D
iscussion
P
a
per
|
Discussion
P
a
per
|
Discuss
ion
P
a
per
|
❉✐s❝✉ss✐♦♥
P
❛♣
❡r
⑤
❉✐s❝✉ss✐♦♥
P
❛♣
❡r
⑤
❉✐s❝✉ss✐♦♥
P
❛♣
❡r
⑤
❉✐
s❝✉ss
✐♦♥
P
❛♣
❡r
⑤
1850 1900 1950 2000 2050 2100
−0.5 0 0.5 1 1.5 2 2.5 3
Net land use flux (LCE) [PgC/yr] Gross LULCC
Net LULCC
Gross minus net LULCC RCP2.6
RCP8.5 RCP4.5 Historical
Fig. 3.Seven year running mean of land use carbon emissions from gross and net transitions
as well as the difference between them.
BGD
11, 5443–5469, 2014Net vs. gross anthropogenic land
use changes
S. Wilkenskjeld et al.
Title Page
Abstract Introduction
Conclusions References
Tables Figures
◭ ◮
◭ ◮
Back Close
Full Screen / Esc
Printer-friendly Version Interactive Discussion
Discussion
P
a
per
|
D
iscussion
P
a
per
|
Discussion
P
a
per
|
Discuss
ion
P
a
per
|
❉✐s❝✉ss✐♦♥
P
❛♣
❡r
⑤
❉✐s❝✉ss✐♦♥
P
❛♣
❡r
⑤
❉✐s❝✉ss✐♦♥
P
❛♣
❡r
⑤
❉✐
s❝✉ss
✐♦♥
P
❛♣
❡r
⑤
Fig. 4. Geographical distribution of annual average land use carbon emission using net
BGD
11, 5443–5469, 2014Net vs. gross anthropogenic land
use changes
S. Wilkenskjeld et al.
Title Page
Abstract Introduction
Conclusions References
Tables Figures
◭ ◮
◭ ◮
Back Close
Full Screen / Esc
Printer-friendly Version Interactive Discussion
Discussion
P
a
per
|
D
iscussion
P
a
per
|
Discussion
P
a
per
|
Discuss
ion
P
a
per
|
❉✐s❝✉ss✐♦♥
P
❛♣
❡r
⑤
❉✐s❝✉ss✐♦♥
P
❛♣
❡r
⑤
❉✐s❝✉ss✐♦♥
P
❛♣
❡r
⑤
❉✐
s❝✉ss
✐♦♥
P
❛♣
❡r
⑤
0.51 2 3 4 6 10 15
0 5 10 15 20 25 30 35
Model resolution (degrees)
Conversion reduction (%)
Historical RCP2.6 RCP4.5 RCP8.5
Fig. A1.Relative reduction of area converted by net LULCC as function of resolution, using
0.5◦as reference. Only resolutions with an integer number of cells around the globe have been
calculated.
![Table 2. Annual average LCE [Pg C yr −1 ] and LCE accumulated over entire experiment [Pg C].](https://thumb-eu.123doks.com/thumbv2/123dok_br/18405924.359217/22.918.66.643.295.440/table-annual-average-lce-lce-accumulated-entire-experiment.webp)