A Wireless Sensor and Actuator Network for
Improving the Electrical Power Grid Dependability
António Grilo, Augusto Casaca,
Paulo Pereira INESC-ID/IST, Portugal
{antonio.grilo, augusto.casaca, paulo.pereira}@inesc-id.pt
Levente Buttyan BME-HIT, Hungary [email protected]
José Gonçalves INOV, Portugal [email protected]
Carlos Fortunato EDP Distribuição, Portugal
Abstract— This paper presents an overview of a Wireless Sensor and Actuator Network (WSAN) used to monitor an electrical power grid distribution infrastructure. The WSAN employs appropriate sensors to monitor key grid components, integrating both safety and security services, which improve the grid distribution dependability. The supported applications include, among others, video surveillance of remote secondary substations, which imposes special requirements from the point of view of quality of service and reliability. The paper presents the hardware and software architecture of the system together with performance results.
Keywords-Wireless Sensor and Actuator Network, Power Grid Distribution Infrastructure, IEEE 802.11, DTSN, RPL.
I. INTRODUCTION
The electrical power grid is a complex and critical infrastructure, which welcomes the deployment of extra technology to improve its dependability. Wireless Sensor and Actuator Networks (WSAN) can be an important part of the additional technological solutions used for that purpose. If deployed in key points of the grid they can provide important information to a central control system, whose operator can trigger the most appropriate actions to solve an existing problem or to avoid problems in the near future. An extra set of actuators included in the WSAN can further improve the capabilities of the network to deal with the problems.
This paper presents research results from the introduction of WSAN in the distribution part of the power grid. The research was conducted within the WSAN4CIP (Wireless Sensor and Actuator Networks for Critical Infrastructure Protection) project, which is partially funded by the European Commission 7th Framework Program of Research.
After the introduction, the second section of the paper illustrates the selected WSAN applications. The third section describes the sensor boards and the networking architecture of the solution, whereas section four introduces the work done on the routing and transport protocols as well as in the security aspects of the solution. Section five refers to the central part of the system, which interfaces the WSAN to the SCADA of the energy operator. The next two sections present the trial configuration and the performance results
obtained with this solution. Finally the paper concludes with an evaluation of the technology and drawing of conclusions.
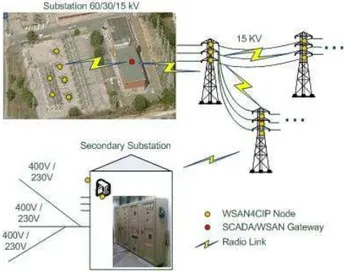
II. WSANAPPLICATIONS FOR THE POWER GRID The electrical power grid distribution infrastructure is schematically shown in Figure 1.
Figure 1. Power grid distribution infrastructure
In the WSAN4CIP project we focused into improving the dependability of the substation components, MV and LV power lines, and MV/LV power transformers in the secondary substations. We have defined solutions for the remote active monitoring of: i) substation circuit breaker trip coil status; ii) temperature of the substation power transformer oil, substation neutral reactance oil and substation neutral resistor coil box; iii) MV and LV power line current activity; iv) MV/LV power transformer hotspot detection; v) human activity in the secondary substation through the use of movement detectors and video cameras. All the monitored parameters and images are visualized at the SCADA system, through a special-purpose graphical user interface.
In the circuit breaker trip coil scenario we consider a sensor and actuator for periodically evaluating the operating status of the circuit breaker trip coil element. The trip coil activates the circuit breaker when a 110V DC voltage is applied at its terminals, cutting the energy supply to the power line. It happens that after activating the circuit breaker there is a chance that the coil may be damaged and the circuit breaker will not function properly in the next event. This solution aims to check the working status of the trip coil in a pro-active way. A 5V DC voltage will be applied every 60 minute by an actuator. The magnetic field generated by the coil will be measured by a Hall-effect transistor. In the event of failure, meaning that no magnetic field is detected when a 5V DC voltage is applied, the sensor will report the failure back to the network. This solution also allows for on demand testing.
The temperature sensor probes to measure the temperature in the substation transformers, neutral reactances and neutral resistor coil boxes are placed on the external side of the metallic oil tank, firmly and thermally attached to the tank external wall. The sensor probes are insulated from the external environment with thermal foam. On normal status a measure will be taken every minute. The temperature sensor also allows for on demand temperature reading.
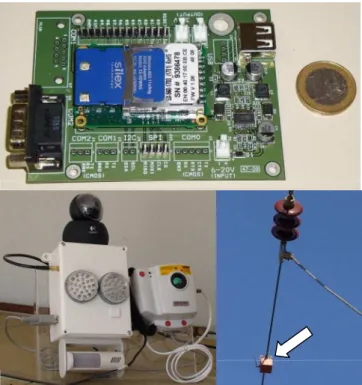
The MV power line scenario aims to monitor the status of an MV power line section. It is therefore possible to know centrally the location of a power line failure. The power line chosen is a medium voltage 15kV line that feeds a set of MV/LV power transformers in secondary substations. The line topology is a tree shape with several leaves, the leaves being the secondary substations (see Figure 1). The physical measurement to be done is the electrical current flowing through the line; a current transformer is used to measure its value and to derive a parasitic power source for the wireless sensor, reducing the power constrains on the wireless protocols through this energy harvesting technique (Figure 2, bottom-right). The current sensor samples the current on the line every second.
We use the multi-hop wireless communications link built in the previous scenario to upload a video image feed of the secondary substation to the network when movement is detected. At the same time an infrared thermo sensor
attached to the camera will sweep the power transformer critical elements, like the main switch board, for hotspots (Figure 2, bottom left). The detection of a hotspot will trigger an alarm into the network. This scenario also includes an actuator, which turns on the lights in the secondary substation. Thus, albeit the camera shall be night and day capable, the user can get a better and color video stream even at night.
The requirement for video transmission and the long distances between MV power line towers place additional requirements in terms of the communications and processing capabilities of the WSAN nodes. We have defined two sensor mote architectures with different processing power, which can be used in all these applications and that can run a standard operating system like Linux. Communication interfaces capable of connecting to powerful communication networks like Wi-Fi are also part of the mote architecture.
The energy supply to the WSAN nodes is obtained from power supplies in the substation and secondary substation installation and also from the power lines, although in the latter case the voltages are too high to be used directly by the WSAN nodes, which requires the use of intelligent energy harvesting techniques.
III. WIRELESS SENSOR BOARDS AND SOFTWARE OF THE SOLUTION
This section presents an overview of the wireless sensor boards and the software of the solution.
A. Wireless Sensor Boards
Regarding wireless sensor board hardware, the project WSAN4CIP has integrated two solutions: one based on a Silex SX-560 core1 and a second solution based on a Beagle Board2. While video compression at the secondary substation requires a more powerful processing node such as the Beagle, scalar sensor nodes can be based on a less powerful board such as the Silex SX-560. The Beagle board is also able to support a secure operating system. The inclusion of two different solutions allows also the demonstration of a heterogeneous scenario.
For the Silex SX-560 solution the PCB designed at INOV (Figure 2, top) includes a common voltage converter able to generate 3.3 V DC to feed the Silex and 5 V DC to feed the USB interface (considered a part of the Sensor Interface Unit) based on an input of 6-20 V DC. The differences between the WSAN nodes concern the Energy Unit and Sensor Interface Unit, which depend on the deployment spot and attached sensor, respectively. The Energy Units are able to convert from the external power source (either MV power-line energy harvesting or 230 V AC mains) to the 6-20 V DC input. Similarly, a 230 V AC to 5 V DC adapter was used for the Beagle nodes.
1 http://www.silexeurope.com/en/home/products/wireless-modules/
sx-560.html
The used WSAN radio technology was IEEE 802.11g. The choice was based on the longer communications range and higher data rates required for multi-hop video transmission from the secondary substation. Although the consumption of IEEE 802.11g is higher than for low power radio technologies such as IEEE 802.15.4, the specific characteristics of the target application allow the WSAN nodes at the primary and secondary substations to be fed from the 230 V AC mains (see above), while the MV power-line sensors may resort to energy harvesting from the MV line current.
Figure 2. Top: Silex sensor with PCB; Bottom-left: Sensor with webcam, infrared camera, LED light and movement sensor; Bottom-right: Sensor
hanging on a 15 KV line, harvesting energy from the line.
B. Software
The software modules of the WSAN node are depicted in Figure 3. The selected Operating System is Linux, which is supported by the Silex SX-560 module. In the Beagle solution, Linux runs on top of a secure microkernel [1] that controls the access to all critical resources of the WSAN node.
The main software modules of the WSAN node are the following:
• WSAN Sensor/Actuator Application Logic:
Application logic of the WSAN node, managing sensors, actuators and communications.
• Dependable Protocol Stack: The Routing and
Transport protocols. The transport layer consists of a secured version of the Distributed Transport for Sensor Networks (DTSN), while routing consists of a secure version of the
Routing Protocol for Low power and Lossy Networks (RPL).
• Sensor/Actuator Device Driver: Software
that provides access to each type of sensor/actuator.
• Management Information Base (MIB):
Configuration parameters of the WSAN nodes.
• Secure Microkernel: trusted software
underlying the operating system, which controls access to all resources of the WSAN node.
Figure 3. Software architecture of WSAN node.
IV. ROUTING PROTOCOL,TRANSPORT PROTOCOL AND PROTOCOL SECURITY
The routing and transport protocols, which constitute the Dependable Protocol Stack, are especially important to increase the dependability of the solution. Although the RPL and DTSN protocols already existed, new security extensions were added for use in the WSAN4CIP Power Grid, which significantly contributed to enhance the reliability of the protocol stack.
A. Secure RPL
Objective functions are not defined in the main RPL specification, but in separate documents (see e.g., [3]), and they can take into account hop count, node rank, link quality, and battery status information. Once the routing topology is established, upward (from the sensors to the sink) and downward (from the sink to the sensors) routes are selected along the edges of the DODAG.
A DODAG is advertised in DODAG Information Object (DIO) messages. Among other things, DIO messages contain a DODAG version number and a node rank value. The version number is used to determine the freshness of the routing information, while the node rank value represents the distance of the sending node from the DODAG root. Normally, the version number is increased by the DODAG root when it wants to initiate the re-generation of the routing topology, and it remains unchanged in the DIO messages sent by the DODAG nodes. In contrast to this, the rank value is updated by each DODAG node to correctly represent the node’s distance from the root.
There exists an RPL security framework [4], however, the security services of that framework are supposed to provide protection only against an external attacker. In particular, the current RPL security framework does not prevent the DODAG nodes from manipulating the version number and the rank value in DIO messages. Unfortunately, if a misbehaving DODAG node increases the version number, then the routing topology is re-calculated and the misbehaving node becomes the DODAG root. This allows the misbehaving node to divert the entire data traffic in the network towards itself and control all communications in the network. Another problem is that a misbehaving node can maliciously decrease the rank value in DIO messages. By doing so, the misbehaving node may become the parent of all of its neighbors, and again divert a large part of the data traffic towards itself. In order to prevent the illegitimate increase of the version number and the illegitimate decrease of the rank value in DIO messages, we propose novel security extensions to the RPL protocol. The detailed description of those extensions can be found in [5].
B. Secure DTSN
The DTSN protocol [6][7] was intended for critical data transfer requiring end-to-end full reliability, in the fashion of TCP. Differently from the latter, for sake of improving energy efficiency in WSANs, DTSN employs a Selective Repeat Automatic Repeat reQuest (SR-ARQ) using negative acknowledgments (NACK). Positive acknowledgment packets (ACK) are also used to prevent the situations where the complete message or its last packet is lost (which cannot be detected solely based on NACKs). Both NACKs and ACKs are to be sent by the receiver only upon request by the sender (Explicit Acknowledgment Request – EAR), which can be piggy-backed in data packets at the end of each acknowledgement window (a transmission window consists of one or more acknowledgement windows). Intermediate nodes can also retransmit packets from their packet caches upon NACK interception, avoiding costly-end-to-end retransmissions.
In DTSN, a session is a source/destination relationship univocally identified by the tuple <Source Address, Destination Address, Application Identifier, Session Number>, designated the session identifier ( ). The Session Number works like a version number of the session. In case the receiver detects a change in the Session Number while the session is still active, it resets the session state, reporting which packets were missing from the previous Session Number, if any. This functionality was used in WSAN4CIP in order to establish a trade-off between fragment recovery delay and frame quality, with each video frame being transmitted with a different Session Number. This functionality is especially useful for the transmission of multi-layered video.
As shown in [8], reliable transport protocols are vulnerable to control packet manipulation attacks. In particular, a forged or altered ACK packet creates the false impression that data packets have been received by the destination while in reality they may have been lost, causing sender and destination to become out-of-sync with respect to the status of the session. On the other hand, NACK packets may be used to trigger useless retransmissions, leading to denial of service or at least to faster draining of the WSAN node batteries. To implement security at the lower layers is also energetically inefficient when not all applications have security requirements. These factors prompt the development of security mechanisms at the transport layer.
Though DTSN basically operates end-to-end, intermediate node caching can significantly improve its energy efficiency. This active participation of intermediate nodes means that they must be able to process and in some cases change the contents of DTSN headers, constraining the use of security solely between sender and receiver. The DTSN security extension proposed in [9] prevents the transport session to become out-of-sync through data, ACK and NACK packet authentication, using symmetric cryptography schemes exclusively.
The general idea of the security mechanism is the following: We assume that the source and the destination share a secret, which we call the session master key, and we denote it by . From this, they both derive an ACK master key and a NACK master key for the session as follows:
= ( ; “ ”; )
= ( ; “ ”; )
where is the pseudo-random function defined in [10] and is the DTSN session identifier. The length of K, , and is 128 bits each. Each data packet is extended with two MAC (Message Authentication Code) values computed over the packet itself with two different keys, an ACK key and a NACK key, both specific to the data packet and known only to the source and the destination. The ACK key ( ) and NACK key ( ) for the -th packet of the session (i.e., whose sequence number is ) are computed as follows:
( )
( )
= ( ; “ ”; )
When the destination wants to send an ACK referring to this data packet, it reveals its ACK key; similarly, when it wants to signal that this data packet is missing, it reveals its NACK key. Now, any intermediate node that has the data packet in question can verify if the NACK is authentic by checking if the appropriate MAC verifies correctly with the given key. As only the source and the destination can produce the right keys, but the source never reveals them, the intermediate node can be sure that the control information must have been sent by the destination. Besides, intermediate nodes manage the cache following a strict FIFO policy and thus they never delete cached data packets upon reception of a NACK or ACK. Regarding end-to-end synchronization, the source only deletes data packets from its transmission window if the appropriate MAC matches the ACK keys in control packets. A side effect of the scheme is that the MAC values provide end-to-end protection, meaning that the destination can check the authenticity and integrity of each received data packet, which is also a desirable feature.
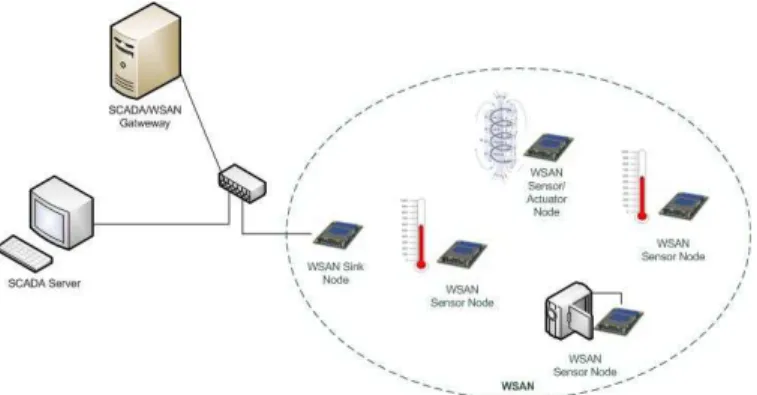
V. GATEWAY BETWEEN THE WSAN AND SCADA The substation devices are nowadays monitored and controlled through the Supervisory Control and Data Acquisition (SCADA) system. The WSAN is integrated with this existing system by means of a SCADA/WSAN Gateway, in order to provide a unified power distribution infrastructure interface to the human operators (Figure 4).
Figure 4. Integration between WSAN and SCADA system.
The SCADA protocol architecture is generic enough to be operated in an Internet Protocol (IP) environment on top of different network technologies such as Ethernet and SONET/SDH. However, the WSAN presents a specific networking environment where the energy and bandwidth optimization requirements are often incompatible with the request/response philosophy behind SCADA. These differences lead to the need of translating SCADA procedures to WSAN procedures and vice versa, which is the purpose of the SCADA/WSAN gateway.
The gateway consists of a PC equipped with an Ethernet interface. This Ethernet interface interconnects it to the SCADA system and to the WSAN sink node. The latter consists of a of a Silex SX-560 board. The WSAN sink node is the main destination of sensor data and main source of queries and configuration/command requests.
From the point of view of the SCADA system, the SCADA/WSAN gateway behaves as a database of sensing and management data that responds to its queries about the status of WSAN devices. The application interface for these queries is based on Web Services [11], with the gateway implementing the server side. On the other hand, the SCADA system implements the server side of Web Services related with urgent asynchronous notifications such as alarms. The use of the Web Service interface performs an adequate mapping of the SCADA data access mechanisms, which follows a client/server paradigm.
The main functions of the SCADA/WSAN gateway are: To translate between WSAN messages and Web
Services and vice-versa.
To keep the log of WSAN activity.
To detect WSAN topology changes and initiate route recovery by means of the RPL interface.
VI. TRIAL DEPLOYMENT
A proof-of-concept demonstrator was deployed at EDP Distribuição3 premises, more precisely at the São Sebastião primary substation, located in the neighborhood of the city of Setúbal, in the west of Portugal. The São Sebastião substation provides electric energy to the Setúbal region.
The EDP demonstrator encompasses the sections of the electricity distribution infrastructure, similar to the depiction in Figure 1.
The type and number of sensors deployed in the trial were as follows:
Trip-coil SX-560 sensor/actuator nodes : 2
Neutral Resistance SX-560 temperature sensor nodes: 1 Neutral Reactance SX-560 temperature sensor nodes: 1 HV/MV Transformer SX-560 temperature sensor
nodes: 1
Neutral Resistance Beagle board temperature sensor nodes: 1
Neutral Reactance Beagle board temperature sensor nodes: 1
HV/MV Transformer Beagle board temperature sensor nodes: 1
LV current measurement sensor nodes: 5 MV current measurement sensor nodes: 1
Secondary substation surveillance and hotspot detection Beagle board sensor node: 1
Extra SX-560 relay node to bridge the distance from the power lines to the secondary substation: 1
The SCADA system and WSAN Gateway were both deployed at the São Sebastião substation – as would be the case in a real system –, though in this case it remained logically separate from the EDP private network for security
3
reasons. External Internet connectivity to the SCADA server was provided in order to allow most of the functional and performance tests to be performed by the project partners from their own premises.
VII. PERFORMANCE RESULTS
Tests were conducted in the WSAN4CIP trial network in order to assess the performance of the supported services and compliance with the requirements provided by EDP Distribuição. Due to the high performance demand of multi-hop video transmission and the fact that video was transmitted on top of the DTSN transport protocol, the video performance tests are presented separately from the other applications.
A. Scalar Sensor Tests
For the current measurement tests, extra current was externally injected in the LV lines by the EDP technicians and the sensor reports were confronted against the known current injection values.
For the trip-coil, on-demand tests were performed while the trip-coil was operational. Then, the 110 V terminal was disconnected from the trip-coil to check whether the malfunction was automatically detected. The on-demand test was also repeated under this condition.
For the intrusion and hotspot detection tests, the respective situations were simulated by the EDP and INOV team. The tests entailed the transmission of images from the LV/MV power transformer to the primary substation. For the hotspot detection, a soldering iron was placed in front of the camera, while for intrusion detection, a member of the EDP team simulated intrusions in the secondary substations.
The measurement precision test results are listed in Table I and Table II. It should be noted that these results already have sensor calibration into account. Regarding the temperature measurements, the precision is high, with an average error of 1% and maximum of 3%. For the power line current measurements, the average error was 4.58% with peaks of 10.83%. This precision is enough to detect breakdown spots in the power-lines as well as to provide coarse reports about the distribution of current consumption within the EDP network. The remaining components feature a high precision.
TABLE I. TEMPERATURE AND CURRENT PRECISION EVALUATION.
Application Number of Trials Average Error Maximum Error Deviation Standard
Power Transformer Oil
Temperature4
10 1.0% 3.0% 0.4%
Power Line
Current 20 4.6% 10.9% 3.1%
4
Temperature precision measurements were similar for the Neutral Reactance and Neutral Resistance components, since the sensor node is the same.
TABLE II. EVENT PRECISION EVALUATION.
Application Number of Trials
Measurement Errors
Success Rate
Trip Coil 24 0 100%
Intrusion
Detection 11 0 100 %
Hotspot
Detection 10 0 100 %
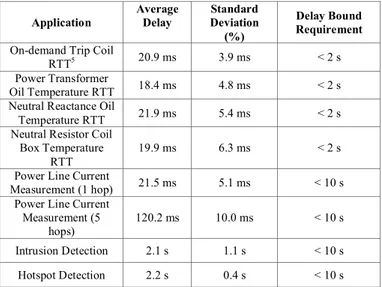
The delay performance results are listed in Table III.
TABLE III. DELAY EVALUATION.
Application
Average Delay
Standard Deviation
(%)
Delay Bound Requirement
On-demand Trip Coil
RTT5 20.9 ms 3.9 ms < 2 s Power Transformer
Oil Temperature RTT 18.4 ms 4.8 ms < 2 s Neutral Reactance Oil
Temperature RTT 21.9 ms 5.4 ms < 2 s Neutral Resistor Coil
Box Temperature RTT
19.9 ms 6.3 ms < 2 s
Power Line Current
Measurement (1 hop) 21.5 ms 5.1 ms < 10 s Power Line Current
Measurement (5 hops)
120.2 ms 10.0 ms < 10 s
Intrusion Detection 2.1 s 1.1 s < 10 s
Hotspot Detection 2.2 s 0.4 s < 10 s
The power-line sensing delay was measured at two different nodes, located at 1 hop and 5 hops from the sink. At 5 hops, the delay was still a small fraction of the allowed maximum. Intrusion and hotspot detection figures are relative to the sensor node located at the secondary substation, which was positioned at approximately 7 hops from the sink node.
Regarding packet losses, no packets were lost during the scalar sensor tests.
B. Video Performance
The results of the video performance evaluation tests are listed in Table IV. Results are presented for both DTSN and UDP, in both cases running over the IP protocol. UDP is currently the de facto transport protocol for delay-sensitive multimedia data, although it provides no reliability support.
As can be seen, both UDP and DTSN present similar delay and jitter performance, being able to comply with the requirements defined by EDP. DTSN achieves lower frame losses (0%) due to its error recovery mechanism, while achieving slightly lower delay. Although neither of the tested transport protocols is able to provide the required channel capacity of 768 Kbit/s, both are able to support the required resolution at a frame rate that is even higher than the one defined therein. The difference towards the required channel
5
capacity is also not too significant, being respectively 11.5% and 12.5% for UDP and DTSN.
TABLE IV. VIDEO STREAMING EVALUATION.
TransportProtoc ol
Paramete r
Averag e
Standar d Deviatio
n
Requiremen t
UDP
Delay 183 ms 35 ms < 10 s
Jitter 10 ms 4 ms < 200 ms
Throughpu t
233
Kbit/s - -
Video
frames lost 0.83% 2% < 2% Channel
capacity
680 Kbit/s
191
Kbit/s 768 Kbit/s
DTSN
Delay 176 ms 37 ms < 10 s
Jitter 11 ms 5 ms < 200 ms
Throughpu t
243
Kbit/s - -
Video
frames lost 0.00% 0.00% < 2% Channel
Capacity
672 Kbit/s
188
Kbit/s 768 Kbit/s
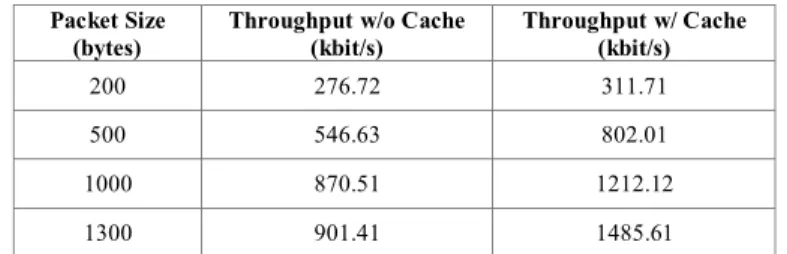
DTSN was separately tested with and without security functions enabled. For the unsecure configuration, DTSN was tested in a linear 3-hop topology, with a physical Packet Error Rate (PER) of 5% being introduced. The DTSN transmission window configuration was three acknowledgement windows of eight packets each. The results are listed in Table V for the full reliability scenario with different packet sizes, attesting the significant impact of intermediate node caching. Since it avoids end-to-end retransmissions, the caching mechanism is able to reduce the round-trip-time as well as to minimize the overhead, which leads to a throughput increment. The higher the packet loss rate, the higher the improvement using transport caching.
TABLE V. DTSN PERFORMANCE WITH DISABLED SECURITY.
Packet Size (bytes)
Throughput w/o Cache (kbit/s)
Throughput w/ Cache (kbit/s)
200 276.72 311.71
500 546.63 802.01
1000 870.51 1212.12
1300 901.41 1485.61
The impact of security was also evaluated in terms of the maximum achievable throughput. Experiments were carried out with a 7-hop topology where the sink node was a PC. The packet size was 1400 bytes. The results are listed in Table VI.
The impact of security can clearly be seen, especially when the destination of data is a sensor node. The performance increase introduced by caching can partially compensate the inefficiency introduced by the security mechanism, but only when the caching mechanism is
effective (i.e., for PER greater or equal than 5%), leading to higher throughput compared with the end-to-end solution even if without security.
TABLE VI. DTSN PERFORMANCE IN A 7-HOP TOPOLOGY.
Packet Error Rate (%)
Throughput (kbit/s)
w/o Cache w/o Security
w/ Cache w/o Security
w/Cache w/ Security
Sensor PC
PC Sensor
Sensor PC
PC Sensor
Sensor PC
PC Sensor
0 1112 1009 1119 1084 1098 1007
5 782 655 865 952 810 778
10 699 584 719 850 705 703
VIII. TECHNOLOGY EVALUATION
This section presents the technology evaluation on the deployment of the WSAN4CIP solution in the EDP electricity distribution network, taking also a business-oriented perspective besides the technical perspective. These conclusions are based both on the results of the WSAN4CIP trial and on data from EDP.
A. Scalability of the solution
Taking into account the throughput provided by IEEE 802.11g, the traffic patterns as well as the deployment constraints of the solution, it is clear that the main scalability challenges are related with the transmission of video from the secondary substations through the MV lines to the gateway located at the primary substation. In fact, the substation traffic generated by the sensors is very low and has to cross at most 2 hops, therefore it is not a scalability issue. Also the current measurements at the MV towers, besides presenting a low data rate, can be additionally aggregated along the subnetwork tree in order to reduce the traffic even more, which means that this is also not a scalability problem.
The integrated intrusion detection solution allows the video streaming to be activated only upon detection of the intrusion event, which may be triggered by the Passive Infrared (PIR) movement detector. A similar solution was implemented regarding hotspot detection and Infrared (IR) video streaming, in which activation of the video stream is triggered based on a temperature threshold. Since these events are rare and are very unlikely to occur simultaneously (at least in significant numbers), the selected technology and deployment architecture are enough to support these services. However, a commercial solution would require additional software functionality that was not implemented in the prototype, namely the capability to alternate between video streams, while temporarily switching-off the streams that are not being visualized at the moment. This would significantly increase the number of intrusion detection and hotspot events that can be simultaneously monitored.
B. Impact on business
When evaluating the advantages of the proposed system on EDP’s business, it must be taken into account that as an energy distribution company, EDP’s objectives go beyond getting financial profits. EDP has also an important social role. Hence, although it was not possible to get precise figures on the financial impact of the proposed solution, the following advantages can be readily identified:
1. The timely detection of a trip-coil break down will ensure that the repair is done before the protected equipment (e.g. neutral reactance/resistance and ultimately the MV/HV power transformer) is damaged, preventing long blackouts that would affect the population of Setúbal (the nearby city in this deployment) as well as industrial clients.
2. The timely detection of a neutral resistance/reactance malfunction will avoid that the protected HV/MV power transformer is damaged upon the occurrence of a short circuit in the MV lines.
3. The quick detection and localization of a problem in some segment of the power-lines will speed-up the repair, minimizing the time that the clients will remain without energy.
4. The timely detection of a malfunction on the MV/LV power transformers will minimize the damage and allow a quick repair, minimizing the impact on the clients.
5. The surveillance of the secondary substations will discourage theft of equipment or vandalism activities, which will also improve the service offered to EDP clients.
IX. CONCLUSION
This paper has presented a WSAN for monitoring and increasing the dependability of a power grid distribution infrastructure. Requirements of the power distribution infrastructure such as transmission ranges and throughput have led to an IEEE 802.11g solution coupled with energy harvesting to recharge the WSAN node batteries in places where they cannot be directly fed from the power infrastructure. On the other hand, dependability requirements have led to special reliability and security mechanisms being embedded in the transport and routing protocols.
A pilot system was deployed for a trial in the power distribution grid in the region of Setúbal, Portugal. Performance results indicate that the proposed architecture is able to meet the application requirements.
ACKNOWLEDGMENT
The research leading to these results has received funding from the European Community's Seventh Framework Programme (FP7/2007-2013) under grant agreement n° 225186 (www.wsan4cip.eu). The authors acknowledge also the funding from FCT - Fundação para a Ciência e a Tecnologia (INESC-ID multiannual funding) through the PIDDAC program.
The information in this document is provided 'as is', and no guarantee or warranty is given that the information is fit for any particular purpose. The use of the information is at the sole risk and liability of the user.
REFERENCES
[1] D. Gessner, M. Selhorst, C. Stüble, P. Langendoerfer, “Realising a Trustworthy Sensor Node with the Idea of Virtualization,” Proceedings of the 6th Future Security Conference 2011, Berlin, Germany, September 2011.
[2] T. Winter, P. Thubert, A. Brandt, T. Clausen, J. Hui, R. Kelsey, P. Levis, K. Pister, R. Struik, and J. Vasseur, “RPL: IPv6 Routing Protocol for Low power and Lossy Networks,” Internet Draft, draft-ietf-roll-rpl-19, March 2011.
[3] P. Thubert (ed), “RPL Objective Function 0,” Internet Draft, draft-ietf-roll-of0-19, March 2011.
[4] T. Tsao, M. Dohler, V. Daza, and A. Lozano, “A security framework for Routing over Low power and Lossy Networks,” Internet Draft, draft-ietfroll-security-framework-06, June 2011.
[5] A. Dvir, T. Holczer, L. Dora, L. Buttyan, “Version Number and Rank Authentication for RPL,” Internet Draft, draft-dvir-roll-security-authentication-00, July 2011.
[6] B. Marchi, A. Grilo, and M. Nunes, "DTSN: Distributed Transport for Sensor Networks," Proceedings of the IEEE Symposium on Computers and Communications (ISCC'07), Aveiro, Portugal, IEEE, ISBN 978-1-4244-1520-5, 1-4 July 2007, pp.165-172.
[7] F. Rocha, A. Grilo, P.R. Pereira, M.S. Nunes, and A. Casaca, "Performance Evaluation of DTSN in Wireless Sensor Networks," Proceedings of Wireless Systems and Mobility in Next Generation Internet: 4th International Workshop of the EuroNGI/EuroFGI Network of Excellence Barcelona, Spain, January 16-18, 2008 Revised Selected Papers, Springer-Verlag, 2008, pp. 1-9.
[8] L. Buttyan and L. Csik, “Security analysis of reliable transport layer protocols for wireless sensor networks,” in Proceedings of the IEEE Workshop on Sensor Networks and Systems for Pervasive Computing (PerSeNS), March 2010.
[9] L. Buttyán, A. Grilo, “A Secure Distributed Transport Protocol for Wireless Sensor Networks”, Proceedings of the IEEE International Conference on Communications 2011 (ICC’2011), Kyoto, Japan, June 2011.
[10] T. Dierks and E. Rescorla, “The Transport Layer Security (TLS) Protocol Version 1.2,” Internet RFC 5246, August 2008.